Let’s say you’re on SQL Server 2019. No, seriously. It’s been out for a couple weeks now.
You could be.
I say that you could be because you’re the kind of brave person who tries new things and experiments with their body server.
You may even do crazy things like this.
Stone Cold
CREATE TABLE #t ( id INT, INDEX c CLUSTERED COLUMNSTORE );

SELECT    COUNT_BIG(*) AS records
FROM      dbo.Users AS u
JOIN      dbo.Posts AS p
    ON u.Id = p.OwnerUserId
JOIN      dbo.Comments AS c
    ON u.Id = c.UserId
LEFT JOIN #t AS t ON 1 = 0;
Woah ho ho. What happened there? A #temp table with a clustered column store index on it left joined on 1 = 0?
Yes. People do this.
People do this because it’s getting some batch mode operations “for free”, which have the nasty habit of making big reporting queries run a lot faster.
Yonder Problem
When you enable 2019’s new in memory tempdb, which can really help with stuff tempdb needs help with, you may find yourself hitting errors.
Msg 11442, Level 16, State 1, Line 14
Columnstore index creation is not support in tempdb when memory-optimized metadata mode is enabled.
Msg 1750, Level 16, State 1, Line 14
Could not create constraint or index. See previous errors.
The good news is that this works with *real* tables, too.
CREATE TABLE dbo.t ( id INT, INDEX c CLUSTERED COLUMNSTORE );

SELECT    COUNT_BIG(*) AS records
FROM      dbo.Users AS u
JOIN      dbo.Posts AS p
    ON u.Id = p.OwnerUserId
JOIN      dbo.Comments AS c
    ON u.Id = c.UserId
LEFT JOIN dbo.t AS t ON 1 = 0;
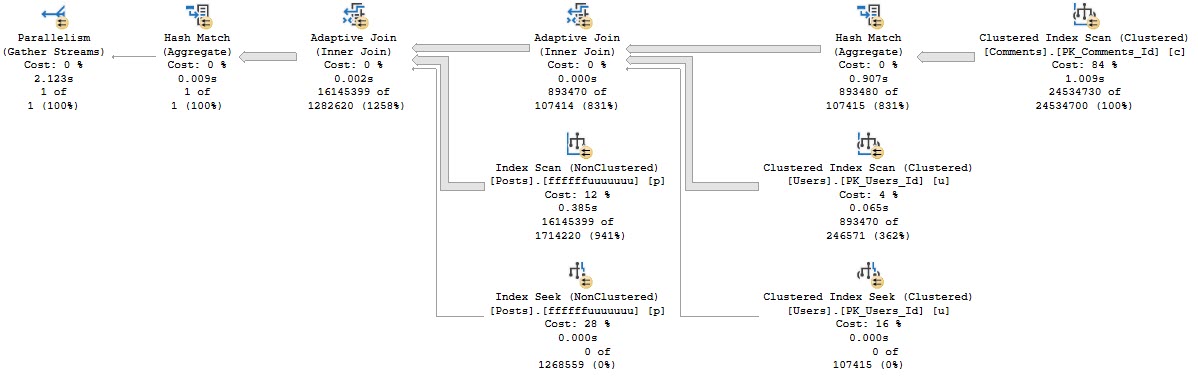
And you can get plans with all sorts of Batchy goodness in them.
Long way from home
Yeah, you’re gonna have to change some code, but don’t worry.
You’re the kind of person who enjoys that.
Right?
Thanks for reading!
Going Further
If this is the kind of SQL Server stuff you love learning about, you’ll love my training. Blog readers get 25% off the Everything Bundle — over 100 hours of performance tuning content. Need hands-on help? I offer consulting engagements from targeted investigations to ongoing retainers. Want a quick sanity check before committing to a full engagement? Schedule a call — no commitment required.
There’s a strange response to some things in the SQL Server community that borders on religious fervor. I once worked with someone who chastised me for having SELECT * in some places in the Blitz scripts. It was odd and awkward.
Odd because this person was the most Senior DBA in the company, and awkward because they didn’t believe me that it didn’t matter in some cases.
People care about SELECT * for many valid reasons, but context is everything.
One For The Money
The first place it doesn’t matter is EXISTS. Take this index and this query:
CREATE INDEX specatular_blob ON dbo.Posts(PostTypeId, OwnerUserId);

SELECT COUNT(*) AS records
FROM   dbo.Users AS u
WHERE  EXISTS ( SELECT *
                FROM dbo.Posts AS p
				WHERE p.OwnerUserId = u.Id
				AND p.PostTypeId = 2 );
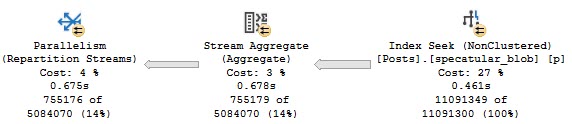
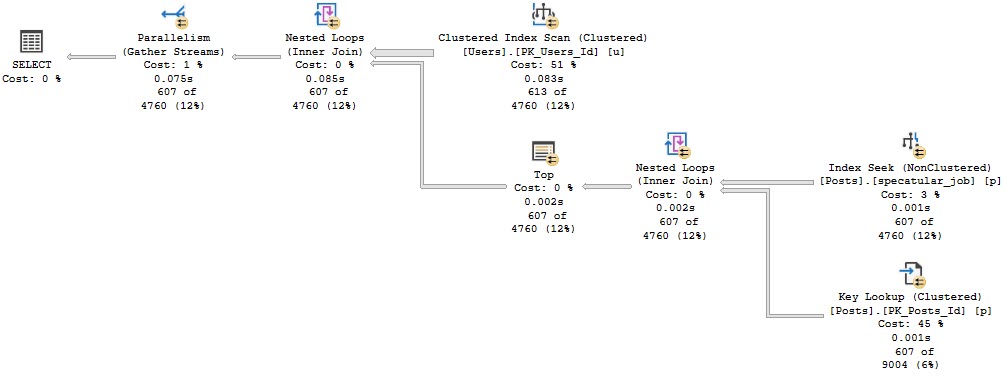
The relevant part of the query plan looks like this:
What’s My Name
We do a seek into the index we created on the two columns in our WHERE clause. We didn’t have to go back to the clustered index for everything else in the table.
That’s easy enough to prove if we only run the subquery — we have to change it a little bit, but the plan tells us what we need.
SELECT *
FROM   dbo.Posts AS p
WHERE  p.OwnerUserId = 22656
AND    p.PostTypeId = 2;
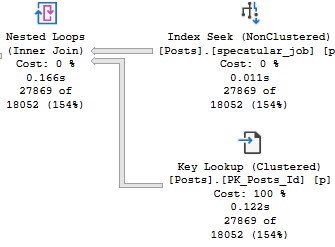
This time we do need the clustered index:
Who We Be
You can even change it to something that would normally throw an error:
SELECT COUNT(*) AS records
FROM   dbo.Users AS u
WHERE  EXISTS ( SELECT 1/0
                FROM dbo.Posts AS p
				WHERE p.OwnerUserId = u.Id
				AND p.PostTypeId = 2 );
Two For Completeness
Another example is in derived tables, joins, and apply.
Take these two queries. The first one only selects columns in our nonclustered index (same as above).
The second one actually does a SELECT *.
/*selective*/
SELECT     u.Id,
           u.DisplayName,
		   ca.OwnerUserId, --I am only selecting columns in our index
		   ca.PostTypeId,
		   ca.Id
FROM       dbo.Users AS u
CROSS APPLY( SELECT TOP (1) * --I am select *
             FROM dbo.Posts AS p
			 WHERE p.OwnerUserId = u.Id
			 AND p.PostTypeId = 2
			 ORDER BY p.OwnerUserId DESC, p.Id DESC) AS ca
WHERE U.Reputation >= 100000;

/*less so*/
SELECT     u.Id,
           u.DisplayName,
		   ca.* --I am select *
FROM       dbo.Users AS u
CROSS APPLY( SELECT TOP (1) * --I am select *
             FROM dbo.Posts AS p
			 WHERE p.OwnerUserId = u.Id
			 AND p.PostTypeId = 2
			 ORDER BY p.OwnerUserId DESC, p.Id DESC) AS ca
WHERE U.Reputation >= 100000;
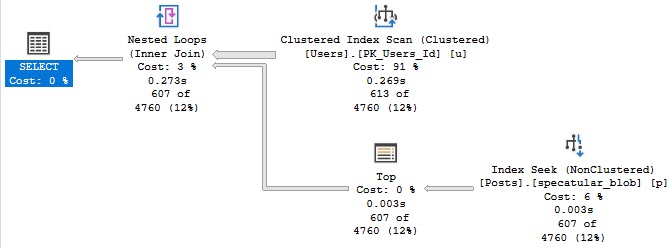
The first query only touches our narrow nonclustered index:
Blackout
The second query does a key lookup, because we really do select everything.
Party Up
Trash Pile
I know, you’ve been well-conditioned to freak out about certain things. I’m here to help.
Not every SELECT * needs to be served a stake through the heart and beheading.
Thanks for reading!
Going Further
If this is the kind of SQL Server stuff you love learning about, you’ll love my training. Blog readers get 25% off the Everything Bundle — over 100 hours of performance tuning content. Need hands-on help? I offer consulting engagements from targeted investigations to ongoing retainers. Want a quick sanity check before committing to a full engagement? Schedule a call — no commitment required.
I’m going to be delivering my Total Server Tuning material, which has been a hit at a whole bunch of events this past year. It’s an eye-opening full day of training where you’ll find out all my favorite ways that things can go wrong with SQL Server hardware, queries, and indexes.
And of course, how you can outsmart SQL Server.
Which is pretty hard.
Like, doctors work on it and stuff.
See you there!
For a limited time, use the coupon code “votesql” for $50 off.
Going Further
If this is the kind of SQL Server stuff you love learning about, you’ll love my training. Blog readers get 25% off the Everything Bundle — over 100 hours of performance tuning content. Need hands-on help? I offer consulting engagements from targeted investigations to ongoing retainers. Want a quick sanity check before committing to a full engagement? Schedule a call — no commitment required.
If you’re starting from scratch with column store, here are some links that’ll help you get a better understanding of how they work, and what they’re good for, start here.
For some background information on column store indexes, see these:
If this is the kind of SQL Server stuff you love learning about, you’ll love my training. Blog readers get 25% off the Everything Bundle — over 100 hours of performance tuning content. Need hands-on help? I offer consulting engagements from targeted investigations to ongoing retainers. Want a quick sanity check before committing to a full engagement? Schedule a call — no commitment required.
To get you started exploring the Stack Overflow column store database, here are some queries that show how tables are related.
The two main relationships are User Id, and Post Id.
User Id
/*User Id*/
SELECT COUNT_BIG(*) AS records
FROM dbo.Users AS u
JOIN dbo.Badges AS b
    ON b.UserId = u.Id;

SELECT COUNT_BIG(*) AS records
FROM dbo.Users AS u
JOIN dbo.Comments AS c
    ON c.UserId = u.Id;

SELECT COUNT_BIG(*) AS records
FROM dbo.Users AS u
JOIN dbo.Posts AS p
    ON p.OwnerUserId = u.Id;

SELECT COUNT_BIG(*) AS records
FROM dbo.Users AS u
JOIN dbo.Votes AS v
    ON v.UserId = u.Id;
Post Id
/*Post Id*/
SELECT COUNT_BIG(*) AS records
FROM dbo.Posts AS p
JOIN dbo.Comments AS c
    ON c.PostId = p.Id;

SELECT COUNT_BIG(*) AS records
FROM dbo.Posts AS p
JOIN dbo.Votes AS v
    ON v.PostId = p.Id;
Note-ry
A couple things to note, here:
Joining Users to Votes is unreliable, because most of the voting is anonymized in the dump
Things get much more interesting when you start building queries within relationships
For example, using the User Id columns in tables that aren’t users to join larger tables together, or joining Comments to Votes on Post Id.
You can really start to feel your CPU fans.
Thanks for reading!
Going Further
If this is the kind of SQL Server stuff you love learning about, you’ll love my training. Blog readers get 25% off the Everything Bundle — over 100 hours of performance tuning content. Need hands-on help? I offer consulting engagements from targeted investigations to ongoing retainers. Want a quick sanity check before committing to a full engagement? Schedule a call — no commitment required.
If you want to download the database, here’s the magnet link for the torrent. I don’t have another means of distributing this; it’s too big of a file.
If you want the GitHub scripts to create and load data, head over here.
Info
If you’re downloading the database, it’s about a 80 GB backup file, that needs to be restored to SQL Server 2017 or higher. It expands to a database that’s about 160 GB. It’s not the biggest database in the world, but it’s a good starting place to learn about column store. You can always make it bigger, if you want.
If you’re comfortable with a database of that size on your computer (compared to the hardware), then downloading is fine. The computers I use it on have 64-128 GB of RAM.
Some people may want to build their own and find a size that better fits their hardware, which is where the create and build scripts make more sense. I wouldn’t wanna see you trying to query tables of this size on a laptop with a VM admin amount of RAM (say 16GB or less).
Scripts To Help You Explore Column Store
Great scripts to help you look at what SQL Server’s DMVs have to say about column store indexes live here: Columnstore Indexes Scripts Library
And of course, poke around this site for Joe Obbish’s posts about column store, along with Niko’s site for his material.
Thanks for reading!
Going Further
If this is the kind of SQL Server stuff you love learning about, you’ll love my training. Blog readers get 25% off the Everything Bundle — over 100 hours of performance tuning content. Need hands-on help? I offer consulting engagements from targeted investigations to ongoing retainers. Want a quick sanity check before committing to a full engagement? Schedule a call — no commitment required.
Rather than an F5 script to do this, I decided to make a stored procedure out of it. It’s in good shape, but if you find any problems or have any requests, head over to my GitHub repo to file an issue.
One thing I’d love feedback on is advancing dates. Right now, the script doesn’t do that at all. I thought of different ways to handle it, but didn’t like any of them, mostly because of how it might mess with the partitioning function I’m using. I felt like I was overthinking it quite a bit, and decided to leave dates as-is, and only increment User and Post Ids.
A quick note: This script assumes that a database called StackOverflow will be the source of the loads. If you need to use a different version, that’s a manual change. I didn’t want to go down the dynamic SQL route here until I gauged popularity.
Options
The stored procedure has relatively few options.
@loops INT = 1
@truncate_tables BIT = 1
@rebuild_when_done BIT = 1
@count_when_done BIT = 1
How many loops you want to run, if you want to start fresh by truncating tables first, if you want to rebuild indexes after you’re done loading, and if you want to get a count from each table at the end.
There are good enough reasons to include these for you to decide on. For instance, you might want to:
Start fresh, and see what the DMVs say about column store compression without rebuilding
Load on top and then see what they say without rebuilding
Do the opposite
Make additional bullet points
Iter and Iterate Walked Into A Store
Without being too explain-y, the way the script works is to:
Figure out if we need to increment Ids
Go through each of the main tables (Badges, Comments, Posts, Users, Votes) and insert the contents into the CCI version
Do this for as many loops as you specify
At the end of the script, do some cleanup of things that shouldn’t exist. Then rebuild and get counts if you asked for it.
In tomorrow’s post, I’ll give you download links and some more details about the database.
Thanks for reading!
Going Further
If this is the kind of SQL Server stuff you love learning about, you’ll love my training. Blog readers get 25% off the Everything Bundle — over 100 hours of performance tuning content. Need hands-on help? I offer consulting engagements from targeted investigations to ongoing retainers. Want a quick sanity check before committing to a full engagement? Schedule a call — no commitment required.
I really wanted a version of the Stack Overflow data dump that was all clustered column store. In SQL Server 2016, that didn’t really work because of restrictions around MAX data types. In 2017 it did, but… If your data warehouse has a bunch of max data type columns, that’s bad and you should feel bad.
The problem here is that once you drop out the “big” columns (AboutMe from Users, Text from Comments, Body from Posts), the entire ~300GB database compressed down to about 6GB. That means if we want a realistically sized data warehouse, we’d need a “Make Big” script, like people used to use for Adventure Works before it went out of business.
This week I’m going to talk about that process, and share links to download the examples so you can mess with them, or create your own.
Today, I’m going to talk about some of the design considerations, and what the initial setup script does, if you want to build your own version.
Hand In Hand
“Large” column store tables should be partitioned. While no one in their right mind would consider partitioning to be a performance feature with row store indexes, it can be beneficial to column store indexes. One of the first things I create after the standard database script-out is a partition function and scheme.
    CREATE PARTITION FUNCTION pfunc (DATETIME)
    AS RANGE RIGHT FOR VALUES
    (
	    N'2007-01-01T00:00:00.000',
        N'2008-01-01T00:00:00.000',
        N'2009-01-01T00:00:00.000',
        N'2010-01-01T00:00:00.000',
        N'2011-01-01T00:00:00.000',
        N'2012-01-01T00:00:00.000',
        N'2013-01-01T00:00:00.000',
        N'2014-01-01T00:00:00.000',
        N'2015-01-01T00:00:00.000',
        N'2016-01-01T00:00:00.000',
        N'2017-01-01T00:00:00.000',
        N'2018-01-01T00:00:00.000',
        N'2019-01-01T00:00:00.000',
        N'2020-01-01T00:00:00.000'
The years here go up to 2020. This covers you in case your source database is either the full size version, or the 2010 or 2013 version.
The scheme I create puts everything on the primary filegroup. Since the bones of this database is a backup/restore, it has four files, but they’re all in the primary filegroup. You’re welcome to change that, but I don’t find it necessary.
CREATE PARTITION SCHEME pscheme AS PARTITION pfunc ALL TO ([PRIMARY]);
Also I’m a bit lazy.
Swimmin’ In Synonyms With Their Own Condominiums
I did something kind of goofy at first. When I was experimenting with doing this, everything was in one database. So uh, I suffixed all the column store tables with “_cs”.
That turned out to be really annoying when running different demo scripts against this database, because I’d have to change all the names. To get around that, I created synonyms, but that felt hacky too.
For instance, any time I needed to write a DMV query that referenced a table, I’d screw up and reference the synonym, which doesn’t quite work as well as you’d hope. By that I mean not at all.
In the final version, all object names match those in other versions of the Stack Overflow database.
Tomorrow
In tomorrow’s post, I’ll show you parts of the script that use a StackOverflow database of your choice as a source to build up the column store version.
Thanks for reading!
Going Further
If this is the kind of SQL Server stuff you love learning about, you’ll love my training. Blog readers get 25% off the Everything Bundle — over 100 hours of performance tuning content. Need hands-on help? I offer consulting engagements from targeted investigations to ongoing retainers. Want a quick sanity check before committing to a full engagement? Schedule a call — no commitment required.
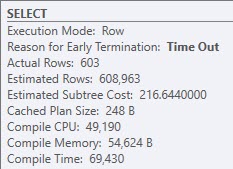
I ran into a very funny situation while working with a client recently. They were using Entity Framework, and a query with around 10 left joins ended up with a compile time of nearly 70 seconds.
Relatively.
Once the query finished compiling, it ran instantly with a pretty simple plan with all nested loops joins.
So what happened?
Tracing Flags
For science, I broke out a Rocket Science Trace Flag™ that will show optimization phases and how long were spent in them.
What came back looked like this:
end exploration, tasks: 3098 Cost = 242.433 time: 0 net: 0 total: 0.049 net: 0.047
end exploration, tasks: 3099 Cost = 242.433 time: 0 net: 0 total: 0.049 net: 0.047
end exploration, tasks: 3104 Cost = 242.433 time: 0 net: 0 total: 0.049 net: 0.048
end exploration, tasks: 3331 Cost = 242.433 time: 0.002 net: 0.002 total: 0.052 net: 0.05
end exploration, tasks: 3332 Cost = 242.433 time: 0 net: 0 total: 0.052 net: 0.05
end search(1),  cost: 210.273 tasks: 3332 time: 0 net: 0 total: 0.052 net: 0.05
*** Optimizer time out abort at task 211100 ***
end search(2),  cost: 210.273 tasks: 211100 time: 69.214 net: 69.678 total: 69.267 net: 69.729
*** Optimizer time out abort at task 211100 ***
End of post optimization rewrite, time: 0.001 net: 0.001 total: 69.268 net: 69.73
End of query plan compilation, time: 0.002 net: 0.002 total: 69.271 net: 69.732
The numbers aren’t quite the same, since the plan is from a different run than when I captured the trace flag (8675) output.
But you can see pretty clearly, in Search 2, we hung out for a while trying different rewrites.
What happens during Search 2? The whole enchilada.
In this case? Probably mostly join reordering.
Tracking Lags
If you don’t have query store enabled, it’s possible to search the plan cache, or get a warning from BlitzCache for long compile times.
If you do have Query Store enabled, compile time is logged in a couple places:
SELECT TOP (10)
       qsq.query_id,
       qsq.query_text_id,
       qsq.initial_compile_start_time,
       qsq.last_compile_start_time,
       qsq.last_execution_time,
       qsq.count_compiles,
	   qsq.last_compile_duration / 1000000. last_compile_duration,
       qsq.avg_compile_duration / 1000000. avg_compile_duration,
       qsq.avg_bind_duration / 1000000. avg_bind_duration,
       qsq.avg_bind_cpu_time / 1000000. avg_bind_cpu_time,
       qsq.avg_optimize_duration / 1000000. avg_optimize_duration,
       qsq.avg_optimize_cpu_time / 1000000. avg_optimize_cpu_time,
       qsq.avg_compile_memory_kb / 1024. avg_compile_memory_mb,
       qsq.max_compile_memory_kb / 1024. max_compile_memory_mb
--INTO   #query_store_query
FROM sys.query_store_query AS qsq
WHERE qsq.is_internal_query = 0
AND qsq.avg_compile_duration >= 1000000. --This is one second in microseconds
ORDER BY avg_compile_duration DESC

SELECT TOP (10)
       qsp.plan_id,
       qsp.query_id,
       qsp.engine_version,
       qsp.count_compiles,
       qsp.initial_compile_start_time,
       qsp.last_compile_start_time,
       qsp.last_execution_time,
       qsp.avg_compile_duration / 1000000. avg_compile_duration,
       qsp.last_compile_duration / 1000000. last_compile_duration,
       CONVERT(XML, qsp.query_plan) query_plan
--INTO   #query_store_plan
FROM sys.query_store_plan AS qsp
WHERE  qsp.avg_compile_duration >= 1000000. --This is one second in microseconds
ORDER BY  qsp.avg_compile_duration DESC
I’ve seen different numbers show up in these, so I like to look at both. I don’t know why that happens. There’s probably a reasonable explanation.
If you wanted to add in some other metrics, you could do this:
DROP TABLE IF EXISTS #query_store_query;
DROP TABLE IF EXISTS #query_store_plan;

SELECT TOP (10)
       qsq.query_id,
       qsq.query_text_id,
       qsq.initial_compile_start_time,
       qsq.last_compile_start_time,
       qsq.last_execution_time,
       qsq.count_compiles,
	   qsq.last_compile_duration / 1000000. last_compile_duration,
       qsq.avg_compile_duration / 1000000. avg_compile_duration,
       qsq.avg_bind_duration / 1000000. avg_bind_duration,
       qsq.avg_bind_cpu_time / 1000000. avg_bind_cpu_time,
       qsq.avg_optimize_duration / 1000000. avg_optimize_duration,
       qsq.avg_optimize_cpu_time / 1000000. avg_optimize_cpu_time,
       qsq.avg_compile_memory_kb / 1024. avg_compile_memory_mb,
       qsq.max_compile_memory_kb / 1024. max_compile_memory_mb
INTO   #query_store_query
FROM sys.query_store_query AS qsq
WHERE qsq.is_internal_query = 0
AND qsq.avg_compile_duration >= 1000000. --This is one second in microseconds
ORDER BY avg_compile_duration DESC;

SELECT TOP (10)
       qsp.plan_id,
       qsp.query_id,
       qsp.engine_version,
       qsp.count_compiles,
       qsp.initial_compile_start_time,
       qsp.last_compile_start_time,
       qsp.last_execution_time,
       qsp.avg_compile_duration / 1000000. avg_compile_duration,
       qsp.last_compile_duration / 1000000. last_compile_duration,
       CONVERT(XML, qsp.query_plan) query_plan
INTO   #query_store_plan
FROM sys.query_store_plan AS qsp
WHERE  qsp.avg_compile_duration >= 1000000. --This is one second in microseconds
ORDER BY  qsp.avg_compile_duration DESC;

SELECT (avg_cpu_time - qsq.avg_compile_duration) AS cpu_time_minus_qsq_compile_time,
       (avg_cpu_time - qsp.avg_compile_duration) AS cpu_time_minus_qsp_compile_time,
       qsrs.avg_cpu_time,
       qsrs.avg_duration,
       qsq.avg_compile_duration,
       qsq.avg_bind_duration,
       qsq.avg_bind_cpu_time,
       qsq.avg_optimize_duration,
       qsq.avg_optimize_cpu_time,
       qsq.avg_compile_memory_mb,
       qsp.avg_compile_duration,
       qsq.count_compiles,
       qsrs.count_executions,
       qsp.engine_version,
       qsp.query_id,
	   qsp.plan_id,
	   CONVERT(XML, qsp.query_plan) query_plan,
       qsqt.query_sql_text,
       qsrs.first_execution_time,
       qsrs.last_execution_time,
       qsq.initial_compile_start_time,
       qsq.last_compile_start_time,
       qsq.last_execution_time
FROM #query_store_query AS qsq
JOIN #query_store_plan AS qsp
ON qsq.query_id = qsp.query_id
JOIN sys.query_store_query_text AS qsqt
ON qsqt.query_text_id = qsq.query_text_id
JOIN
(
SELECT qsrs.plan_id,
       qsrs.first_execution_time,
       qsrs.last_execution_time,
       qsrs.count_executions,
       qsrs.avg_duration / 1000000. avg_duration,
       qsrs.avg_cpu_time / 1000000. avg_cpu_time
FROM sys.query_store_runtime_stats AS qsrs
) AS qsrs
ON qsrs.plan_id = qsp.plan_id
ORDER BY qsq.avg_compile_duration DESC;
--ORDER BY qsp.avg_compile_duration DESC;
Fixes?
For EF, the only solution was to use a plan guide with a FORCE ORDER hint supplied. This let us arm wrestle the optimizer into just joining the tables in the order that the joins are written in the query. For some reason, forcing the plan with query store did not force the plan that forced the order.
I didn’t dig much into why. I do not get along with query store most of the time.
If you’re finding this happen with queries you have control over, doing your own rewrites to simplify the query and reduce the number of joins that the optimizer has to consider can help.
Thanks for reading!
Going Further
If this is the kind of SQL Server stuff you love learning about, you’ll love my training. Blog readers get 25% off the Everything Bundle — over 100 hours of performance tuning content. Need hands-on help? I offer consulting engagements from targeted investigations to ongoing retainers. Want a quick sanity check before committing to a full engagement? Schedule a call — no commitment required.
Startup Expression Predicates can be helpful. They may also exacerbate parameter sniffing issues in similar ways to IF branches.
Take a simple example:
CREATE INDEX bud_light ON dbo.Posts(OwnerUserId, Score);
CREATE INDEX coors_light ON dbo.Comments(UserId, Score);
GO

CREATE OR ALTER PROCEDURE dbo.sup (@check_posts BIT,  @check_comments BIT, @post_score INT, @comment_score INT)
AS
BEGIN

    SELECT MAX(ISNULL(p.CreationDate, c.CreationDate)) AS max_date,
	       COUNT_BIG(*) AS records
    FROM dbo.Users AS u
    LEFT JOIN dbo.Posts AS p
        ON  @check_posts = 1
        AND p.OwnerUserId = u.Id
    	AND p.Score > @post_score
    LEFT JOIN dbo.Comments AS c
        ON  @check_comments = 1
        AND c.UserId = u.Id
    	AND c.Score > @comment_score;

END
GO
This gives users — and users only — an easy way to get data from certain tables.
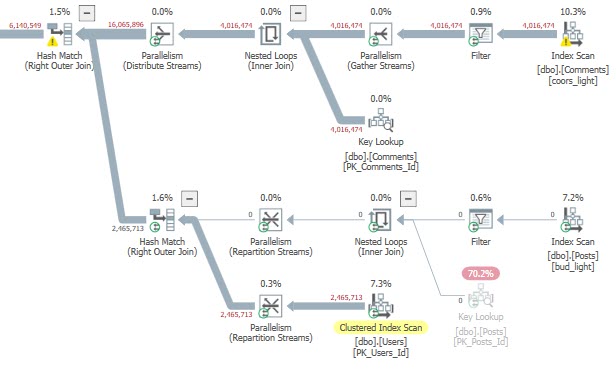
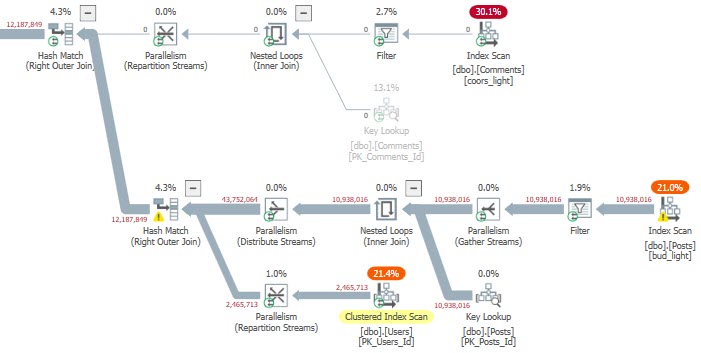
This does not give the optimizer a good way of coming up with an execution plan to get or or the other, or both.
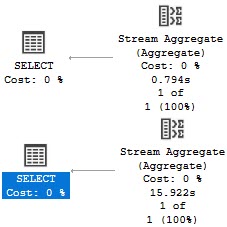
The first finishes instantly, the second not so instantly.
The Times
ENHANCE
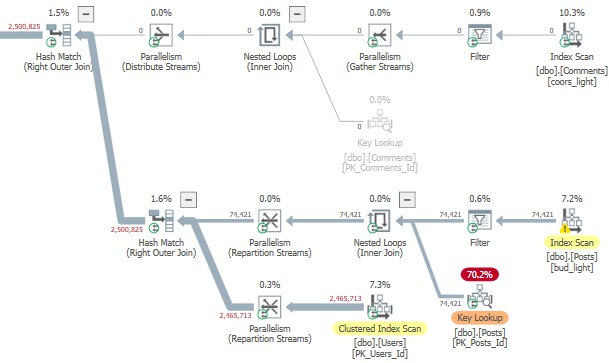
The problem is a bit easier to visualize in Sentry One Plan Explorer than SSMS, which greys out sections of the query plan that aren’t used.
The cached plan was totally unpreparedIt shows when the second query runs
Four million Key Lookups isn’t my idea of a good time.
If we switch things up, the results are even worse. The bad plan runs for nearly a full minute.
teeeeeeeeen million
So uh, you know. Be careful out there, when you’re trying to be more cleverer than the optimizerer.
Thanks for reading!
Going Further
If this is the kind of SQL Server stuff you love learning about, you’ll love my training. Blog readers get 25% off the Everything Bundle — over 100 hours of performance tuning content. Need hands-on help? I offer consulting engagements from targeted investigations to ongoing retainers. Want a quick sanity check before committing to a full engagement? Schedule a call — no commitment required.