This is always fun to talk to people about, because of all the misconceptions around the concept.
You need to find rows in one table that don’t have a match in another table. Maybe it’s a reconciliation process, maybe it’s part of ETL or something.
Doesn’t matter. Pay attention!
Choices
The way most people will write this query on the first try is like this:
    SELECT   COUNT_BIG(u.Id) AS records
    FROM     dbo.Users AS u
    LEFT JOIN     dbo.Posts AS p
        ON u.Id = p.OwnerUserId
    WHERE p.Id IS NULL;
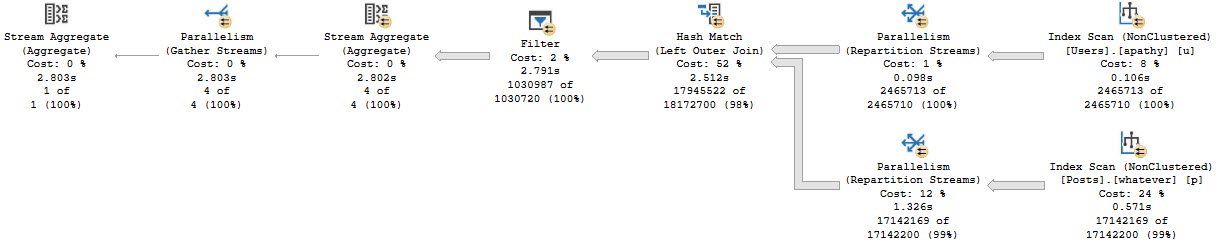
The query plan has one of my (generally) least favorite things in it: A filter.
2.8 seconds!
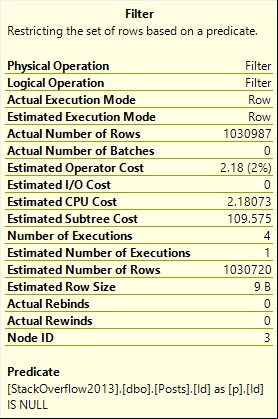
What’s the filter doing?
EZ-NULLZ
Looking for NULL values after the join. Yuck.
Better Choices
Expressed more SQL-y, we could use NOT EXISTS.
    SELECT   COUNT_BIG(u.Id) AS records
    FROM     dbo.Users AS u
    WHERE NOT EXISTS ( SELECT 1/0
                       FROM dbo.Posts AS p
    				   WHERE p.OwnerUserId = u.Id );
I mean, look, the Id column in the Posts table is the PK/CX. That means it can’t be NULL, unless it’s a non-matched row in a left join.
If that column is NULL, then every other column will be NULL too. You don’t ever need to select any data from the Posts table.
The query plan looks like this now:
1.6 seconds
This performs better (under most circumstances), and gets some additional optimizations: A Bitmap, and a pre-aggregation of the OwnerUserId column in the Posts table.
Other Than Speed?
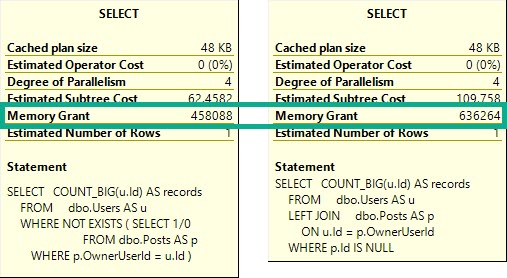
The Not Exists query will ask for around ~200MB less memory to run.
Every Penny
Why is this? Why is there such a difference between logically equivalent queries?
The Left Join version forces both tables to be fully joined together, which produces matches and non-matches.
After the join, we eliminate non-matches in the Filter. This is why I’m generally suspicious of Filter operators. They often mean we’ve some expression or complication in our logic that prevents the optimizer from eliminating rows earlier. This is to be expected when we do something like generate and filter on a row number — the row number doesn’t exist until the query runs, and has to be filtered later than existing data.
Thanks for reading!
Going Further
If this is the kind of SQL Server stuff you love learning about, you’ll love my training. Blog readers get 25% off the Everything Bundle — over 100 hours of performance tuning content. Need hands-on help? I offer consulting engagements from targeted investigations to ongoing retainers. Want a quick sanity check before committing to a full engagement? Schedule a call — no commitment required.
I’m not writing about how if you use NOT IN, and suffer from NULL values in a column you’re comparing, you’ll get an empty result.
That’s easy enough to show:
DECLARE @not_null TABLE ( id INT NOT NULL );
INSERT @not_null ( id )
VALUES ( 1 );

DECLARE @null TABLE ( id INT NULL );
INSERT @null ( id )
VALUES ( 1 );
INSERT @null ( id )
VALUES ( NULL );

SELECT *
FROM   @not_null AS nn
WHERE  nn.id NOT IN ( SELECT n.id FROM @null AS n );
What’s sort of more interesting to me is what happens in execution plans when you’re comparing NULL-able columns that don’t contain any NULLs.
Exampled!
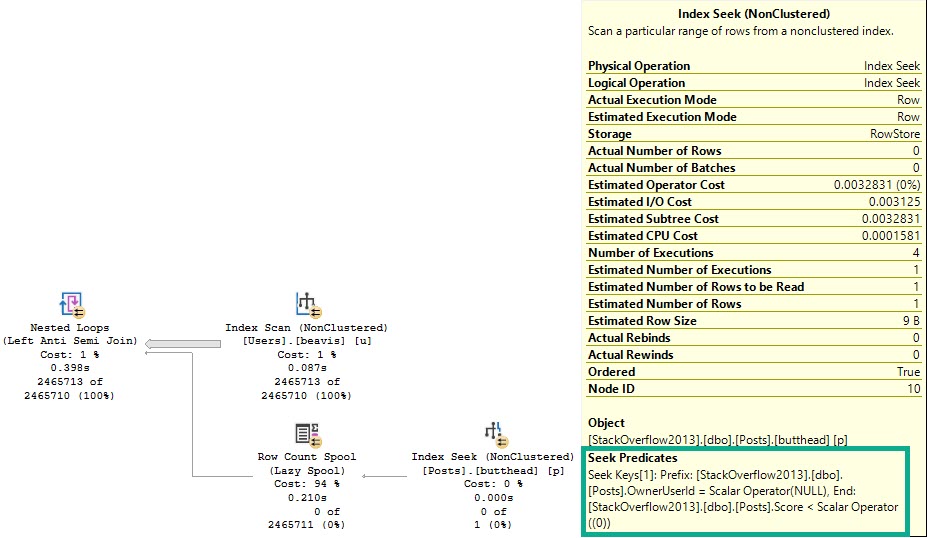
Here’s the first query I want to show you. In the Posts table, the OwnerUserId column is NULLable, but doesn’t have any NULLs in it. The Id column in the Users table is not NULLable — it’s the PK/CX on the table.
SELECT COUNT_BIG(*) AS records
FROM   dbo.Users AS u
WHERE  u.Id NOT IN ( SELECT p.OwnerUserId
                     FROM dbo.Posts AS p
					 WHERE p.Score < 0 );
Note that for all these queries, I’ve created these indexes:
CREATE INDEX beavis ON dbo.Users(AccountId);
CREATE INDEX butthead ON dbo.Posts(OwnerUserId, Score);
CREATE INDEX stewart ON dbo.Posts(Score, OwnerUserId);
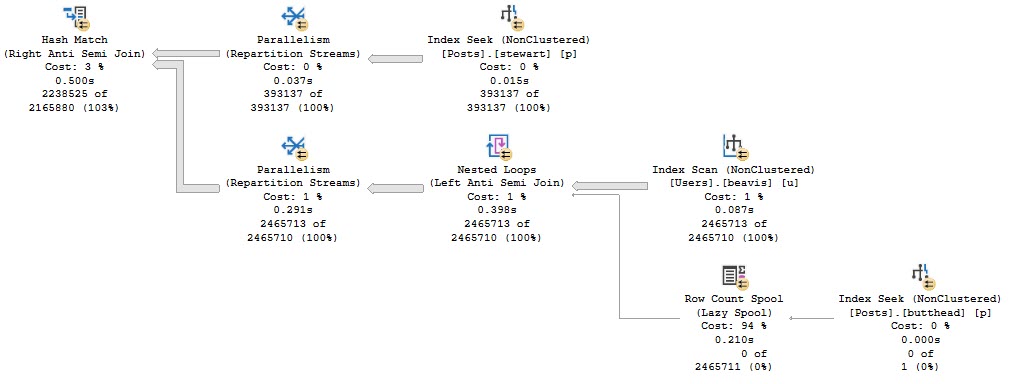
The important part of the query looks like this:
Good thing I have great indexes.
Zooming in to a sorta weird part of the query:
I’m in it
The optimizer spins up a Row Count Spool to make sure it’s right about the lack of NULLs. You can see the seek predicate doing so, and finding 0 rows, but taking ~200ms to do it. This time was much worse without those great indexes.
Explicitly Not NULL
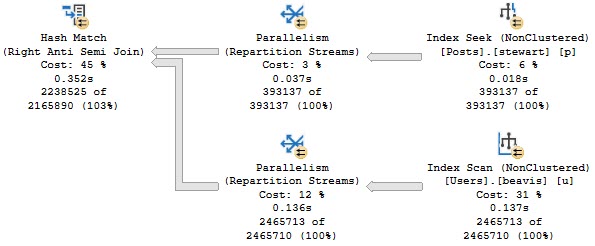
If we change our query slightly, we can get a less exotic query plan:
SELECT COUNT_BIG(*) AS records
FROM   dbo.Users AS u
WHERE  u.Id NOT IN (   SELECT p.OwnerUserId
                       FROM   dbo.Posts AS p
                       WHERE  p.Score < 0
                       AND    p.OwnerUserId IS NOT NULL );
Not Null’em
Which is a little bit faster overall, at ~350ms vs 550ms.
This is the equivalent of writing your query the way you should have written it in the first place, using NOT EXISTS.
SELECT COUNT_BIG(*) AS records
FROM   dbo.Users AS u
WHERE  NOT EXISTS (   SELECT 1 / 0
                      FROM   dbo.Posts AS p
                      WHERE  p.OwnerUserId = u.Id
                      AND    p.Score < 0 )
Recap
The optimizer is a weird place. It’s the ultimate defensive driver. Dealing with NULLs can be quite odd and difficult.
I generally save IN and NOT IN for when I have short lists of literal values. Likely, EXISTS/NOT EXISTS when values are contained in other tables, or dumping values into a #temp table when there’s a lot of values can be more efficient, if only to make better indexing available.
While IN doesn’t have the same side effects as NOT IN with NULLs, I think using EXISTS instead is just a good habit.
Thanks for reading!
Going Further
If this is the kind of SQL Server stuff you love learning about, you’ll love my training. Blog readers get 25% off the Everything Bundle — over 100 hours of performance tuning content. Need hands-on help? I offer consulting engagements from targeted investigations to ongoing retainers. Want a quick sanity check before committing to a full engagement? Schedule a call — no commitment required.
This is a somewhat complicated topic. There’s not a great TL;DR here, but I don’t want anyone to walk away from this post thinking that parallelism or indexes are “bad”.
What I do want to show is how uneven parallelism can exacerbate existing plan quality issues, and how some indexing can be unhelpful.
Query The First
This is the query we’ll be working with.
SELECT      u.Id, u.DisplayName, u.Reputation, ca.*
FROM        dbo.Users AS u WITH
CROSS APPLY (   SELECT c.*,
                       ROW_NUMBER()
					       OVER ( PARTITION BY c.PostId
						          ORDER BY c.Score DESC ) AS PostScoreRank
                FROM   dbo.Comments AS c
                WHERE  u.Id = c.UserId
                AND    c.Score > 0 ) AS ca
WHERE       u.Reputation >= 100000
AND         ca.PostScoreRank < 1
ORDER BY    u.Reputation DESC
OPTION(RECOMPILE);
I’m using cross apply because the optimizer is likely to pick a Nested Loops join plan. These plans are unlikely to see a Redistribute Streams on the inner side of the join.
Within the apply, I’m making SQL Server do a more significant amount of work than outside of it. This will make more sense later on.
Outside of the apply, I’m doing a little bit of work against a few columns in the Users table, columns that would probably make good candidates for indexing.
The index that I currently have on the Comments table looks like this:
    CREATE INDEX kerplop
    ON dbo.Comments(UserId, PostId, Score DESC)
    WHERE Score > 0
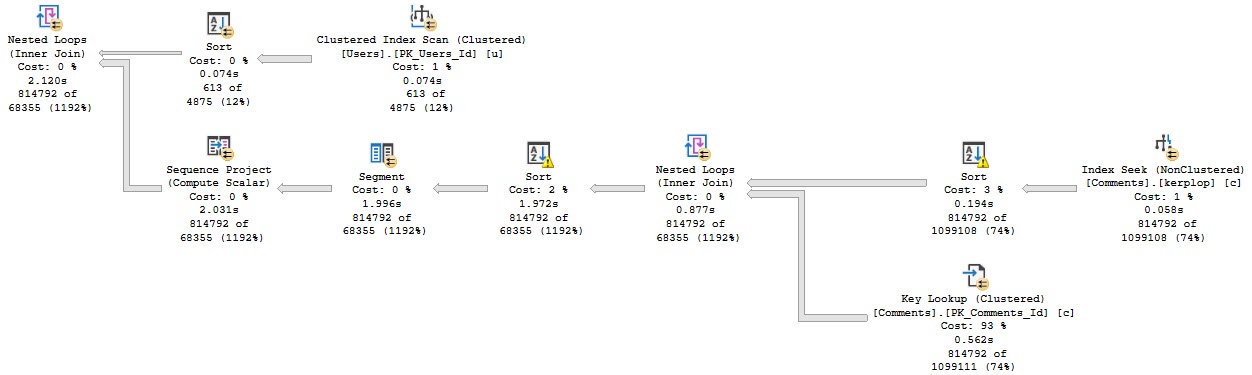
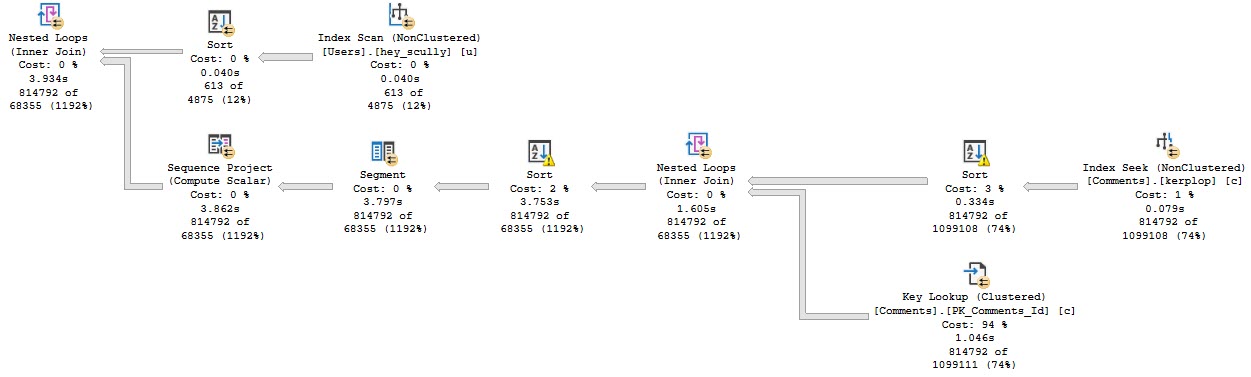
Anyway, the query plan for this run looks like this:
Stevenage overspill
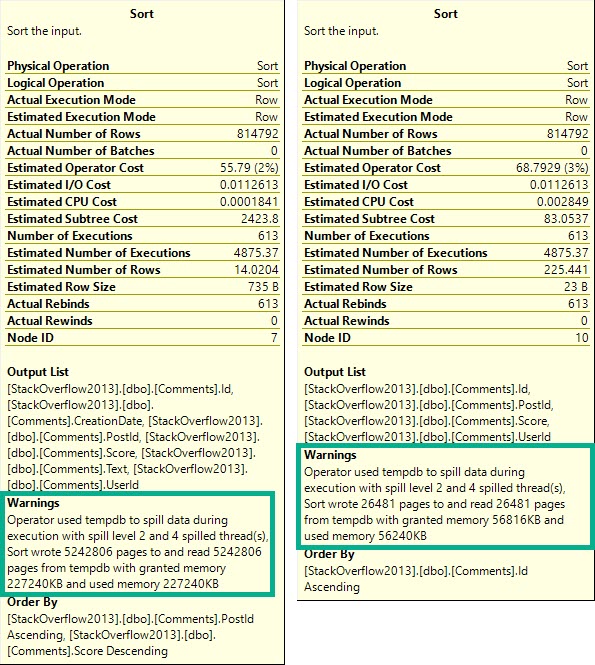
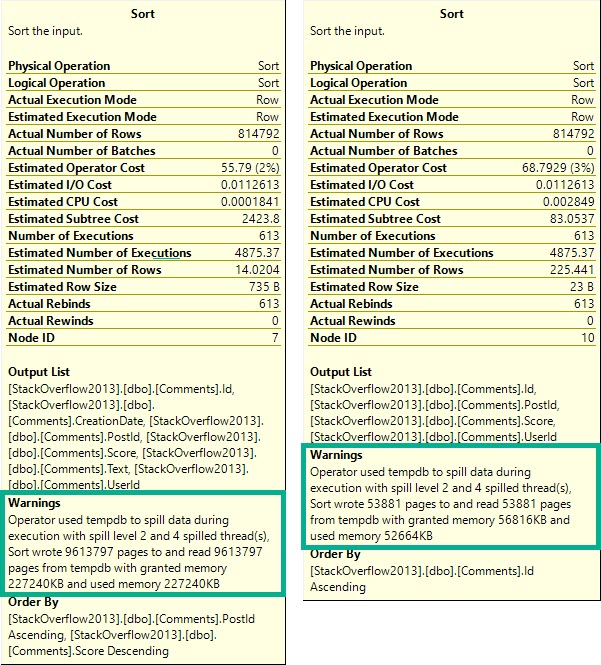
The part I want to focus on are the spills.
Goes on…
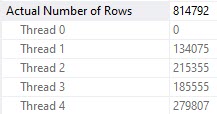
What you should keep in mind is that while all 4 threads spill, they all spill pretty evenly.
Thread distribution is pretty good across parallel workers. Not perfect, but hey.
All together now
If you want perfect, go be disappointed in what you get for $47k per .75 cores of Oracle Enterprise Edition.
Query The Second
Knowing what we know about stuff, we may wanna add this index:
    CREATE UNIQUE INDEX hey_scully
    ON dbo.Users (Id, Reputation DESC)
    INCLUDE(DisplayName);
But when we do, performance gets much worse.
If only.
Zooming back in on the Sorts…
Happening in mine.
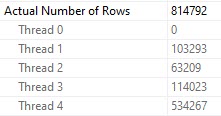
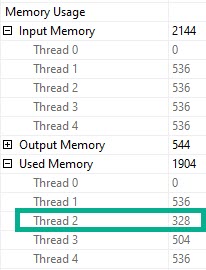
Each spill was about ~2x as bad, because thread distribution got much worse.
Fall down
Poor thread 4 got stuck with ~534k rows. The problem here is that each thread in a parallel plan gets an even cut of the memory grant. That doesn’t rebalance if parallelism is skewed. Threads may rebalance if a Redistribute Streams operator appears, but we don’t have one of those here. We will sometimes get one on the outer side of nested loops joins, if the optimizer decides it’s needed.
But since we don’t, things get all screwy.
Underage
Thread 2, which had only 63k rows assigned to it didn’t use the full amount of memory it got, though it still apparently spilled. Same with thread 3, but to a lesser extent (get it?).
But why did this happen when we added an index?
Paper Boy
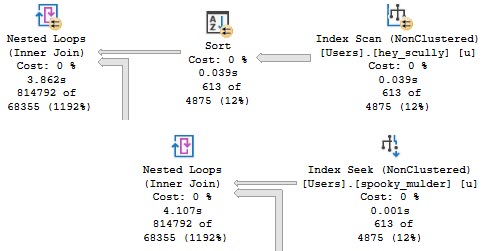
Reading the plan from right to left, top to bottom, we start with a scan of the Users table. This is when something called the parallel page supplier kicks in and starts handing out rows as threads ask for them. Its job is to make sure that parallel workers get rows when they ask for them, and that different threads don’t get the same rows. To do that, it uses key ranges from the statistics histogram.
It makes for a rather dull screenshot, but both histograms are identical for the clustered and nonclustered indexes in this demo. It’s not a statistical issue.
Nor are indexes fragmented, so, like, don’t get me started.
According to my Dear Friend, the parallel page supplier aims for 64k chunks. The smaller index just happens to end up with a more unfortunate key range distribution across its fewer pages.
Feuer
What About A Different Index?
Let’s switch our indexes up and add this one:
    CREATE UNIQUE INDEX spooky_mulder
    ON dbo.Users (Reputation DESC, Id)
    INCLUDE(DisplayName);
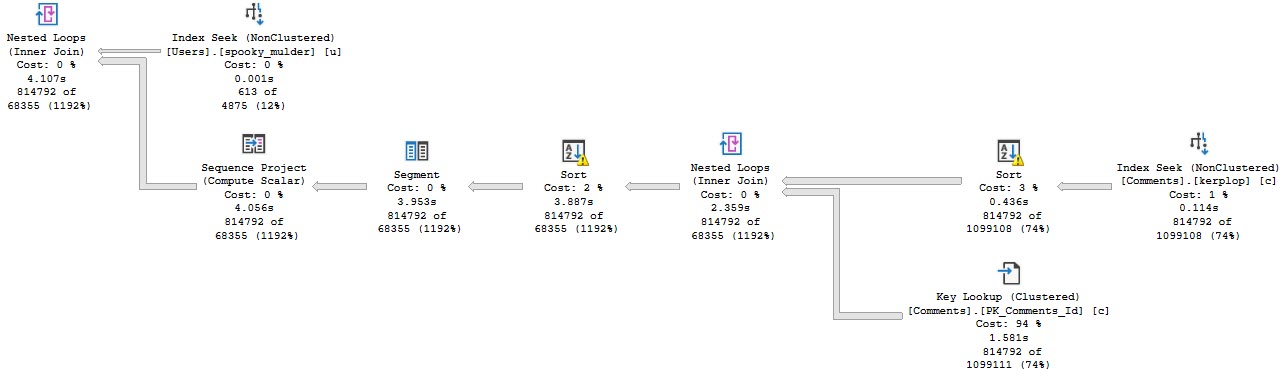
The plan no longer goes parallel, and it runs for about 4 seconds.
First Resort, Last Resort
We’re doing the same amount of work on the inner side of the nested loops join. The only part of the plan that changed is on the outer side.
Monkey Bread
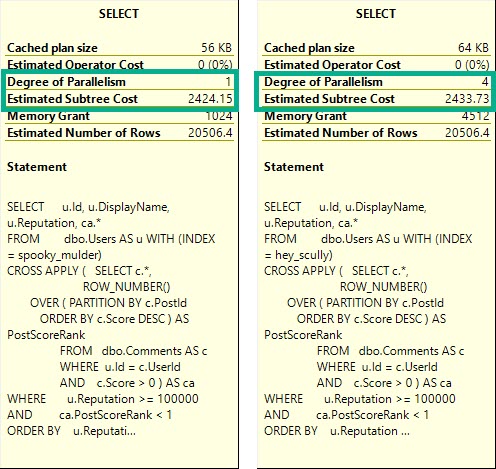
This is more of an aside than anything, but in parallel nested loops plans, the optimizer only considers if parallelism will reduce the cost of the outer side of the join.
The plan changing to use a cheaper seek with no need to sort data means the outer side is rather cheap to execute, but the inner side is just as expensive.
Not to brag but
The DOP 1 plan is only slightly cheaper, here. You may expect a plan that “costs” this much to go parallel, but alas, it was not meant to be.
Thanks for reading!
Going Further
If this is the kind of SQL Server stuff you love learning about, you’ll love my training. Blog readers get 25% off the Everything Bundle — over 100 hours of performance tuning content. Need hands-on help? I offer consulting engagements from targeted investigations to ongoing retainers. Want a quick sanity check before committing to a full engagement? Schedule a call — no commitment required.
There are many good reasons to parameterize queries.
There are, of course, downsides, too. Parameter sensitivity, AKA parameter sniffing, being the prime one.
But let’s say you consult the internet, or find a consultant on the internet, and they tell you that you ought to parameterize your queries.
It all sounds like a grand idea — you’ll get better plan reuse, and hopefully the plan cache will stop clearing itself out like a drunken ourobouros.
You could even use a setting called forced parameterization, which doesn’t always work.
Apart from the normal rules about when parameteriztion, forced or not, may not work, there’s another situation that can make things difficult.
Client Per Thing
Let’s assume for a second that you have a client-per-database, or client-per-schema model.
If I execute parameterized code like this:
DECLARE @i INT = 2
DECLARE @sql NVARCHAR(MAX) = N'
SELECT COUNT(*) AS records
FROM dbo.Users AS u
WHERE u.Reputation = @ii
'

EXEC sys.sp_executesql @sql, N'@ii INT', @ii = @i;
But from different database contexts (I have a few different versions of StackOverflow on my server, but I’m going to show results from 2013 and 2010), we’ll get separate cached plans, despite them having identical:
Costs
Query Plans
SQL Handles
Query Hashes
Frida Fredo
The same thing would happen with any parameterized code executed in a different context — stored procedures, functions… well. You get the idea.
Forced parameterization may help queries within the same context with plan reuse, but there are certain boundaries they won’t cross.
Don’t get me wrong, here. I’m not complaining. There’s so much that could be different, I wouldn’t want plan reuse across these boundaries. Heck, I may even separate stuff specifically to get different plans. As usual, I don’t want you, dear reader, to be surprised by this behavior.
Thanks for reading!
Going Further
If this is the kind of SQL Server stuff you love learning about, you’ll love my training. Blog readers get 25% off the Everything Bundle — over 100 hours of performance tuning content. Need hands-on help? I offer consulting engagements from targeted investigations to ongoing retainers. Want a quick sanity check before committing to a full engagement? Schedule a call — no commitment required.
In this video, I delve into an interesting quirk of SQL Server execution plans when using bad dynamic SQL—specifically, when concatenating values directly into the `EXEC` statement. I demonstrate how, despite the common belief that such practices don’t lead to plan reuse, certain conditions can result in unexpected parameterization behavior. By running a series of queries with varying numeric values, I show how SQL Server’s simple or auto-parameterization can cause execution plans to be reused in ways that might not be immediately obvious. This video aims to highlight the nuances of dynamic SQL and execution plans, providing insights into why and when plan reuse occurs, even in seemingly straightforward scenarios.
Full Transcript
Ehh, it’s you again. Uh, Erik Darling, doing Erik Darling data stuff, and loving every, every other minute of it. Maybe, maybe every other hour. I don’t know. Everything’s, everything’s fun though. Everything’s great. Uh, I wanted to talk about a funny little quirk with, uh, how execution plans sometimes get cached when you use the bad dynamic SQL. And by bad dynamic SQL, I mean when you just use exec and when you concatenate things right into the string like this. I don’t mean like the good kind of dynamic SQL where you use SP execute SQL and you don’t leave yourself at least somewhat prone to SQL injection problems. So, what’s gonna happen here? is really best described by a demo. So, I’m not gonna talk too much. I’m not gonna preamble too much about it. I just want to point out that I’m, I’m using nvarkar 10 here because nvarkar 10 is the length of the longest possible integer after, after, after, well, no, it’s not like after this thing goes up a digit, but after this thing goes up like a number, this thing is no longer a regular integer. It is then a big int. And big ints can get very long. So I left, I left nvarkar 10 is, you know, the, the, the cap for how long that number is.
that number will ever be. Now, when I run the, when I run these queries, something kind of cute and funny is going to happen. And we’ll look here and we get some results back and we’ll look and we’ll see. We wouldn’t expect that using exec would result in plan reuse, but in this case it does for a very specific reason. We see that we have one instance of this query and our, uh, our literal value, our, the value that we tacked on there has been replaced with a part of this query.
parameter. So SQL Server has done something a little bit tricky. If we scroll over here a little bit, we’ll see that that query actually got executed twice. Now what happened is the reason why we got this thing over here, we got this, uh, this parameter replaced our literal value. That’s a side effect of something called, uh, simple parameterization or auto parameterization.
Uh, it’s, it’s referred to, it’s been referred to as both over the years, but that happens when you get a trivial plan. If I go over here and I hit a four and I hopefully zoom in, Oh, that didn’t do it for some reason. Uh, that, all right, let’s try controlling one. There we go.
When we run in and do that and we look, that’s a trivial plan is, and that’s the thing that makes, uh, simple parameterization or auto automatic parameterization possible. You can see that our value got replaced by a one there. Now that’s all well and good, but where this starts to, to go astray a little bit is, uh, if this number changes. Now it’s not like if I change this to 25, it’s going to make a difference. We’ll still get plan reuse there.
And we still get that one line with, uh, the select count query. It is still parameterized. And if we can slide over here a little bit, that still has two executions that’ll remain true. Even if I go up to two 55 and I look at this and we see that this is still that same select count.
It’s still parameterized and we still have two executions right there where this will get where this will get changed, where this will be different is if I change that to two 56 and I run this and now we’ll have two instances of that count query. They’ll both be parameterized. There’s an at one there and an at one there, but the difference now is what that at one got parameterized to. If you were paying really close attention in the first plan, you may have noticed under the parameter list that one here was a tiny int.
Now, if I go look at the other query plan, it’ll still be simply or automatically parameterized, but the parameter type will be different. If we go look at the parameter list now, it’s not, not a tiny int. It’s a small int. So a SQL Server for values between one and 255, which is a tiny int, it will create a plan where the parameter has a type of tiny int.
As soon as we get above that, it’ll move up to a small int. And if we say two five six zero zero zero, I believe that should, that should get us into the regular integer range. If we run that, we’ll still have that second plan, right? If we go and look at that only that second plan this time, we can see that the parameter list now shows us that the data type is an integer. So it moved beyond a tiny int or a small int, which caps off at like 65,000 or something, if I’m remembering correctly.
I hardly ever remember things correctly, which is why I have to think about things so hard. So you can, with simple enough queries, get some plan reuse from Dynamic SQL. Granted, this all goes out the window as soon as you do something more complicated where you can no longer get a trivial plan or a simple slash automatic parameterization.
There’s all sorts of kind of weird and funny rules around parameter, around the simple automatic parameterization stuff and around the trivial plan stuff. I’m not going to get into those here because I just wanted, I wanted to keep this as a short video. So in some cases you can, in some quirky cases, you can get plan reuse when you use exec, even when you concatenate variables, variables, variables, variables directly into the string.
But under most circumstances, your queries are just going to be big, bad, gnarly, complicated enough that you won’t get a trivial plan, nor will you get simple slash automatic parameterization. All right, cool. Anyway, that’s all I had.
Thank you for watching. I hope you learned something. I hope you enjoyed yourselves. And I will see you in another video, another time, another place. I don’t know. Maybe I’ll even be sober for that one. We’ll see. We’ll see how it goes. It’s a weird thing. Thank you.
Going Further
If this is the kind of SQL Server stuff you love learning about, you’ll love my training. Blog readers get 25% off the Everything Bundle — over 100 hours of performance tuning content. Need hands-on help? I offer consulting engagements from targeted investigations to ongoing retainers. Want a quick sanity check before committing to a full engagement? Schedule a call — no commitment required.
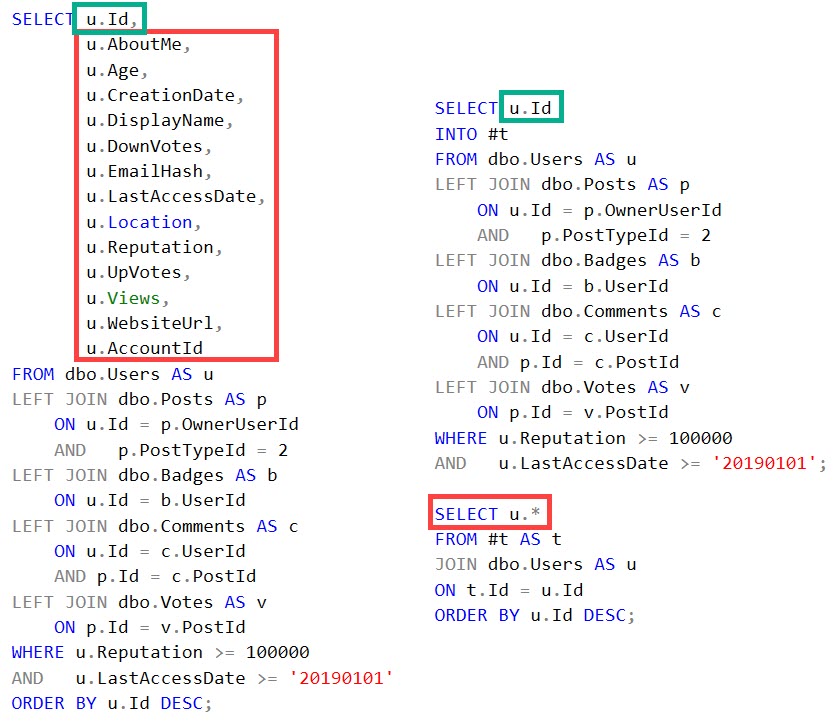
The next time you’re writing a query, I want you to try something in your head: Break the columns down into two groups.
Informational: Columns you’re only selecting
Relational: Columns that show up below the “from” clause
There may be some crossover, and that’s okay. If you’re selecting a short enough list of columns, and doing a group by, there might be total crossover.
But I’m willing to bet most of your queries don’t look that neat and tidy.
Silk Stalkings
Your queries probably have a distinctly more robust list of columns, probably with a DISTINCT to fend off the dozen or so left joins for just in case columns.
And that’s… Okay, let’s reserve judgement. Instead, let’s figure out a better way to get them all.
Narrowin’
That long list of columns in your query has weight to it. Not physical weight, exactly. But to the optimizer, it represents a bunch of weight in CPU and I/O.
The more columns you want to drag around, the harder you make your queries work. Especially because the architect who migrated your app from Access to SQL Server 2000 made every column as wide as possible.
That weight changes a lot of things:
How much memory your query asks for
Which indexes your query uses
The kind of operators the optimizer chooses
And I know, you need to show people that data. I’m not opposed to that.
I’m only opposed to when you’re doing it.
Filterin’
The reason why I want you to separate these concepts mentally is so that when you’re writing a query and you know you have to show people a lot of columns, to not try to show them all immediately. Instead, just take the columns you need to relate tables and put them in a temp table. It’s fine if you have your joins and where clause stuff here.
The idea is to get a narrow list of columns for a filtered set of rows. We’ll worry about the informational stuff after we get the relational stuff.
Something like this:
Pleasant things
Splainin’
If you avoid getting long lists of columns up front, you can:
Avoid overly wide indexes, and just index for the important stuff in the join/where clause
Be less sensitive to parameter sniffing, because there will be less variability in plan choices
Need fewer resources to push queries with, because less data is moving about
Thanks for reading!
Going Further
If this is the kind of SQL Server stuff you love learning about, you’ll love my training. Blog readers get 25% off the Everything Bundle — over 100 hours of performance tuning content. Need hands-on help? I offer consulting engagements from targeted investigations to ongoing retainers. Want a quick sanity check before committing to a full engagement? Schedule a call — no commitment required.
My Dear Friend™ Sean recently wrote a post talking about how people are doing index maintenance wrong. I’m going to go a step further and talk about how the method your index maintenance scripts use to evaluate fragmentation is wrong.
If you look at how the script you use to decide whether or not you’re going to rebuild indexes works, and this goes for maintenance plans, too (I ran PROFILER LONG LIVE PROFILER GO TEAM PROFILER to confirm the query), you’ll see they run a query against dm_db_index_physical_stats.
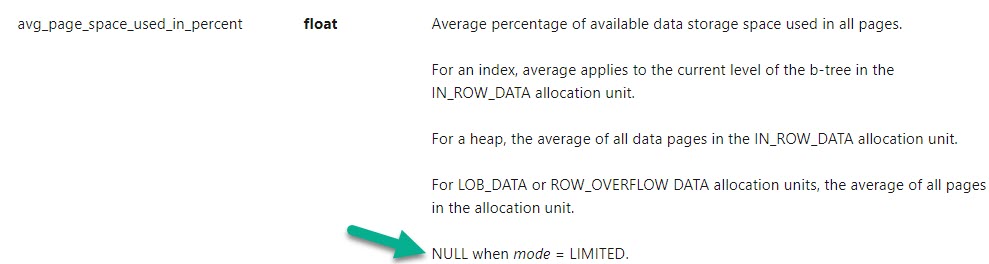
All of the queries use the column avg_fragmentation_in_percent to measure if your index needs to be rebuilt. The docs (linked above) for that column have this to say:
He cried
It’s measuring logical fragmentation. Logical fragmentation is when pages are out of order.
If you’re the kind of person who cares about various caches on your server, like the buffer pool or the plan cache, then you’d wanna measure something totally different. You’d wanna measure how much free space you have on each page, because having a bunch of empty space on each page means your data will take up more space in memory when you read it in there from disk.
You could do that with the column avg_page_space_used_in_percent.
BUT…
Oops
Your favorite index maintenance solution will do you a favor and only run dm_db_index_physical_stats in LIMITED mode by default. That’s because taking deeper measurements can be rough on a server with a lot of data on it, and heck, even limited can run for a long time.
But if I were going to make the decision to rebuild an index, this is the measurement I’d want to use. Because all that unused space can be wasteful.
The thing is, there’s not a great correlation between avg_fragmentation_in_percent being high, and avg_page_space_used_in_percent.
Local Database
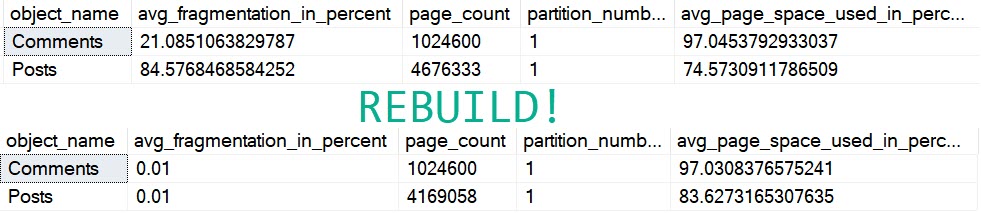
When looking at fragmentation in my copy of the Stack Overflow 2013 database:
Scum
Both of those tables are fragmented enough to get attention from a maintenance solution, but rebuilding only really helps the Posts table, even though we rebuilt both.
On the comments table, avg_page_space_used_in_percent goes down a tiny bit, and Posts gets better by about 10%.
The page count for Comments stays the same, but it goes down by about 500k for Posts.
This part I’m cool with. I’d love to read 500k less pages, if I were scanning the entire table.
But I also really don’t wanna be scanning the entire table outside of reporting or data warehouse-ish queries.
If we’re talking OLTP, avoiding scanning large tables is usually worthwhile, and to do that we create nonclustered indexes that help our queries find data effectively, and write queries with clear predicates that promote the efficient use of indexes.
Right?
Right.
Think About Your Maintenance Settings
They’re probably at the default of 5% and 30% for reorg and rebuild thresholds. Not only are those absurdly low, but they’re not even measuring the right kind of fragmentation. Even at 84% “fragmentation”, we had 75% full pages.
That’s not perfect, but it’s hardly a disaster.
Heck, you’ve probably been memed into setting fill factor lower than that to avoid fragmentation.
Worse, you’re probably looking at every table >1000 pages, which is about 8 MB.
If you have trouble reading and keeping 8 MB tables in memory, maybe it’s time to go shopping.
Thanks for reading!
Going Further
If this is the kind of SQL Server stuff you love learning about, you’ll love my training. Blog readers get 25% off the Everything Bundle — over 100 hours of performance tuning content. Need hands-on help? I offer consulting engagements from targeted investigations to ongoing retainers. Want a quick sanity check before committing to a full engagement? Schedule a call — no commitment required.
I’ll be delivering my Total Server Tuning session, where you’ll learn all sorts of horrible things about SQL Server.
To get ready for the session, you’ll need a local version of SQL Server Developer Edition, 2017 + whatever the latest CU is.
I’m writing this a few weeks out, and who knows what kind of antics Microsoft will get up to.
Will they release, un-release, re-release, re-un-release, and then delete all internet history of another CU?
STAY TUNED!
For Sure
One thing you’ll definitely need is a copy of the StackOverflow2013 database.
Seats are limited, so hurry on up and get yourself one before you get FOMO in your MOJO.
Thanks for reading!
Going Further
If this is the kind of SQL Server stuff you love learning about, you’ll love my training. Blog readers get 25% off the Everything Bundle — over 100 hours of performance tuning content. Need hands-on help? I offer consulting engagements from targeted investigations to ongoing retainers. Want a quick sanity check before committing to a full engagement? Schedule a call — no commitment required.
But the bottom line is this: If the automatic and intelligent query tuning features are that powerful, then giving Standard Edition either a 256GB buffer pool cap, or a buffer pool cap that scales with CPU licensing spend still won’t make it competitive, because hardware isn’t solving the kind of problems that those features do.
If they’re not, they shouldn’t be Enterprise only. Clearly hardware is the differentiator.
Increasing the buffer pool limit is a free choice
Microsoft gave away most of the important programmability features with 2016 SP1 to Standard Edition, and they’re giving up TDE in 2019.
Those are features that cost real human time to develop, support, and maintain. A larger buffer pool costs nothing.
Thanks for reading!
Going Further
If this is the kind of SQL Server stuff you love learning about, you’ll love my training. Blog readers get 25% off the Everything Bundle — over 100 hours of performance tuning content. Need hands-on help? I offer consulting engagements from targeted investigations to ongoing retainers. Want a quick sanity check before committing to a full engagement? Schedule a call — no commitment required.
Speaking daily with Joe is one of the best choices I’ve ever made. Not only do I regularly learn things about SQL Server that I would probably not run into, but he’s quite a character. That’s why when I started to help organize SQL Saturday NYC, I was more than happy to offer him a precon.
While it may be impractical to have more Joes in the world, it’s very practical to have people learn from him.
So what did I learn from his precon?
Column store is Different
How you load data into tables matters a lot. Not only is the number of rows you insert at a time crucial, but all sorts of things from the column data types to the inserted values can work for or against you. This can affect compression, query performance, and how well data loading scales.
The other place where column store differs from row store indexes is that maintenance is important. Yes, the very maintenance that’s an absurd crutch to row store indexes can be make or break to column store performance. Right now, the only two solutions that have special rules for column store indexes are Niko Neugebauer’s CISL scripts, and the Tiger Team’s Adaptive Defrag. Other maintenance solutions aren’t taking the right things into account.
Modifications Are Harsh! Deleting and Updating rows in column store indexes can have some nasty side effects — the kind that make maintenance necessary.
Performance Tuning Is Wild
If you’re dealing with column store indexes, chances are you’re dealing with some really big tables. While that by itself doesn’t change how you tune queries, you do have to remind yourself that “missing indexes” aren’t going to be the answer. You also need to keep in mind that some operators and query constructs don’t allow for good segment/row group elimination. You can think of those like partition elimination in a partitioned table. You can skip large amounts of data irrelevant to your query.
Strings Are The Devil
That’s all. Avoid them.
Details Are In The Devil
I’m not giving away too much here, because I hope Joe will deliver this again. If you see it pop up in your area, buy tickets ASAP.
Thanks for reading!
Going Further
If this is the kind of SQL Server stuff you love learning about, you’ll love my training. Blog readers get 25% off the Everything Bundle — over 100 hours of performance tuning content. Need hands-on help? I offer consulting engagements from targeted investigations to ongoing retainers. Want a quick sanity check before committing to a full engagement? Schedule a call — no commitment required.