But I did write a silly helper procedure for myself, that I figured I’d share here. I’m not putting it on GitHub right now (unless you all find it incredibly useful).
I often have multiple copies of StackOverflow for demos. Smaller databases, ones in different compat levels, and other weird tweaks to test things (this is easier and less confusing than remembering to reset everything, and freaking out when old demos stop working because I forgot).
What I always got annoyed with was going to try something in a different database, and remembering that a procedure, function, or view I created wasn’t there, or had changed.
With that, I give you sp_MoveGuts.
A simple call looks like this:
EXEC dbo.sp_MoveGuts @SourceDatabase = N'StackOverflow2013', --where to take stuff
                     @TargetDatabase = N'StackOverflow', --where to make stuff
                     @CreateOnly = 0, --Will alter objects if they already exist
                     @Debug = 1 --optional;
You need to give it a source database, a target database, and tell it whether you want to only create new objects, or also alter any existing objects.
There are certain things I’m not going to spend time trying to fix, like dependencies. If you have code that references tables that don’t exist in other databases, errors will be logged and you’ll be notified. But I’m not going to move physical data in this thing. No way, no how. That part is up to you.
Anyway, here it is.
Going Further
If this is the kind of SQL Server stuff you love learning about, you’ll love my training. Blog readers get 25% off the Everything Bundle — over 100 hours of performance tuning content. I’m also available for consulting if you just don’t have time for that and need to solve performance problems quickly.
The Code
CREATE OR ALTER PROCEDURE dbo.sp_MoveGuts
  @SourceDatabase sysname = N'',
  @TargetDatabase sysname = N'',
  @CreateOnly BIT = 0,
  @Debug BIT = 0
  AS
BEGIN
SET NOCOUNT, XACT_ABORT ON;

DECLARE @get_sql NVARCHAR(MAX) = N'';

CREATE TABLE #mover
(
    id INT IDENTITY PRIMARY KEY CLUSTERED,
    object_id BIGINT,
    target_database sysname,
    object_name sysname,
    definition NVARCHAR(MAX),
    alter_definition
           AS STUFF(definition, CHARINDEX(N'CREATE', definition), 6, N'ALTER')
);

DECLARE @logger TABLE
(
    id INT IDENTITY PRIMARY KEY CLUSTERED,
    object_name sysname,
    error_number INT,
    error_message NVARCHAR(2048)
);


SET @get_sql += N'
SELECT asm.object_id,
       @iTargetDatabase,
       ISNULL(OBJECT_NAME(asm.object_id, DB_ID(@iSourceDatabase)), ''a_trigger'') AS object_name,
       LTRIM(RTRIM(asm.definition)) as definition
FROM ' + QUOTENAME(@SourceDatabase) + N'.sys.sql_modules AS asm;
' + CHAR(13);

IF @Debug = 1 BEGIN RAISERROR(@get_sql, 0, 1) WITH NOWAIT; END;

INSERT #mover ( object_id, target_database, object_name, definition )
EXEC sys.sp_executesql @get_sql, N'@iTargetDatabase sysname, @iSourceDatabase sysname', @TargetDatabase, @SourceDatabase;


IF @Debug = 1 BEGIN SELECT * FROM #mover AS m; END;

DECLARE @min_id INT;
DECLARE @max_id INT;
DECLARE @spe NVARCHAR(MAX) = QUOTENAME(@TargetDatabase) + N'.sys.sp_executesql ';
DECLARE @def_sql NVARCHAR(MAX) = N'';
DECLARE @def_sql_alt NVARCHAR(MAX) = N'';
DECLARE @object_name sysname = N''

SELECT @min_id = MIN(m.id),
       @max_id = MAX(m.id)
FROM #mover AS m
OPTION(RECOMPILE);

    WHILE @min_id <= @max_id
    BEGIN
    BEGIN TRY

        SELECT @object_name = m.object_name,
               @def_sql = m.definition,
               @def_sql_alt = m.alter_definition
        FROM #mover AS m
        WHERE m.id = @min_id
        OPTION (RECOMPILE);

        IF @Debug = 1 BEGIN RAISERROR(N'creating %s using %s', 0, 1, @object_name, @spe) WITH NOWAIT; END;
        EXEC @spe @def_sql;

        IF @Debug = 1 BEGIN RAISERROR(N'Setting next id after %i out of %i total', 0, 1, @min_id, @max_id) WITH NOWAIT; END;

        SET @min_id =
        (
            SELECT TOP (1) m.id
            FROM #mover AS m
            WHERE m.id > @min_id
            ORDER BY m.id
        );

        IF (@min_id IS NULL
              OR @min_id = @max_id)
        BREAK;

     END TRY

     BEGIN CATCH
     IF XACT_STATE() <> 0
         ROLLBACK TRANSACTION;

         IF (ERROR_NUMBER() = 2714
                AND @CreateOnly = 0 )
             BEGIN

                 IF @Debug = 1 BEGIN RAISERROR(N'Object exists, altering %s using %s instead', 0, 1, @object_name, @spe) WITH NOWAIT; END;
                 EXEC @spe @def_sql_alt;

                IF @Debug = 1 BEGIN RAISERROR(N'Setting next id after %i out of %i total', 0, 1, @min_id, @max_id) WITH NOWAIT; END;

                SET @min_id =
                (
                    SELECT TOP (1) m.id
                    FROM #mover AS m
                    WHERE m.id > @min_id
                    ORDER BY m.id
                );

                IF (@min_id IS NULL
                      OR @min_id = @max_id)
                BREAK;

             END
         ELSE
         BEGIN
             INSERT @logger
                  ( object_name, error_number, error_message )
             SELECT @object_name, ERROR_NUMBER(), ERROR_MESSAGE();

             SET @min_id =
             (
                 SELECT TOP (1) m.id
                 FROM #mover AS m
                 WHERE m.id > @min_id
                 ORDER BY m.id
             );

             IF (@min_id IS NULL
                   OR @min_id = @max_id)
             BREAK;
         END

     END CATCH
END;

    IF EXISTS (SELECT 1/0 FROM @logger AS l)
        BEGIN
            SELECT N'errors' AS errors, * FROM @logger AS l ORDER BY l.id;
        END

END;
GO
Let me ask you a question: If I told you that all the numbers in an integer column were either:
> 0
>= 1
You’d probably agree that the lower number you could possible see is 1.
And that’s exactly the case with the Reputation column in Stack Overflow.
Non-Alignment Pact
Assume that I am being truthful about creating this index:
CREATE INDEX constraints_are_silly
ON dbo.Users
(
Reputation,
UpVotes
) INCLUDE (DisplayName);
Also assume that this is the most important query ever written by human hands for the benefit of humanity:
SELECT TOP (1000)
u.Reputation,
u.UpVotes,
u.DisplayName
FROM dbo.Users AS u
WHERE u.Reputation <= 1
ORDER BY u.UpVotes;
However, I’m dissatisfied with the query plan. This requires no assumption. It’s a bit much for what I’m asking, I think.
Overkill
Since a current implementation rule for the database is that no one can have a Reputation of 0 or less, I add this constraint hoping that SQL Server will see this and stop sorting data, because it knows that 1 is the lowest integer it will find, and the order of UpVotes won’t reset for Reputation = 0.
ALTER TABLE dbo.Users ADD CONSTRAINT checko CHECK (Reputation > 0);
But I still end up with the same execution plan. In neither case is the plan a) trivial, or b) simple parameterized. We can’t blame the optimizer trying to be helpful.
Now assume that I get really mad and change my constraint. This requires minimal assumption.
ALTER TABLE dbo.Users ADD CONSTRAINT checko CHECK (Reputation >= 1);
And now I get a query plan that does not have a sort in it. My approval does not require assumption.
Hi I’m over here
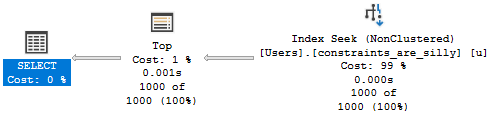
Why does one constraint remove the need to sort, and one not?
Over My Head
The answer is in the query plan. Sometimes I have to be reminded to look at these.
Life Stinks
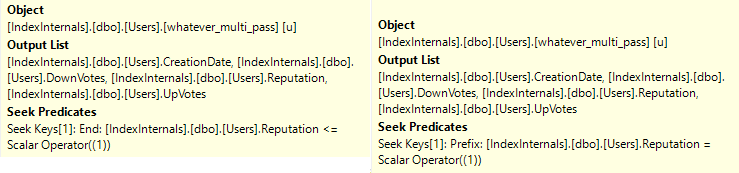
The Seek Predicate on the left is from when we defined the constraint as > 0. It has a <= 1 predicate.
The Seek Predicate on the right is an equality on = 1
For a little more detail, I asked a question. Apparently the optimizer… doesn’t consider data types here.
Thanks for reading!
Going Further
If this is the kind of SQL Server stuff you love learning about, you’ll love my training. Blog readers get 25% off the Everything Bundle — over 100 hours of performance tuning content. Need hands-on help? I offer consulting engagements from targeted investigations to ongoing retainers. Want a quick sanity check before committing to a full engagement? Schedule a call — no commitment required.
Recently I blogged about last page contention solutions, and one thing I mentioned is that turning on OPTIMIZE_FOR_SEQUENTIAL_KEY doesn’t require you to rebuild an index. That’s awesome, because a whole lot of changes to indexes require you to rebuild them.
So how exactly do you do that?
Either when you create the table:
CREATE TABLE dbo.Votes_Insert
(
    Id INT IDENTITY(1, 1) NOT NULL,
    PostId INT NOT NULL,
    UserId INT NULL,
    BountyAmount INT NULL,
    VoteTypeId INT NOT NULL,
    CreationDate DATETIME NOT NULL,
    CONSTRAINT PK_Votes_Insert_Id
        PRIMARY KEY CLUSTERED (Id ASC)
    WITH (OPTIMIZE_FOR_SEQUENTIAL_KEY  = ON)
);
When you create the index:
CREATE INDEX so_optimized
    ON dbo.Votes_Insert (Id) WITH (OPTIMIZE_FOR_SEQUENTIAL_KEY = ON);
Or if you need to alter an existing index:
ALTER INDEX so_optimized
    ON dbo.Votes_Insert SET(OPTIMIZE_FOR_SEQUENTIAL_KEY  = ON);
Get Back To Work
You’ll find this post again in a few years when you finally migrate to SQL Server 2019.
Thanks for reading!
Going Further
If this is the kind of SQL Server stuff you love learning about, you’ll love my training. Blog readers get 25% off the Everything Bundle — over 100 hours of performance tuning content. Need hands-on help? I offer consulting engagements from targeted investigations to ongoing retainers. Want a quick sanity check before committing to a full engagement? Schedule a call — no commitment required.
If this is the kind of SQL Server stuff you love learning about, you’ll love my training. Blog readers get 25% off the Everything Bundle — over 100 hours of performance tuning content. Need hands-on help? I offer consulting engagements from targeted investigations to ongoing retainers. Want a quick sanity check before committing to a full engagement? Schedule a call — no commitment required.
There have been a ton of improvements and fixes here. I realize it’s bad form to generalize like this, but I went into overdrive making sure things were nice and tidy for GroupBy. There have been improvements to XML querying and processing, how data gets pulled in and correlated, and finally how it gets displayed.
If this is the kind of SQL Server stuff you love learning about, you’ll love my training. Blog readers get 25% off the Everything Bundle — over 100 hours of performance tuning content. Need hands-on help? I offer consulting engagements from targeted investigations to ongoing retainers. Want a quick sanity check before committing to a full engagement? Schedule a call — no commitment required.
In this video, I delve into the world of troubleshooting parameter sniffing using SPWhoisActive, a powerful yet often underutilized tool that has been around for years. I walk through practical scenarios where you might encounter performance issues and demonstrate how SPWhoisActive can be your ally in diagnosing these problems quickly. By leveraging features like `get average time`, `get outer command`, and `get plans`, I show how to identify parameter sniffing issues, understand the impact of different parameters on query execution, and explore various tuning options to mitigate performance bottlenecks. Whether you’re dealing with a server that’s suddenly under heavy load or simply want to enhance your troubleshooting toolkit, this video provides actionable insights and practical examples to help you navigate these challenges effectively.
Full Transcript
Erik Darling here with Erik Darling Data. And I wanted to record a video, which is why I’m recording a video. I’m having a lot of fun today. I wanted to record a video about troubleshooting parameter sniffing using SPWhoisActive. It’s such a wonderful free tool that’s, you know, been around for so long. But there’s a lot of overlooked stuff in there, and there’s a lot of things, there’s a lot of things that you can do with it that can help you troubleshoot tough issues like parameter sniffing. Now, yes, you can log it to a table, and yes, there are plenty of blog posts out there that teach you how to do that. But, you know, sometimes it’s the middle of the day. You’re sitting by your computer anyway. And we realize that not everyone is soul bound to the F5 key. But say that, you know, you’re sitting there, you’re monitoring tool, and, you know, starts throwing alerts about CPU being really high, or users start, you know, rushing into your, well, I mean, rushing into your Zoom meeting, saying things are slow, or, you know, slack alerts, whatever it is, you get, you, the server is on fire. And you want to figure out what’s wrong. Now, SPWhoisActive can show you all sorts of great stuff. There’s nothing running on my home server right now. So this is going to be blank. But, you know, if you were to run it, you can find all sorts of things, like you might see the blocking session ID column populated. So you might just be dealing with a blocking thing, not a parameter sniffing thing.
necessarily like a query performance thing. You know, blocking will make queries feel slow. It’s not actually queries running slow, it’s queries being blocked from running. So just turn on RCSI, you’ll save yourself a lot of trouble and heartache down the line. But, you know, what if it is parameter sniffing? What if what if we need to figure out if it’s parameter sniffing in pretty quickly? Well, let’s come over here and run our store procedure. And while this is running, you know, you run SPWhoisActive and you might see some stuff happening. You know, you might see that something’s been running for a few seconds, you might see reads creeping up, but you don’t necessarily know that it’s slow. One way to tell if it is slower than usual is to use the get average time parameter. If we run this, we’ll see the query current duration. We’ll also see that the average duration is 111 milliseconds. That’s pretty bad. You know, we’re up to 27 seconds now. And usually this thing runs really quickly. So what on earth is going on? Well, if we look at the query text, we’ll have parent ID in there. And we’ll see that I mean, this is parameterized, but we need to get thing we need to go a step further. We need to get we need to figure out what the parameter value is, right? So let’s run this with get at get I know, I’m not supposed to type in demos, but I’ve been practicing. I got my Mavis beacon CD. Everything is wonderful. So let’s run this with get outer command equals one with nothing executing on the server. Well, it’s what’s the point, right? But if we run that with this thing now? Well, let’s see. Now we have another line of text here. Now notice that the average time did bump up a little because you know, obviously, that thing ran for 40 something seconds. So this did skew up a little bit. But that’s not really the point of what I want to show you for this run. In real life, I would expect you I would expect you to read my mind and read my screen and then just run the command as it is. But we get some extra help here. We can see that using the SQL command, we’re using the get outer command parameter, we now get the SQL command line. So this showed us the query text from the store procedure that was currently in the SQL command.
What we’re currently executing. This will show us how the store procedure was currently executing. Like what the parameter value passed in was, which is really, really helpful when you’re troubleshooting a parameter sniffing scenario. Because now we can see, golly and gosh, this thing sure did get a parameter passed in. But now we know what it ran with and we know the parameter that it was slow running with. So the next step we have to take and this is a little bit redundant now because newer versions of SQL Server give you, you know, a little bit more information about the queries that are actively running. But if we run our store procedure, and we run this, now we’ll have additional information back. So like the average time creeped up a little bit again, because you know, we ran the long running store procedure again. We’ll get back the SQL text, we’ll get back the SQL text, we’ll get back the oops, didn’t mean to click on that, we’ll get back how the store procedure was executed. But now using the get plans parameter, we’ll also get execution plans. And if we look at the execution plan, we can see some stuff in here that that does sort of make our query more sensitive to parameter sniffing.
We’ve got some nested loops joins. And you know, when you’re troubleshooting a problem like this, you know, I don’t want you to walk away thinking that like, lookups are always bad, or that like nested loops joins are always bad. But these are the kind of choices that the optimizer makes, where your queries can become more sensitive to parameter sniffing issues, when your data is really massively skewed. So, you know, when this plan was compiled, I don’t think that the optimizer was like, oh boy, we’re going to have this thing run for 45 seconds, just to mess with your day.
Well, we know that it was executing with a parent ID of zero getting passed in for the parameter. But let’s go look at the execution plan. And we’ll get that select operator. And now when we look at the we look at the execution line, we see the stuff that might be sensitive to parameter sniffing here, you know, might be some other stuff going on. But we get a little grab the select operator and get the properties there. We can do that by right clicking and hitting properties or by hitting F4.
But this properties thing will open up. And if we look at the parameter list, again, newer versions of SQL Server make this a little bit a lot easier, you know, like I’m on this is I’m downloading this on SQL Server 2019. But we can see the parameter compile value was 184618. And the parameter runtime value is zero. So how is this helpful? Well, now we know how to test the store procedure, right?
So we can we know that we have a runtime value of zero and a compile time value of 184618. So I’m going to copy this. All right. And let’s let’s close this to and let’s go back to our store procedure here. Paste that in, get rid of that. And let’s see what happens when we execute sniffles over here with a parameter compile value of 184618.
Well, this is running crazy fast. All right. This runs very, very quickly. All right. Nothing, nothing bad there. When we look at the execution plan, we can see just how quickly this thing runs. But, you know, this is where you have to start making some tuning decisions, because obviously if we run it for 184618, everything’s fine.
If we run it for zero, everything is not fine. This will run for about 45 seconds. But if we I’m going to mess this up because I always I always mess this up. But if we clear out the plan cache and we run this for parent ID zero first, this finishes very quickly.
Right. We have a different execution plan. And now if we run this for 184618, it’s still going to be relatively quick. Right. A lot faster than when when when when the plans got shared in the in the in the opposite order.
So we’d have to ask some questions here. Right. Did did we get a bad plan because 184618 was like the compile value? Is parent ID zero not something that people usually pass in?
You know, should we optimize for parent ID equals zero? You know, should we recompile constantly looks like there’s lots of questions that we could ask ourselves about how we want to fix this. Maybe if we’re feeling crazy, we could we could, you know, change that.
We could rewrite the query or, you know, change indexes to fix the key lookup. There’s a lot of options on the table. There’s a lot of different things you could think about. It’s all going to come down to, you know, what you’re most comfortable with or like how much control you have over the code or the indexes or the application itself.
So there’s all sorts of stuff we could do here. You know, we could even force plans with query store. We could create plan guides. Maybe they’d even work. I don’t know.
It’s crazy. Just don’t wait for the robots to fix it. That’s that’s my advice. Don’t wait for the robots. If you let the robots one up you once, they’ll never stop.
Never be able to live that down. Anyway, when you’re looking when you’re troubleshooting parameter sniffing and you’re sitting in front of the server, SB who is active is a great tool to do that.
And the parameters that I use with SB who is active to help me get the most out of trying to get to the root cause of a parameter sniffing issue are get average time equals one, which will show you which will go into the plan cache and look at how long this query executes for on average. And it will tell you and you can help figure out is this thing running much more slowly than usual or is this thing running slow as usual.
If you’re if it’s a store procedure, get outer command equals one is very helpful because it will show you like just the regular execution shows you the text of the query that’s executing. Using get outer command will also get you the stored procedure and the current execution values for it. And of course, get plans equals one will get you the execution plan on newer versions of SQL Server.
This does kind of make get outer command a little bit redundant because we get the parameter compile value and the runtime value. But on older versions of SQL Server, you could probably do with getting both. But this the getting the execution plan back is probably pretty helpful no matter what, because this is what we start figuring out what which part of our query plan is sensitive to parameters nothing and trying to figure out if and how we want to fix it.
I think it sounded good. We might just want to let it go because we hate our server. We want it to burn slowly.
We want to migrate to a real database. Like text files or Excel or access. I don’t know.
You people are crazy. You know, maybe you just want to write your own database. Just import the Python database library and you’re set. Just forget about SQL Server.
Anyway, thank you for watching. I hope you learned something and I’ll see you in another video sometime. Bye. Bye.
Going Further
If this is the kind of SQL Server stuff you love learning about, you’ll love my training. Blog readers get 25% off the Everything Bundle — over 100 hours of performance tuning content. Need hands-on help? I offer consulting engagements from targeted investigations to ongoing retainers. Want a quick sanity check before committing to a full engagement? Schedule a call — no commitment required.
There are a lot of words you can use to describe Extended Events. I’ll skip over my list to keep the blog family friendly.
In this post, we’re going to look at how two event can show the same query having a different plan handle.
I stumbled on this while working on sp_HumanEvents, when one of my precious sessions suddenly STOPPED RETURNING RESULTS.
Very helpful.
Let’s look at why.
A Plan Here, A Plan There
When the optimizer gets its hands on a query, it has some early choices, where it might choose to keep a plan at the trivial optimization level, and it may choose simple parameterization in order to make things more re-usable.
Apparently this causes some differences when it comes to hashing plans.
Here’s an example query:
SELECT COUNT(*) FROM dbo.Votes WHERE BountyAmount = 500 AND UserId = 22565;
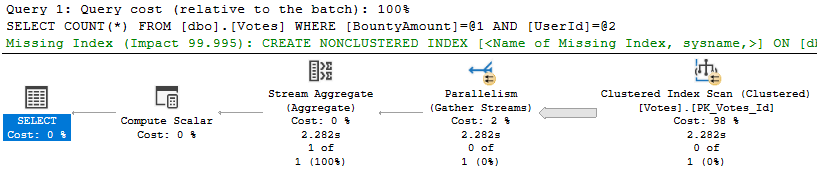
Looking at the execution plan for it, we know a couple things.
Goodbye to you.
It didn’t stay trivial because it went parallel, and the optimizer thought that simple parameterization was a good idea. Even though we passed in literals, they’re replaced by parameters in the execution plan text.
What’s the big deal?
Well, nothing, unless you want to correlate information about a single query from multiple Extended Events.
Check It Out
Let’s run sp_HumanEvents and get debug information — because the regular results won’t return anything for this query right now (I have fixed this issue, don’t worry).
I’m grabbing the debug here too so we can see what ends up in the temp tables along the way.
COOL YEAH
We can grab information about which queries caused waits, and the plan handle here is the same one that we saw in the post execution showplan event.
Yay?
In the Actual Results Plus from sp_HumanEvents, we can see the simple parameterized version of the query ended up in the plan cache.
Goodie Bagg
There are two lines here because we had waits on two different wait stats, but the point is more that we can see simple parameterization at work here, but not in the events that collected information about executed queries.
Frustration Point
The problem would have been more obvious if the parameterized text showed up in the post execution showplan event, and not the version with literal values. It would have been easier to figure out why the plan handles were different, anyway.
So what’s the solution? Now, sp_HumanEvents will only get the plan handle from the post execution showplan event, in case you want to go and do anything with it later.
Thanks for reading!
Going Further
If this is the kind of SQL Server stuff you love learning about, you’ll love my training. Blog readers get 25% off the Everything Bundle — over 100 hours of performance tuning content. Need hands-on help? I offer consulting engagements from targeted investigations to ongoing retainers. Want a quick sanity check before committing to a full engagement? Schedule a call — no commitment required.
In this video, I dive into the fascinating world of forcing query plans using Query Store and uncover an interesting gotcha along the way. Starting off with a bit of humor about changing my company name to “Grimes’ baby name,” which promises to make paperwork more exciting, I clear out Query Store and set up an index on a users table for demonstration purposes. The video then explores how forcing query plans works when using literal values in queries versus parameterized queries. By running two different queries with the same logic but different literal values, I highlight the differences in execution plans and explain why SQL Server treats them as separate queries despite their similarity. This leads to an important lesson: if you want to force a specific plan ID for a query ID using Query Store, you must use parameterized queries to avoid the limitations imposed by literal values. The video concludes with practical advice on when and how to leverage parameterized code for better SQL Server performance management.
Full Transcript
Erik Darling here with, for now, Erik Darling data. But I’ve got paperwork in to change my company name to Grimes’ baby name. So that’s going to be fun. That should make paperwork interesting, right? So I’m going to record a hopefully hit video here. I’ve got everything going for me. I have pretty good equipment. I’ve got an interesting topic. And now all I need is for you to watch it, I guess. Actually, is it interesting? I don’t know. It might be interesting. It depends on what your kink is, I guess. So what we’re going to talk about is forcing query plans in Query Store and an interesting gotcha that I ran into. So first thing I want to do is clear out Query Store. Right there. Bada bing, bada boom.
I’ve already got this index created on the users table and a column called reputation because I want to get two different query plans based on how we query the users table. Now, both of the queries that I’m going to run at first are going to use literal values in the where clause. So this is going to be the literal value one and this is going to be the literal value two. And if I run this first query, we will get back an execution plan. I promise an actual execution plan, an actual factual execution plan.
Maybe we’ll start calling them literal execution plans because they are literally what happened. And we’ll call estimated plans figurative plans because that’s just what the optimizer figured it would do. I think that makes sense, right? So right over here we have our literal execution plan where we start by scanning the clustered index on the post table, doing some hashy bitmap stuff and then down here joining off to the users table.
But the clustered index on the users table, not the nonclustered index that we created. This will all change. This will all get freaky, deaky, wikiwile, wikiwile when we run this query. That’s going to look for reputation equals two. For reputation equals two, we start with an index seek into our nonclustered index on the users table. We do a key lookup back to the clustered index to get that display name column because the display name column is not in our nonclustered index.
And then we do some hashy bitmap stuff over here and then down the bottom, well then on the inner side of the join rather, we join to the clustered index on the post table. That song remains the same, but the stuff with the users table was much different. Now in all different DMVs, all different parts of SQL Server, queries get identified in different ways.
In query store, you have a query ID and a plan ID, but in lots of the more traditional DMVs, we have like query hash, query plan hash, SQL handle, plan handle, all sorts of different hashes, different like binary values that SQL Server uses to represent execution plans. Now what’s funny to me is that if we go and look in the sys.query store query table, rolls right off the tongue, thanks whoever designed that. If we run this query and we look at what SQL Server thinks of our execution plan or other of our queries rather, we will get one query hash for both of those queries, but we will have two query IDs for it.
So SQL Server treated this at the query level like it’s one query, but query store treated it like two different queries, and I’ll show you what I mean. If we run this to get some more details on these queries, and yes we do need to join one, two, three, four different views together to get this information out, we will see that we have across the board, query ID one has plan ID one, one execution and use 3.5 seconds of CPU time on average. So that’s for reputation equals one, we can see that over here.
Query ID two down the bottom is also plan ID two, with one execution and 1.4 seconds of CPU time, and of course that is where reputation equals two. Now, if you found some super duper mega awesome script on the internet, and you wanted to make let’s say query ID one use plan ID two, because that uses less CPU, and you’re like, wow, I could totally make this query better by just having it use this different execution plan. Well, you can’t really do that. So there’s a store procedure for query store, called whatever.
So let’s say that we want to make query ID one use plan ID two, because it uses less CPU. So we’ll plug query ID one into here and plan ID two into here. And when we run this, we will get an error because the plan ID two is not associated with query ID one. Even though, if we look back into the DMVs, well, they’re nearly the same query aside from that thing.
They can’t. Query store says we can’t share an execution plan between you two. Now, this isn’t something that’s true of plan guides. Granted, plan guides have many, many, many other things that are strange and wrong with them.
But we would be able to do this. Now, the optimizer would check to make sure we weren’t doing anything completely asinine. Like if we had a query that was like select count from post and we wanted and we said, hey, use this plan guide where you select count from votes. The optimizer would be like, you’re up to no good. Not going to go through with that.
But here, even though like logically and semantically, like really every other way possible, these two queries should be able to share the same plan because they get different query IDs. Because of those literal values, they can’t. So how you can fix this or how you can get around this is if you use parameterized queries. All right. So what we’re going to do is you know, you can use a stored procedure.
I’m going to use SP execute SQL because it’s a little bit quicker, not faster like performance wise, just quicker to like have on screen and show you. But I’m going to run this and we’re going to run it for reputation equals one first. And I have a recompile hint in here because I want to get two different execution plans.
I want new execution plans here. So I’m going to run this for reputation equals one. And note that this is parameterized. This is not the crappy, hacky kind of dynamic SQL that gets people fired because hackers destroy their database.
This is the good safe kind of dynamic SQL that handsome tattooed consultants use all day long. So we’re going to that’s I believe that one comes before two. So that should be reputation equals one.
And we can look over at the query plan and see that, yes, indeed, we got that that plan that we wanted. Now, I’m going to run this for reputation equals two. And we’re going to get the key lookup plan, which is intentional. I want that to happen.
There’s a reason that recompile hint is in there. So now we see that we got that same key lookup plan again. So that’s good. That’s exactly what we wanted. Now, when I go in, I go back to sys.queryStoreQuery for some reason, and I go and I look for other query hashes that have more than one distinct plan associated with them. And I run this, we still only have that one result in there.
That’s from that’s the one from before query hash that ends in 8044 with two query IDs associated with it. But now when we look in the query, when we do we run our 70,000 join query to get four columns back. Now we have two more lines in here.
And these two lines here, they start a little bit different. These ones have little parameters at the beginning of them. All right, let’s see that reputation thing there. And if we make this column a little bit wider, we can see that there’s a difference.
So this top one is where reputation equals one literal. This one is where reputation equals two literal. But in these, this is parameterized.
So we just see that reputation parameter in there. So now, when we have one query ID across of both of them, but two different plan IDs. So this means that we could, we could tell query ID five to always use execution plan four.
So let’s go try to do that. Remember, query ID five, you want to use four because we found this awesome script on the internet and it said, hey, you know what you should do? You should force plans where you have a better one.
And you were like, okay, I’m going to do that because I don’t feel like doing actual work. So we’re going to say query ID five, use plan ID four. And we plug that in here and we plug that in here.
Oh man, I’m exhausted. Whew. Let’s start doing cardio or something. Just kidding. Just kidding.
Just kidding. So we’re going to run this and this now, now we will be allowed to associate that other plan ID with that other query ID. So if you are the type of person who gets cranky about SQL Server performance and you are the type of person who gets cranky about, I don’t know, stuff like regressions or I don’t know, things going wrong with queries. You know, you should make some attempt to use parameterized code if you are, if you wanted to use a query store to force execution plans.
Otherwise SQL Server will do what it does. Like when it compiles a lot of, when it like sees literal values and queries and keeps compiling new plans for them. Query store does the same thing.
It’s just like, I don’t know you. And it gives them new query IDs and then, and then you can’t force query plans across query IDs. And then you actually have to go tune queries.
And that sucks. It’s always, life is always a lot better when you can just hit a button. Isn’t it?
It is for me anyway. Alright. Thanks for watchin’. I don’t know. It’s always in a rescue kit. And it’s still dying if the weather is good for you.
Going Further
If this is the kind of SQL Server stuff you love learning about, you’ll love my training. Blog readers get 25% off the Everything Bundle — over 100 hours of performance tuning content. Need hands-on help? I offer consulting engagements from targeted investigations to ongoing retainers. Want a quick sanity check before committing to a full engagement? Schedule a call — no commitment required.
Let’s look at a pretty simple query against the Votes table:
SELECT v.VoteTypeId,
       MIN(v.CreationDate) AS min_creation_date,
       MAX(v.CreationDate) AS max_creation_date,
       COUNT_BIG(*) AS records
FROM dbo.Votes AS v
GROUP BY v.VoteTypeId
ORDER BY v.VoteTypeId;
There are only two columns involved:
VoteTypeId, which we’re grouping on
CreationDate, which we’re finding min and max values for
There are two different ways to approach this:
CREATE INDEX even_steven
    ON dbo.Votes(VoteTypeId, CreationDate);

CREATE INDEX steven_even
    ON dbo.Votes(CreationDate, VoteTypeId);
But first, let’s look at the query with just the clustered index, which is on the Id column, not mentioned at all in the query.
We’ll call this our baseline.
You’re a great time.
This takes 2 seconds.
Even Steven
With an index on VoteTypeId, CreationDate, what happens?
Well that uh. Took 5 seconds.
It’ll take 5 seconds no matter how many times I run it.
This might sound like a very good index though, because even though we don’t have a where clause looking for VoteTypeIds, we’re grouping by them.
Having CreationDate next in the index key should make it really easy to find a min and max value for each VoteTypeId, because CreationDate will be in order.
And you know what? That sort of works out. We get a Stream Aggregate in the plan without a Sort operator.
But it still sucks: Why?
Steven Even
With this index, we go right back to… What we had before.
Mediocrity has many names.
We went through all the trouble of adding indexes, to have one be slower, and one not get us any faster than just using the clustered index.
What gives?
Teenage Angst
I’ve been avoiding something a little bit, dear reader. You see, I’m using SQL Server 2019.
The first plan and the third plan — the ones that finished in 2 seconds — they both used batch mode on rowstore. That’s an Enterprise Edition optimizer feature available in compat level 150.
If you were to run this on SQL Server 2017 or earlier, you would find no measurable difference between any one of these queries.
And look, batch mode on row store does represent a good improvement in many cases for large aggregation queries — the type of queries that would benefit from columnstore in general — and maybe in places where you’re unable to use columnstore today because you’re also using triggers, cursors, Replication, or another feature that it disagrees with.
If you suddenly saw a 60% improvement in some of your “big” queries, you’d probably be pretty happy. I’m not saying it comes for free, or that it’s a magickal world where everything is perfect for every query now.
You can only get that if you have PLAN GUIDES FOR EVERY QUERY. H ah aa ah ah ha a.
But let’s consider something else
It only kicked in when our indexes were lacking.
When we had a “good index”, SQL Server chose a plan with no batch-y mode-y at all.
If you’ve carefully crafted some indexes over the years, even a sure shot for the type of query you want to get some batch mode love may not see it.
If this is the kind of SQL Server stuff you love learning about, you’ll love my training. Blog readers get 25% off the Everything Bundle — over 100 hours of performance tuning content. Need hands-on help? I offer consulting engagements from targeted investigations to ongoing retainers. Want a quick sanity check before committing to a full engagement? Schedule a call — no commitment required.
If you have stored procedures that do things like this:
IF @OwnerUserId IS NOT NULL
   SET @Filter = @Filter + N' AND p.OwnerUserId = ' + RTRIM(@OwnerUserId) + @nl;
IF @CreationDate IS NOT NULL
   SET @Filter = @Filter + N' AND p.CreationDate >= ''' + RTRIM(@CreationDate) + '''' + @nl;
IF @LastActivityDate IS NOT NULL
   SET @Filter = @Filter + N' AND p.LastActivityDate < ''' + RTRIM(@LastActivityDate) + '''' + @nl;
IF @Title IS NOT NULL
   SET @Filter = @Filter + N' AND p.Title LIKE ''' + N'%' + @Title + N'%''' + @nl;
IF @Body IS NOT NULL
   SET @Filter = @Filter + N' AND p.Body LIKE ''' + N'%' + @Body + N'%'';';
IF @Filter IS NOT NULL
   SET @SQLString += @Filter;

PRINT @SQLString
EXEC (@SQLString);
Or even application code that builds unparameterized strings, you’ve probably already had someone steal all your company data.
Way to go.
But Seriously
I was asked recently if the forced parameterization setting could prevent SQL injection attacks.
Let’s see what happens! I’m using code from my example here.
EXEC dbo.AwesomeSearchProcedure @OwnerUserId = 35004,
                                @Title = NULL,
                                @CreationDate = NULL,
                                @LastActivityDate = NULL,
                                @Body = N''' UNION ALL SELECT t.object_id, t.name, NULL, NULL, SCHEMA_NAME(t.schema_id) FROM sys.tables AS t; --';
If we look at the printed output from the procedure, we can see all of the literal values.
SELECT TOP (1000) p.OwnerUserId, p.Title, p.CreationDate, p.LastActivityDate, p.Body
FROM dbo.Posts AS p
WHERE 1 = 1
AND p.OwnerUserId = 35004
AND p.Body LIKE '%' UNION ALL SELECT t.object_id, t.name, NULL, NULL, SCHEMA_NAME(t.schema_id) FROM sys.tables AS t; --%';
But if we look at the query plan, we can see partial parameterization (formatted a little bit for readability)
dang
where @0 = @1 and p . OwnerUserId = @2
and p . Body like '%' union all select t . object_id , t . name , null , null , SCHEMA_NAME ( t . schema_id ) from sys . tables as t
Slightly More Interesting
If we change the LIKE predicate on Body to an equality…
IF @Body IS NOT NULL
   SET @Filter = @Filter + N' AND p.Body = ''' + @Body + ';';
The parameterization will change a little bit, but still not fix the SQL injection attempts.
Instead of the ‘%’ literal value after the like, we get @3 — meaning this is the third literal that got parameterized.
dang
where @0 = @1 and p . OwnerUserId = @2
and p . Body = @3 union all select t . object_id , t . name , null , null , SCHEMA_NAME ( t . schema_id ) from sys . tables as t
But the injecty part of the string is still there, and we get the full list of tables in the database back.
Double Down
If you’d like to learn how to fix tough problems like this, and make your queries stay fast, check out my advanced SQL Server training.
Thanks for reading!
Going Further
If this is the kind of SQL Server stuff you love learning about, you’ll love my training. Blog readers get 25% off the Everything Bundle — over 100 hours of performance tuning content. Need hands-on help? I offer consulting engagements from targeted investigations to ongoing retainers. Want a quick sanity check before committing to a full engagement? Schedule a call — no commitment required.