Why, just last week I forgot everything for 3 hours.
It was lovely.
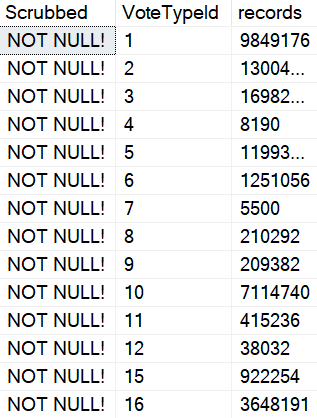
These two queries look close enough , but they aren’t.
--Numero Uno
SELECT   CASE v.UserId WHEN NULL
                       THEN 'NULL!'
                       ELSE 'NOT NULL!'
         END AS Scrubbed,
         v.VoteTypeId,
         COUNT_BIG(*) AS records
FROM     dbo.Votes AS v
GROUP BY CASE v.UserId WHEN NULL
                       THEN 'NULL!'
                       ELSE 'NOT NULL!'
         END,
         v.VoteTypeId
ORDER BY v.VoteTypeId;

--Numero Dos
SELECT   CASE WHEN v.UserId IS NULL THEN 'NULL!'
              WHEN v.UserId IS NOT NULL THEN 'NOT NULL!'
         END AS Scrubbed,
         v.VoteTypeId,
         COUNT_BIG(*) AS records
FROM     dbo.Votes AS v
GROUP BY CASE WHEN v.UserId IS NULL THEN 'NULL!'
              WHEN v.UserId IS NOT NULL THEN 'NOT NULL!'
         END,
         v.VoteTypeId
ORDER BY v.VoteTypeId;
Results To Gridiot
The first query returns what appears to be rather odd results.
dumb party
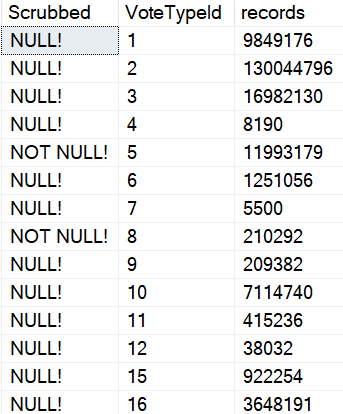
There are many NULLs in this column, and they’re exposed when we run the second query.
Get’em
See them? All the NULLs? They’re here now.
1-900-MUPPET
The first query is the same thing as saying UserId = NULL.
That doesn’t get you anywhere at all in a database.
What is this, EXCEL?
To judge the NULL and the NOT NULL, you have to use IS NULL and IS NOT NULL.
But I forgot about that in CASE expressions, so I decided to write it down.
Thanks for reading!
Going Further
If this is the kind of SQL Server stuff you love learning about, you’ll love my training. Blog readers get 25% off the Everything Bundle — over 100 hours of performance tuning content. Need hands-on help? I offer consulting engagements from targeted investigations to ongoing retainers. Want a quick sanity check before committing to a full engagement? Schedule a call — no commitment required.
I’m going to show you something bizarre. I’m going to show it to you because I care for your well-being and long term mental health.
Someday you’ll run into this and be thoroughly baffled, and I want to be here for you. Waiting, watching, lubricating.
I have a stored procedure. It’s a wonderful stored procedure.
But something funny happens when a parameter gets sniffed.
Wrote A Little Song About It
It’s not the usual parameter sniffing thing, where you get different plans and blah blah blah. That’s dull.
This is even more infuriating. Here’s the part where care about, where we read data to insert into the #temp table.
something new
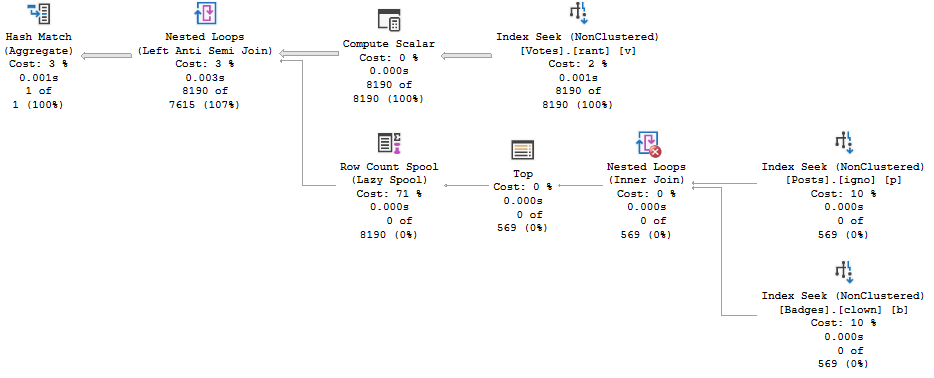
This is the “small” version of the plan. It only moves about 8200 rows.
Now here’s the “big” version of the plan.
practice makes
We move way more rows out of the seek (9.8 million), but doesn’t it seem weird that a seek would take 5.6 seconds?
I think so.
Pay special attention here, because both queries aggregate the result down to one row, and the insert to the #temp table is instant both times.
Wanna Hear It?
Let’s do what most good parameter sniffing problem solvers do, and re-run the procedure after recompiling for the “big” value.
escapism
It’s the exact same darn plan.
Normally, when you’re dealing with parameter sniffing, and you recompile a procedure, you get a different plan for different values.
Not here though. Yes, it’s faster, but it’s the same operators. Seek, Compute, Stream, Stream, Compute, Insert 1 row.
Important to note here is that the two stream aggregates take around the same about of time as before too.
The real speed up was in the Seek.
How do you make a Seek faster?
YOU NEEK UP ON IT.
Three Days Later
I just woke up from beating myself with a hammer. Sorry about what I wrote before. That wasn’t funny.
But okay, really, what happened? Why is one Seek 4 seconds faster than another seek?
Locking.
All queries do it, and we can prove that’s what’s going on here by adding a locking hint to our select query.
Now, I understand why NOLOCK would set your DBA in-crowd friends off, and how TABLOCK would be an affront to all sense and reason for a select.
So how about a PAGLOCK hint? That’s somewhere in the middle.
what we got here
The Seek that took 5.6 seconds is down to 2.2 seconds.
And all this time people told you hints were bad and evil, eh?
YTHO?
It’s pretty simple, once you talk it out.
All queries take locks (even NOLOCK/READ UNCOMMITTED queries).
Lock escalation doesn’t usually happen with them though, because locks don’t accumulate with read queries the way they do with modification queries. They grab on real quick and then let go (except when…).
For the “small” plan, we start taking row locks, and keep taking row locks. The optimizer has informed the storage engine that ain’t much ado about whatnot here, because the estimate (which is correct) is only for 8,190 rows.
That estimate is preserved for the “big” plan that has to go and get a lot more rows. Taking all those additional row locks really slows things down.
No Accumulation, No Escalation.
We stay on taking 9.8 million row locks instead of escalating up to page or object locks.
When we request page locks from the get-go, we incur less overhead.
For the record:
PAGLOCK: 2.4 seconds
TABLOCK: 2.4 seconds
NOLOCK: 2.4 seconds
Nothing seems to go quite as fast as when we start with the “big” parameter, but there’s another reason for that.
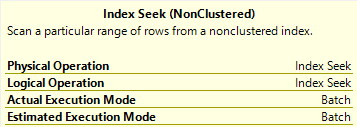
When we use the “big” parameter, we get batch mode on the Seek.
A FULL SECOND
Welcome to 2019, pal.
Thanks for reading!
Going Further
If this is the kind of SQL Server stuff you love learning about, you’ll love my training. Blog readers get 25% off the Everything Bundle — over 100 hours of performance tuning content. Need hands-on help? I offer consulting engagements from targeted investigations to ongoing retainers. Want a quick sanity check before committing to a full engagement? Schedule a call — no commitment required.
Whether you see one by hitting CTRL+L, looking in the plan cache, or looking in Query Store, the song remains the same.
The query is slow: sometimes? always? usually? rarely?
But where? But why?
Estimated plans can hide a lot of work from you. They’re sort of like government contracts, where the optimizer is the government: it picks the cheapest plan, but then…
(Okay, maybe it picks a plan because a friend or relative or big donor was behind it. Sometimes it seems that way, with the nonsense you end up with.)
Of course once execution is under way, you run into all sorts of unexpected costs: Everything is much more expensive, and takes a whole lot longer than projected.
Glad Ways
From a practical perspective, estimated plans can be useful to get a general idea of the plan shape that the optimizer is coming up with.
Despite all the lying estimated plans can do, you may be able to spot some obvious anti-patterns.
Of more utility is when the query is particularly long running, or when the query will modify underlying data.
When I’m tuning modification queries, there’s usually some pain involved when you need to reset things.
For example:
Most people don’t want to wait 5-10 minutes just to see if a plan changed after making changes
Not being able to insert duplicate data a second time
…Are all hindrances to getting things done.
And so you need to restore or roll things back another way (and boy howdy has SQL Server 2019 spoiled me for rollbacks).
Thanks for reading!
Going Further
If this is the kind of SQL Server stuff you love learning about, you’ll love my training. Blog readers get 25% off the Everything Bundle — over 100 hours of performance tuning content. Need hands-on help? I offer consulting engagements from targeted investigations to ongoing retainers. Want a quick sanity check before committing to a full engagement? Schedule a call — no commitment required.
There was one thing that I didn’t talk about earlier in the week.
You see, there’s a mystery plan.
It only shows up once in a while, like Planet X. And when it does, we get bombarded by asteroids.
Just like when Planet X shows up.
I wouldn’t call it a good all-around plan, but it does something that we would want to happen when we run this procedure for VoteTypeId 5.
Let’s go look!
The Optimizer Discovers Aggregates, Sort Of
This isn’t a good “general” plan. In fact, for any of the previously fast values, it sucks.
It sucks because just like the “optimize for unknown” plan, it has a bunch of startup costs, does a lot of scanning, and is generally a bad choice for VoteTypeIds that produce a small number of values.
Ghost Town
Johnny Four
If you look carefully, you can see what the problem is.
For VoteTypeIds that filter out a lot of rows (which is most of them), that predicate doesn’t get applied until after Posts and Badges have been joined.
In other words, you fully join those tables, and then the result of that join is joined to the predicate-filtered result of Votes.
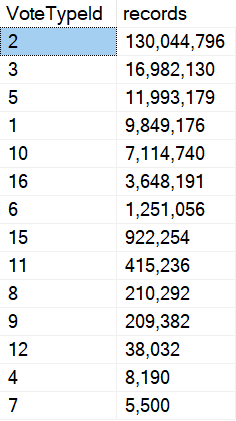
For this execution, the plan was compiled initially for VoteTypeId 2. It has 130 million entries in Votes. It’s the only VoteTypeId that produces this plan naturally.
The plan you’re looking at above was re-executed with VoteTypeId 4, which has… 8,190 rows in Votes.
I can’t stress enough how difficult it would be to figure out why this is bad just looking at estimated plans.
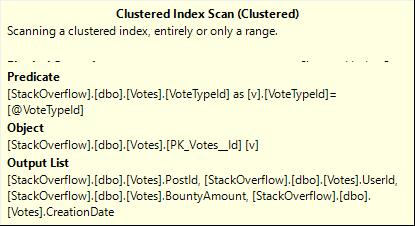
Though one clue would be the clustered index scan + predicate, if we knew that we had a suitable index.
2legit
This kind of detail with row discrepancies only surfaces with actual plans.
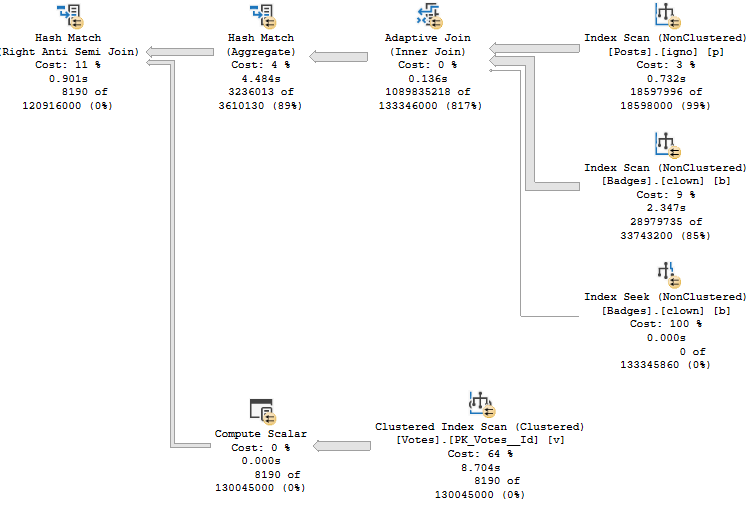
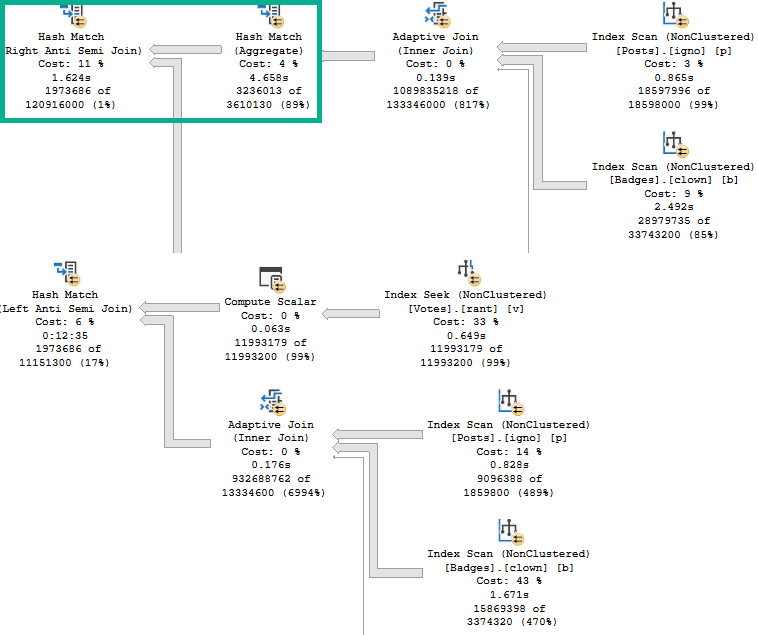
But there is one thing here that wasn’t showing up in other plans, when we wanted it to: The optimizer decides to aggregate OwnerUserId coming from the Posts table prior to joining to Votes.
Johnny Five
If you recall the previously used plan, one complaint was that the result of joining Posts and Badges then joined to Votes had to probe 932 million rows.
You can sort of see that here, where the Adaptive Join prior to the highlighted Hash Match Aggregate produces >100 million rows. It’s more here because we don’t have Bitmaps against both Posts and Badges, but… We’re going off track a bit with that.
That could have been avoided if the optimizer had decided to aggregate OwnerUserId, like it does in this plan.
To compare:
gag order
The top plan has a handy green square to show you a helpful pre-join aggregation.
The bottom plan has no handy green squares because there is no helpful pre-join aggregation.
The product of the aggregation is 3.2 million rows, which is exactly what we got as a distinct count when we began experimenting with temp tables:
SELECT COUNT_BIG(DISTINCT p.OwnerUserId) AS records --3,236,013
FROM dbo.Posts AS p
JOIN dbo.Badges AS b
    ON b.UserId = p.OwnerUserId
WHERE p.PostTypeId = 1;
Outhouse
If the optimizer had chosen to aggregate OwnerUserId prior to the join to Votes, we all could have gone home early on Friday and enjoyed the weekend
Funny, that.
Speaking of which, it’s Friday. Go enjoy the weekend.
Thanks for reading!
Going Further
If this is the kind of SQL Server stuff you love learning about, you’ll love my training. Blog readers get 25% off the Everything Bundle — over 100 hours of performance tuning content. Need hands-on help? I offer consulting engagements from targeted investigations to ongoing retainers. Want a quick sanity check before committing to a full engagement? Schedule a call — no commitment required.
With SQL Saturday Chicago being canceled this year, I still wanted the nice folks who signed up to spend a Friday with me learning about SQL Server Performance Tuning to do just that.
The event will be taking place Friday, June 26th from 10AM EST – You’re Done Asking Questions.
While you won’t get to see me eat lunch at the speed of light or wonder what kind of scotch I smell like, you will get to learn all the horrible things I know about SQL Server.
Because a lot of emails from Eventbrite seem to get sent to the Great Spam Heaven, I’m writing this post for more visibility. If you’ve already bought a ticket, please check your email. If you can’t find one, get in touch with me here. I’ve been sending them, I swear.
If this is the kind of SQL Server stuff you love learning about, you’ll love my training. Blog readers get 25% off the Everything Bundle — over 100 hours of performance tuning content. Need hands-on help? I offer consulting engagements from targeted investigations to ongoing retainers. Want a quick sanity check before committing to a full engagement? Schedule a call — no commitment required.
Let’s talk about some common hints that people use to fix parameter sniffing:
RECOMPILE: Won’t work here to get us a better plan for VoteTypeId 5, because it sucks when the optimizer knows what’s coming
OPTIMIZE FOR UNKNOWN: Works like once every 5 years, but people still bring it up, and really sucks here (picture below)
OPTIMIZE FOR (VALUE): Plan sharing doesn’t work great generally — if we were gonna do this, it’d have to be dynamic
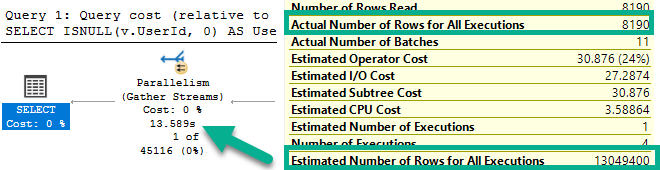
This is what happens when we optimize for unknown. The density vector guess is 13,049,400.
Stop it with this.
That guess for Vote Types with very few rows ends up with a plan that has very high startup costs.
This version of the query will run for 13-17 seconds for any given parameter. That sucks in zero gravity.
Pictured above is the plan for VoteTypeId 4, which previously finished sub-second using Plan 1 and Plan 2.
With those out of the way, how can we fix this thing?
The Mint
In some circumstances, a #temp table would help if we pre-staged rows from Votes.
The problem is that for many calls, we’d be putting between 7 and 130 MILLION rows into a temp table.
Not my idea of a good time.
RAMDISKS NINETY NINE CENTS
But what about the other part of the query?
If count up distinct OwnerUserIds, we get about 3.2 million.
Better, we can reduce the rows further in the procedure with an EXISTS to Votes (I’ll show you that in a minute).
SELECT COUNT_BIG(DISTINCT p.OwnerUserId) AS records --3,236,013
FROM dbo.Posts AS p
JOIN dbo.Badges AS b
    ON b.UserId = p.OwnerUserId
WHERE  p.PostTypeId = 1
That’s not too bad, depending on:
How frequently it runs
How concurrently it runs
How overwhelmed tempdb is
Your Mom
The Product
That gives us:
CREATE OR ALTER PROCEDURE dbo.VoteSniffing ( @VoteTypeId INT )
AS
BEGIN
SET XACT_ABORT, NOCOUNT ON;

SELECT DISTINCT p.OwnerUserId
INTO #p
FROM dbo.Posts AS p
JOIN dbo.Badges AS b
    ON b.UserId = p.OwnerUserId
WHERE p.PostTypeId = 1
AND EXISTS
(
    SELECT 1/0
    FROM dbo.Votes AS v
    WHERE v.UserId = p.OwnerUserId
    AND   v.VoteTypeId = @VoteTypeId
);

SELECT   ISNULL(v.UserId, 0) AS UserId,
         SUM(CASE WHEN v.CreationDate >= '20190101'
                  AND  v.CreationDate < '20200101'
                  THEN 1
                  ELSE 0
             END) AS Votes2019,
         SUM(CASE WHEN v.BountyAmount IS NULL
                  THEN 0
                  ELSE 1
             END) AS TotalBounty,
         COUNT(DISTINCT v.PostId) AS PostCount,
         @VoteTypeId AS VoteTypeId
FROM     dbo.Votes AS v WITH(FORCESEEK)
WHERE    v.VoteTypeId = @VoteTypeId
AND      NOT EXISTS
        (
            SELECT 1/0
            FROM #p AS p
            WHERE  p.OwnerUserId = v.UserId
        )
GROUP BY v.UserId;

END;
GO
Which works pretty well across all calls, and avoids the primary issue with VoteTypeId 5.
Navy Blue
I’m generally happy with this, with the slight exception of VoteTypeId 8. Yeah, it beats the pants off of when we sniff Plan 2, but it’s about 7 seconds slower than when we get Plan 1.
I pulled the 17 minute execution from this graph for Plan 2/VoteTypeId 5, too, because it’s so distracting. Not having to worry about that thing is a trade off I’m willing to make for Plan 3 being about a second slower than Plan 1.
Not bad for a lazy Sunday afternoon of blogging, though.
Save One For Friday
Query tuning in SQL Server 2019 isn’t always a whole lot different from performance tuning other versions of SQL Server.
You have some more help from optimizer features (especially if you’re on Enterprise Edition), but they don’t solve every problem, and you can run into some very common problems that you’re already used to solving.
You may even be able to use some very familiar techniques to fix things.
In tomorrow’s post, I want to look at a quirk that would have thrown us way off course to explore on our way here.
Thanks for reading!
Going Further
If this is the kind of SQL Server stuff you love learning about, you’ll love my training. Blog readers get 25% off the Everything Bundle — over 100 hours of performance tuning content. Need hands-on help? I offer consulting engagements from targeted investigations to ongoing retainers. Want a quick sanity check before committing to a full engagement? Schedule a call — no commitment required.
We’ve got a problem, Sam Houston. We’ve got a problem with a query that has some strange issues.
It’s not parameter sniffing, but it sure could feel like it.
When the procedure compiles and runs with VoteTypeId 5, it runs for 12 minutes
Other VoteTypeIds run well with the same plan that VoteTypeId 5 gets
When VoteTypeId 5 runs with a “small” plan, it does okay at 10 seconds
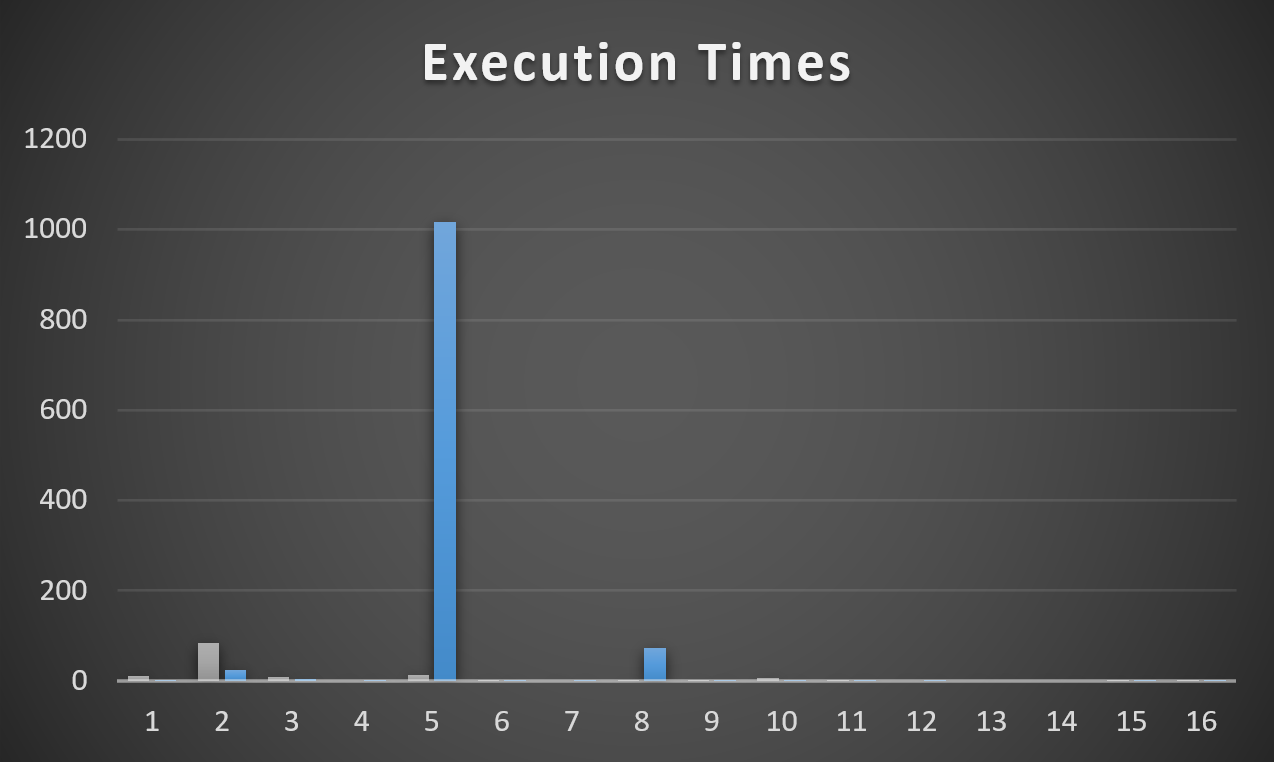
Allow me to ruin a graph to illustrate. The Y axis is still seconds, but… it goes up a little higher now.
weigh-in
The Frustration (A Minor Digression)
Here’s where life can be tough when it comes to troubleshooting actual parameter sniffing.
If you’re relying solely on the plan cache, you’re screwed. You’ll see the plan, and the compile value, but you won’t have the runtime value anywhere that “caused” the problem. In other words, the set of parameters that were adversely affected by the query plan that didn’t fit.
There are some things that can help, like if you’re watching it happen live, or if you have a monitoring tool that might capture runtime parameters.
Like I said, this isn’t parameter sniffing, but it feels like it.
It could extra-feel like it because you might see a misbehaving query, and a compile-time parameter that runs quickly on its own when you test it, e.g. VoteTypeId 6.
It would be really hard to tell that even if a plan were to compile specifically for a different parameter, it would still run for 12 minutes.
Heck, that’d even catch me off-guard.
But that’s what we have here: VoteTypeId 5 gets a bad plan special for VoteTypeId 5.
Examiner
Let’s dig in on what’s happening to cause us such remarkable grief. There has to be a reason.
I don’t need more grief without reason; I’ve already got a public school education.
I WANT TO KNOW
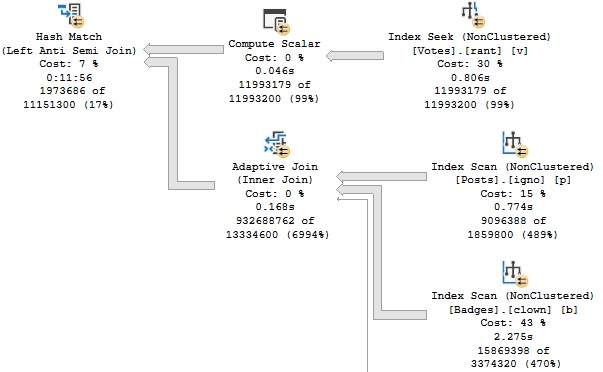
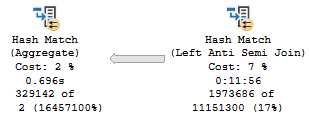
If we were to summarize the problem here: that Hash Match Left Anti Semi Join runs for 12 minutes on its own.
No other operator, or group of operators, is responsible for a significant amount of time comparatively.
Magnifier
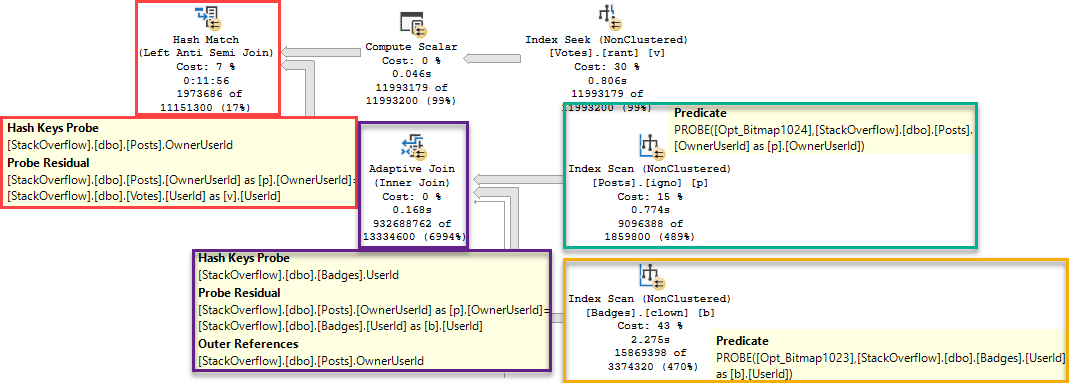
Some things to note:
The bad estimates aren’t from predicates, they’re from Batch Mode Bitmaps
Those bad estimates end up producing a much larger number of rows from the Adaptive Join
The Hash Match ends up needing to probe 932 million rows
el disastero
Taking 12 minutes to probe 932 million rows is probably to be expected, now that I think about it.
If the optimizer had a good estimate from the Bitmaps here, it may have done the opposite of what a certain Pacific Island Dwelling Bird said:
Getting every nuance of this sort of relational transformation correct can be tricky. It is very handy that the optimizer team put the effort in so we do not have to explore these tricky rewrites manually (e.g. by changing the query text). If nothing else, it would be extremely tedious to write all the different query forms out by hand just to see which one performed better in practice. Never mind choosing a different version depending on current statistics and the number of changes to the table.
In this case, the Aggregate happens after the join. If the estimate were correct, or even in the right spacetime dimension, this would be fine.
We can gauge the general efficiency of it by looking at when this plan is used for other parameters that produce numbers of rows that are closer to this estimate.
huey
If the optimizer had made a good guess for this parameter, it may have changed the plan to put an aggregate before the join.
Unfortunately we have very little control over estimates for Bitmaps, and the guesses for Batch Mode Bitmaps are a Shrug of Atlassian proportions.
Finisher
We’ve learned some things:
This isn’t parameter sniffing
Batch Mode Bitmaps wear pants on their head
Batch Mode Bitmaps set their head-pants on fire
Most of the time Batch Mode performance covers this up
The plan for VoteTypeId 5 is not a good plan for VoteTypeId 5
The plan for VoteTypeId 5 is great for a lot of other VoteTypeIds
In tomorrow’s post, we’ll look at how we can fix the problem.
Thanks for reading!
Going Further
If this is the kind of SQL Server stuff you love learning about, you’ll love my training. Blog readers get 25% off the Everything Bundle — over 100 hours of performance tuning content. Need hands-on help? I offer consulting engagements from targeted investigations to ongoing retainers. Want a quick sanity check before committing to a full engagement? Schedule a call — no commitment required.
When I first wrote this demo, I called it dbo.ParameterSniffingMonstrosity.
Because , you know, it’s really terrible.
CREATE OR ALTER PROCEDURE dbo.VoteSniffing( @VoteTypeId INT )
AS
SET XACT_ABORT, NOCOUNT ON;
    BEGIN
        SELECT   ISNULL(v.UserId, 0) AS UserId,
                 SUM(CASE WHEN v.CreationDate >= '20190101'
                          AND  v.CreationDate < '20200101'
                          THEN 1
                          ELSE 0
                     END) AS Votes2019,
                 SUM(CASE WHEN v.BountyAmount IS NULL
                          THEN 0
                          ELSE 1
                     END) AS TotalBounty,
                 COUNT(DISTINCT v.PostId) AS PostCount,
                 @VoteTypeId AS VoteTypeId
        FROM     dbo.Votes AS v
        WHERE    v.VoteTypeId = @VoteTypeId
        AND      NOT EXISTS
                (
                    SELECT 1/0
                    FROM dbo.Posts AS p
                    JOIN dbo.Badges AS b
                        ON b.UserId = p.OwnerUserId
                    WHERE  p.OwnerUserId = v.UserId
                    AND    p.PostTypeId = 1
                )
        GROUP BY v.UserId;
    END;
GO
The only parameter is for VoteTypeId, which has some pretty significant skew towards some types, especially in the full size Stack Overflow database.
Ask me about my commas
It’s like, when people tell you to index the most selective column first, well.
Sometimes it’s pretty selective.
Sometimes it’s not very selective
But this is exactly the type of data that causes parameter sniffing issues.
With almost any data set like this, you can draw a line or three, and values within each block can share a common plan pretty safely.
But crossing those lines, you run into issues where either little plans do far too much looping and seeking and sorting for “big” values, and big plans do far too much hashing and scanning and aggregating for “little” values.
This isn’t always the exact case, but generally speaking you’ll observe something along these lines.
It’s definitely not the case for what we’re going to be looking at this week.
This week is far more interesting.
That’s why it’s a monstrosity.
Fertilizer
The indexes that I create to support this procedure look like so — I’ve started using compression since at this point in time, 2016 SP1 is commonplace enough that even people on Standard Edition can use them — and they work quite well for the majority of values and query plans.
CREATE INDEX igno
ON dbo.Posts
    (OwnerUserId, PostTypeId)
    WHERE PostTypeId = 1
WITH(MAXDOP = 8, SORT_IN_TEMPDB = ON, DATA_COMPRESSION = ROW);
GO

CREATE INDEX rant
ON dbo.Votes
    (VoteTypeId, UserId, PostId)
INCLUDE
    (BountyAmount, CreationDate)
WITH(MAXDOP = 8, SORT_IN_TEMPDB = ON, DATA_COMPRESSION = ROW);
GO

CREATE INDEX clown ON dbo.Badges( UserId )
WITH(MAXDOP = 8, SORT_IN_TEMPDB = ON, DATA_COMPRESSION = ROW);
GO
If there are other indexes you’d like to test, you can do that locally.
What I want to point out is that for many values of VoteTypeId, the optimizer comes up with very good, very fast plans.
Good job, optimizer.
In fact, for any of these runs, you’ll get a good enough plan for any of the other values. They share well.
VoteTypeIds 1, 2, 3, 5, 8, and 10 have some quirks, but even they mostly do okay using one of these plans.
There are two plans you may see occur for these.
Plan 1
teeny tiny
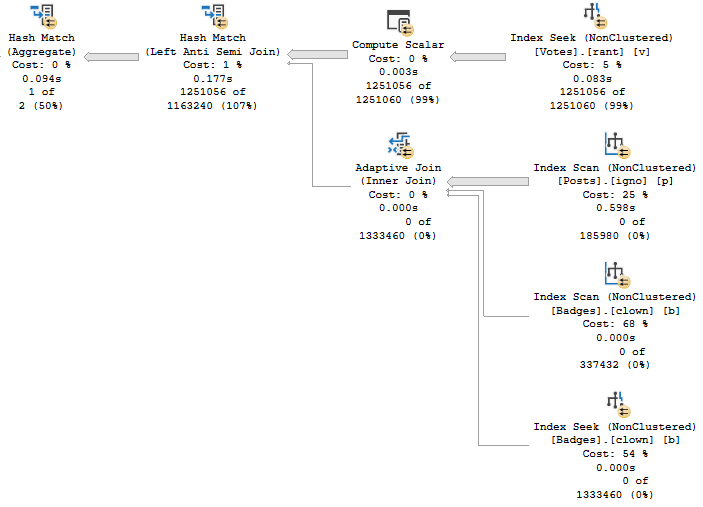
Plan 2
it has adapted
Particulars & Peculiars
Plan 1 is first generated when the procedure is compiled with VoteTypeId 4, and Plan 2 is first generated when the procedure is compiled with VoteTypeId 6.
There’s a third plan that only gets generated when VoteTypeId 2 is compiled first, but we’ll have to save that for another post, because it’s totally different.
Here’s how each of those plans works across other possible parameters.
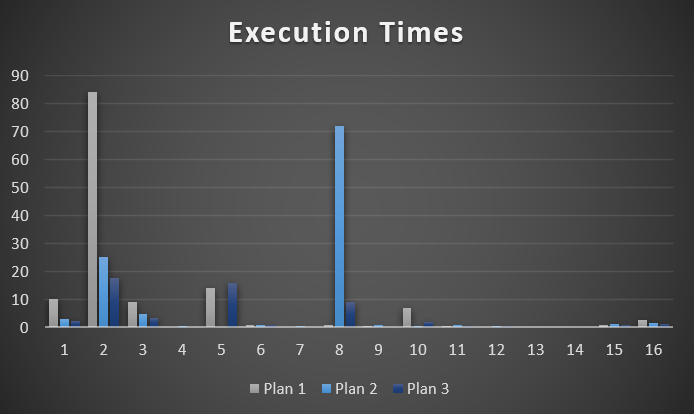
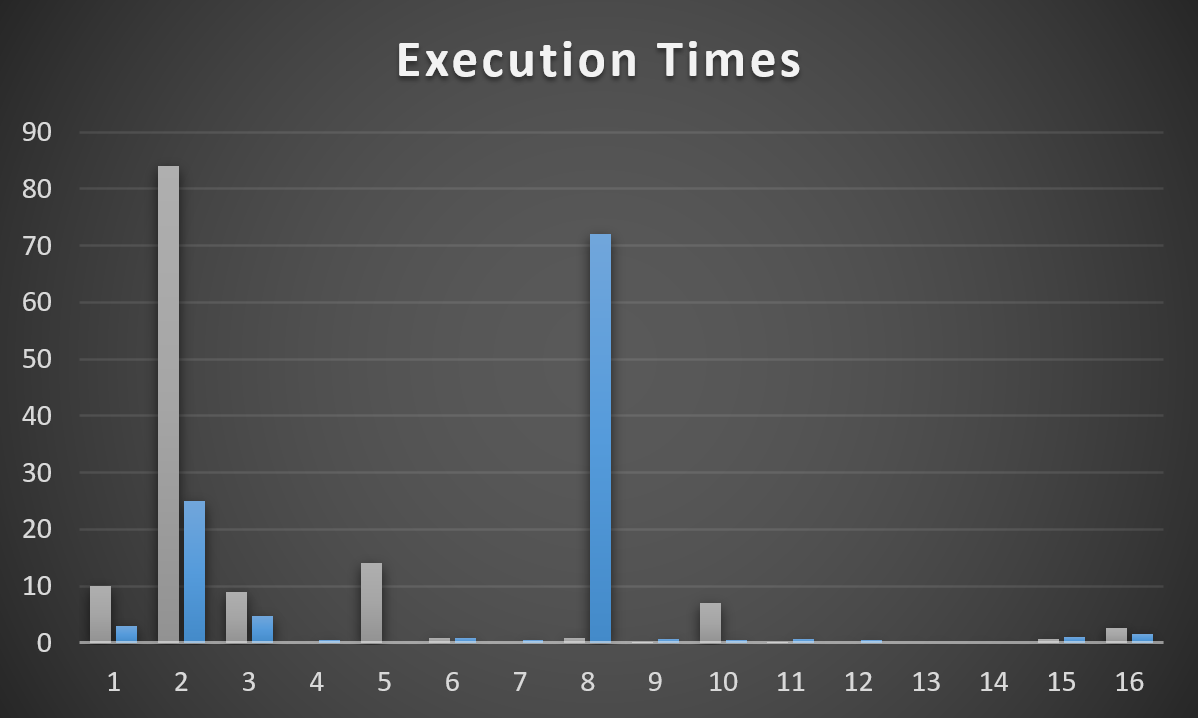
this is my first graph
Plan 1 is grey, Plan 2 is blue. It’s pretty easy to see where each one is successful, and then not so much. Anything < 100ms got a 0.
The Y axis is runtime in seconds. A couple are quite bad. Most are decent to okay.
Plans for Type 2 & 8 obviously stick out, but for different plans.
This is one of those things I need to warn people about when they get wrapped up in:
Forcing a plan (e.g. via Query Store or a plan guide)
Optimizing for unknown
Optimizing for a specific value
Recompiling every time (that backfires in a couple cases here that I’m not covering right now)
One thing I need to point out is that Plan 2 doesn’t have an entry here for VoteTypeId 5. Why?
Because when it inherits the plan for VoteTypeId 6, it runs for 17 minutes.
singalong
This is probably where you’re wondering “okay, so what plan does 5 get when it runs on its own? Is this the mysterious Plan 4 From Outer Space?”
Unfortunately, the plan that gets generated for VoteTypeId 5 is… the same one that gets generated for VoteTypeId 6, but 6 has a much smaller memory grant.
Since this plan is all Batch Mode operators, each operator will track its time individually.
The Non-Switch
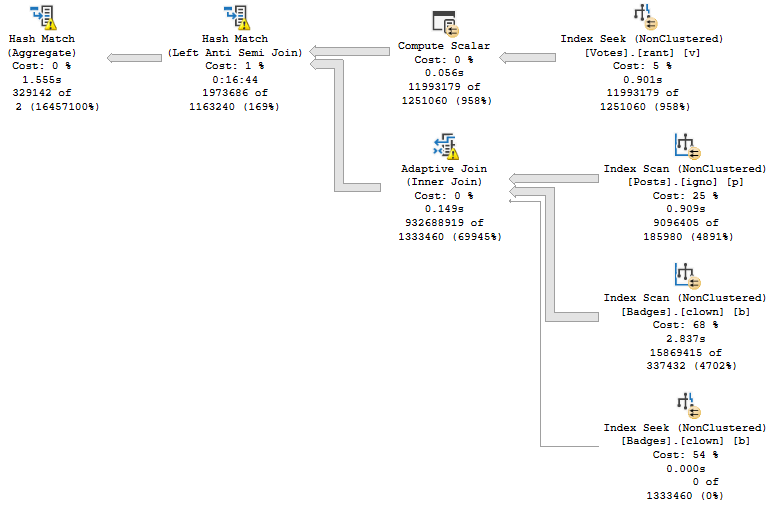
VoteTypeId 5 runtime, VoteTypeId 6 compile time
If I were to put a 17 minute runtime in the graph (>1000 seconds), it would defeat the purpose of graphing things.
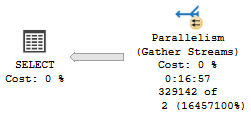
Note the Hash Match has, by itself, 16 minutes and 44 seconds of runtime.
pyramids
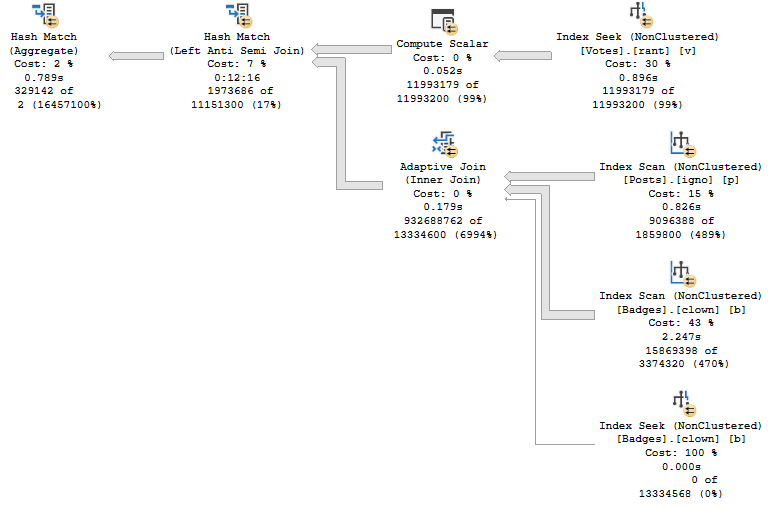
VoteTypeId 5 runtime, and compile time
This isn’t awesome, either.
The Hash Join, without spilling, has 12 minutes and 16 seconds of runtime.
lost
Big Differentsiz
You have the same plan shape and operators. Even the Adaptive Join follows the same path to hash instead of loop.
Sure, the spills account for ~4 minutes of extra time. They are fairly big spills.
But the plan for VoteTypeId 5, even when compiled specifically for VoteTypeId 5… sucks, and sucks royally.
There are some dismally bad estimates, but where do they come from?
We just created these indexes, and data isn’t magically changing on my laptop.
TUNE IN TOMORROW!
Thanks for reading
Going Further
If this is the kind of SQL Server stuff you love learning about, you’ll love my training. Blog readers get 25% off the Everything Bundle — over 100 hours of performance tuning content. Need hands-on help? I offer consulting engagements from targeted investigations to ongoing retainers. Want a quick sanity check before committing to a full engagement? Schedule a call — no commitment required.
I’ve always had trouble standing still on SQL Server versions, but most companies don’t. Hardly anyone I talk to is on SQL Server 2017, though these days SQL Server 2016 seems more common than SQL Server 2012, so at least there’s that. Mostly I’m happy to not see SQL Server 2014. God I hate SQL Server 2014.
Despite the lack of adoption, I’ve been moving all my training material to SQL Server 2019. Heck, in a few years, my old posts might come in handy for you.
But during that process, I kept running into the same problem: The demos generally still worked for the OLTP-ish queries, but for the report-ish queries Batch Mode On Rowstore (BMOR, from here) was kicking butt (most of the time anyway, we’re gonna look at some hi-jinks this week).
The problem, so far as I could tell, was that the Stack Overflow 2013 database just wasn’t enough database for SQL Server 2019 (at least with my hardware). My laptop is quad core (8 with HT) @2.9GHz, with 64GB of RAM, and max server memory set to 50GB. The SO2013 database is… just about 50GB.
While it’s fun to be able to create performance problems even with the whole database in memory, it doesn’t match what lot of people are dealing with in real life.
Dropping max server memory down is okay for the buffer pool, but SQL Server (it seems especially with column store/batch mode) is keen to use memoryabove that for other things like memory grants.
A lot of the interesting struggle I see on client servers between the buffer pool and query memory grants didn’t happen when I did that.
Using a VM with lower memory, while convenient, just didn’t seem as fun. Plus, part of the problem is that, while I make fun of other sample databases for being unrealistically tiny, at least they have relatively modern dates in some of them.
I was starting to feel really goofy having time stop on January 31st, 2013.
I suppose I could have updated all the CreationDate columns to modernize things, but who knows what that would have thrown off.
Plus, here’s a dirty little secret: all the date columns that start with “Last” that track stuff like when someone last logged in, or when a post was last active/edited, they don’t stop at 2013-12-31. They extend up to when the database was originally chopped down to size, in 2017 or so. I always found that a bit jarring, and I’d have to go and add time to them, too, to preserve the gaps.
It all starts to feel a bit like revisionist history.
The End Is Thigh
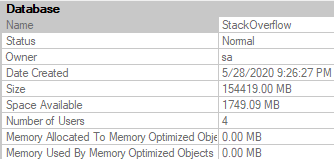
In the end, I settled on using the most recent version available here, but with a couple of the tables I don’t regularly use in demos cut out: PostHistory, and PostLinks. Once you drop those out, a 360GB database drops down to a much more manageable 150Gb or so.
The nice thing is that the general cadence of the data is the same in many ways and places, so it doesn’t take a lot to adjust demos to work here. Certain Post and Vote Types, User Ids, Reputations, etc. remain skewed, and outliers are easy to find. Plus, at 3:1 data to memory, it’s a lot harder to keep everything safely in the buffer pool.
This does present different challenges, like index create time to set up for things, database distribution, etc.
But if I can give you better demos, that seems worth it.
Plus, I hear everything is in the cloud now anyway.
Alluding To
In the process of taking old demos and seeing how they work with the new database, I discovered some interesting stuff that I want to highlight a little bit. So far as I can tell, they’re not terribly common (yet), but that’s what makes them interesting.
If you’re the kind of person who’s looking forward to SQL Server 2019’s performance features solving some problems for you auto-magick-ally, these may be things you need to watch out for, and depending on your workload they may end up being quite a bit more common than I perceive.
I’m going to be specifically focusing on how BMOR (and to some extent Adaptive Joins) can end up not solving performance issues, and how you may end up having to do some good ol’ fashion query tuning on your own.
In the next post, we’ll look at how one of my favorite demos continues to keep on giving.
Thanks for reading!
Going Further
If this is the kind of SQL Server stuff you love learning about, you’ll love my training. Blog readers get 25% off the Everything Bundle — over 100 hours of performance tuning content. Need hands-on help? I offer consulting engagements from targeted investigations to ongoing retainers. Want a quick sanity check before committing to a full engagement? Schedule a call — no commitment required.
I had a client get in touch recently because they thought they had corruption. That’s not normally my cup of tea, but I offered to jump on and take a look.
We got to talking, and they said users had been getting some nasty error messages. Stuff like this:
Msg 2745, Level 16, State 2, Procedure dbo.oh_no, Line 8 [Batch Start Line 13]
Process ID 56 has raised user error 50000, severity 20. SQL Server is terminating this process.
Msg 50000, Level 20, State 1, Procedure dbo.oh_no, Line 8 [Batch Start Line 13]
SCARY THINGS
Msg 596, Level 21, State 1, Line 13
Cannot continue the execution because the session is in the kill state.
Msg 0, Level 20, State 0, Line 13
A severe error occurred on the current command.  The results, if any, should be discarded
I don’t know if you’ve ever seen corruption error messages, but they’re… uh. Look, there’s a reason I send people to Microsoft. It’s $500 well spent.
Thankfully this was just an overzealous new developer who wanted to show people the wonders and miracles of error handling.
If you use RAISERROR with a severity level of 20 or higher, and the WITH LOG clause, it kills the connection. Without the WITH LOG CLAUSE, you won’t get a proper error, and it also wouldn’t enter a CATCH block.
CREATE OR ALTER PROCEDURE dbo.oh_no
AS
SET NOCOUNT, XACT_ABORT ON;
BEGIN

    IF 1 < 2
        BEGIN
            RAISERROR('SCARY THINGS', 20, 1) WITH LOG, NOWAIT;
        END;

END;
GO

EXEC dbo.oh_no;
GO
What you return to people can be mighty confusing. Especially if your application only shows the first error message. Ahem.
Mercy
I’d probably be worried if I started seeing that pop up, too.
Part Two
Only somewhat related to part one, but probably a good time to mention it: If you want RAISERROR to get you to a TRY/CATCH block and throw an error, you have to use a severity 16 or higher and WITH LOG. For instance, this won’t work:
CREATE OR ALTER PROCEDURE dbo.oh_yes
AS
SET NOCOUNT, XACT_ABORT ON;
BEGIN

    IF 1 < 2
        BEGIN TRY

            RAISERROR('IS THIS THING ON?', 10, 1) WITH LOG, NOWAIT;

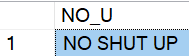
            SELECT 'NO SHUT UP' AS NO_U;

        END TRY
        BEGIN CATCH
            THROW;
        END CATCH;
END;

EXEC dbo.oh_yes;
Your code will keep right on chugging along.
Chippy
Despite the fact that an “error” was raised.
Are you German?
You need to give this old hound a higher severity (and WITH LOG) to get it to bark.
RAISERROR('IS THIS THING ON?', 16, 1) WITH LOG, NOWAIT;
Then you get it back in red.
I used to be like you.
Parting
Error handling is good for all sorts of things. You can retry deadlocks, handle and log edge cases, keep loops alive, and more.
RAISERROR is useful for figuring out where you’re at in some logic — and I know, it’s deprecated — but I find using the combination of THROW and FORMATMESSAGE tedious and cumbersome. I don’t want to add things to sys.messages. I don’t want to use two functions instead of one to pretty print some information. What’s the point?
Thanks for reading!
Going Further
If this is the kind of SQL Server stuff you love learning about, you’ll love my training. Blog readers get 25% off the Everything Bundle — over 100 hours of performance tuning content. Need hands-on help? I offer consulting engagements from targeted investigations to ongoing retainers. Want a quick sanity check before committing to a full engagement? Schedule a call — no commitment required.