There are two angles to this. One is that spools are just crappy temp tables. The mechanism used for loading data, especially into Eager Spools, is terribly inefficient, especially when compared to the various advances in tempdb efficiency over the years.
The second angle is that Eager Index Spools should provide feedback to users that there’s a potentially useful index that could be created.
There are checks for Eager Table and Index Spools in sp_BlitzCache. Heck, it’ll even unravel them and tell you which index to create in the case of Eager Index Spools.
It still bothers me that there’s no built-in tooling or warning about queries that rely on Spools. Not because the Spools themselves are necessarily bad, but because they’re usually a sign that something is deficient with the query or indexing. Spools in modification queries are often necessary and not as worthy of your scorn, but can often be substituted with manual phase separation.
You may have lots of very fast queries with small Spools in them. You may have them right now.
You may also have lots of very slow queries with Spools in them, and there’s nothing telling you about it.
Spool Building
In a perfect world, when spools are being built, they’d emit a specific wait stat. Having that information would help all of us who do performance tuning work know what to look for and focus in on during investigations.
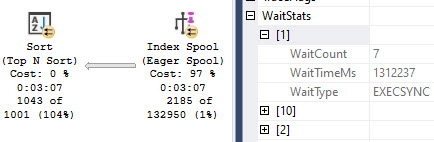
Right now you can get part of the way there by looking at EXECSYNC waits, but even that’s unreliable. They show up in parallel plans with Eager Index Spools, but they show up from other things too. Usually, your best bet is to just look for top resource consuming queries and examine the plans for Spools.
syncer
Step 1: Give us better waits to identify Spools being built
Index Building
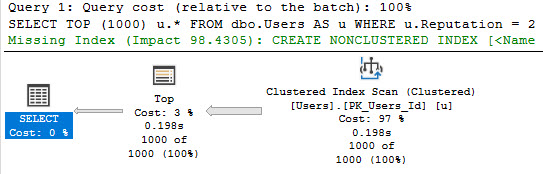
The optimizer will complain about missing indexes all the live-long day. Even in cases where an index would barely help.
banjo
I don’t know about you, but in general ~200ms isn’t a performance emergency.
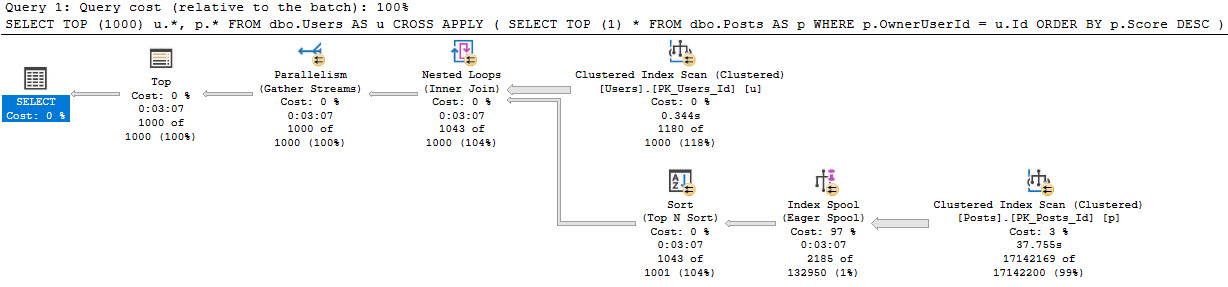
But like, three minutes?
bank account
I’d wanna know about this. I’d wanna create an index to help this query.
Step 2: Give us missing index requests when Eager Index Spools get built.
End users need better feedback when new features get turned on and performance gets worse.
Sure, if you read this blog and know what to look for, you can find and fix things quickly. But there are a whole lot of people who don’t have things that easy, and I get a lot of calls from them to fix this sort of issue.
Thanks for reading!
Going Further
If this is the kind of SQL Server stuff you love learning about, you’ll love my training. Blog readers get 25% off the Everything Bundle — over 100 hours of performance tuning content. Need hands-on help? I offer consulting engagements from targeted investigations to ongoing retainers. Want a quick sanity check before committing to a full engagement? Schedule a call — no commitment required.
Of course, I’d love if everyone lived in the same ivory tower as me and always wrote perfect queries with clear predicates that the optimizer understands and lovingly embraces.
But in the real world, out in the nitty gritty, queries are awful. It doesn’t matter if it’s un-or-under-trained developers writing SQL, or that exact same person designing queries in an ORM. They turn out horrible and full of nonsense, like drunk stomachs at IHOP.
One of the most common problems I see is people getting lazy with checking for NULLs, or overly-protective about it. In “””””real””””” programming languages, NULLs get you errors. In databases, they’re just sort of whatever.
Thing Is
When you create a row store index on a column, whether it’s ascending or descending, clustered or nonclustered, the data is put in order. In SQL Server, that means NULLs are sorted together. Despite that, ISNULL still creates problems.
DROP TABLE IF EXISTS #t;

SELECT
    x.n
INTO #t
FROM
(
SELECT
    CONVERT(int, NULL) AS n

UNION ALL

SELECT TOP (10)
    ROW_NUMBER() OVER
    (
        ORDER BY
            1/0
    ) AS n
FROM sys.messages AS m
) AS x;


CREATE UNIQUE CLUSTERED INDEX c
ON #t (n) WITH (SORT_IN_TEMPDB = ON);
In this table we have 11 rows. One of them is NULL, and the other 10 are the numbers 1-10.
Odor By
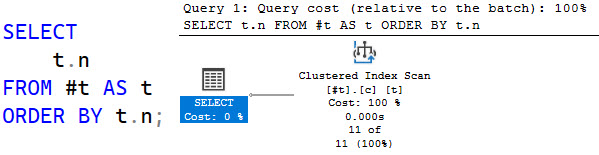
If we select an ordered result, we get a simple query plan that scans the clustered index and returns 11 rows with no Sort operator.
pleased to meet you
However, if we want to replace that NULL with a 0, things get goofy.
dammit
Wheredo
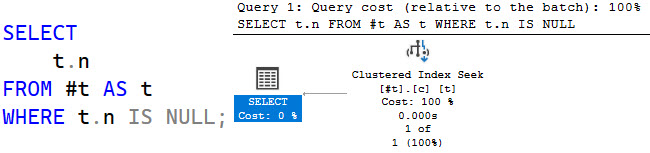
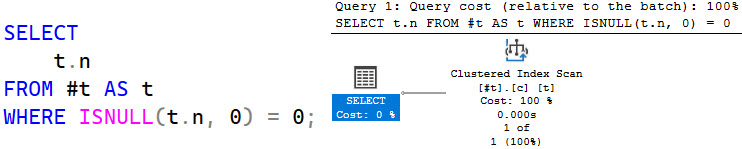
Something similar occurs when ISNULL is applied to the where clause.
happyunhappy
There’s one NULL. We know where it is. But we still have to scan 10 other rows. Just in case.
Conversion
The optimizer should be smart enough to figure out simple use of ISNULL, like in both of these cases.
I’m sure wiser people can figure out deeper cases, too, and even apply them to more functions that involve some types of date math, etc.
Thanks for reading!
Going Further
If this is the kind of SQL Server stuff you love learning about, you’ll love my training. Blog readers get 25% off the Everything Bundle — over 100 hours of performance tuning content. Need hands-on help? I offer consulting engagements from targeted investigations to ongoing retainers. Want a quick sanity check before committing to a full engagement? Schedule a call — no commitment required.
In my session on using dynamic SQL to defeat parameter sniffing, I walk through how we can use what we know statistically about data to execute slightly different queries to get drastically better query plans. What makes the situation quite frustrating is that SQL Server has the ability to do the same thing.
In fact, it does it every time it freshly compiles a plan based on parameter values. It makes a whole bunch of estimates and comes up with that it thinks is a good plan based on them.
But it sort of stops there.
Why am I talking about this now? Well, since Greatest and Least got announced for Azure SQL, it kind of got my noggin’ joggin’ that perhaps a new build of the box-product might make its way to the CTP phase soon.
I Dream Of Histograms
When SQL Server builds execution plans, the estimates (mostly) come from statistics histograms, and those histograms are generally pretty solid even with low sampling rates. I know that there are times when they miss crucial details, but that’s a different problem than the one I think could be solved here.
You see, when a plan gets generated, the entire histogram is available. It would be neat if there were a process to do one of a few things:
Mark objects with significant skew in them for additional attention
Take the VoteTypeId column in the Votes table. Lots of these values could safely share a plan. Lots of others have catastrophe in mind when plans are shared, like 2 and… well, most others.
ribbit
Sort of like how optimistic isolation levels take care of basic reader/writer blocking that sucks to deal with and leads to all those crappy NOLOCK hints. Save the hard problems for young handsome consultants.
Ahem ?
Overboard
I know, this sounds crazy-ambitious, and it could get out of hand quickly. Not to mention confusing! We’re talking about queries having multiple cached and usable plans, here. Who used what and when would be crucial information.
You’d need a lot of metadata about something like this, so you can tweak:
The number of plans
The number of buckets
Which plan is used by which buckets
Which code and parameters should be considered
I’m fine with auto-pilot for this most of the time, just to get folks out of the doldrums. Sort of like how Query Store was “good enough” with a bunch of default options, I think you’d find a lot of preconceived notions about what works best would pretty quickly be relieved of their position.
Anyway, I have a bunch of other posts about similar solvable problems. I have no idea when the next version of SQL Server will come out, or what improvements or features might be in it, but I hear that blog posts are basically wishes that come true. I figure I might as well throw some coins in the fountain.
Thanks for reading!
Going Further
If this is the kind of SQL Server stuff you love learning about, you’ll love my training. Blog readers get 25% off the Everything Bundle — over 100 hours of performance tuning content. Need hands-on help? I offer consulting engagements from targeted investigations to ongoing retainers. Want a quick sanity check before committing to a full engagement? Schedule a call — no commitment required.
I’ve written at length about what local variables do to queries, so I’m not going to go into it again here.
What I do want to talk about are better alternatives to what you currently have to do to fix issues:
RECOMPILE the query
Pass the local variable to a stored procedure
Pass the local variable to dynamic SQL
It’s not that I hate those options, they’re just tedious. Sometimes I’d like the benefit of recompiling with local variables without all the other strings that come attached to recompiling.
Hint Me Baby One More Time
Since I’m told people rely on this behavior to fix certain problems, you would probably need a few different places to and ways to alter this behavior:
Database level setting
Query Hint
Variable declaration
Database level settings are great for workloads you can’t alter, either because the queries come out of a black box, or you use an ORM and queries… come out of a nuclear disaster area.
Query hints are great if you want all local variables to be treated like parameters. But you may not want that all the time. I mean, look: you all do wacky things and you’re stuck in your ways. I’m not kink shaming here, but facts are facts.
You have to draw the line somewhere and that somewhere is always “furries”.
And then local variables.
It may also be useful to allow local variables to be declared with a special property that will allow the optimizer to treat them like parameters. Something like this would be easy enough:
DECLARE @p int PARAMETER = 1;
Hog Ground
Given that in SQL Server 2019 table variables got deferred compilation, I think this feature is doable.
Of course, it’s doable today if you’ve got a debugger and don’t mind editing memory space.
Thanks for reading!
Going Further
If this is the kind of SQL Server stuff you love learning about, you’ll love my training. Blog readers get 25% off the Everything Bundle — over 100 hours of performance tuning content. Need hands-on help? I offer consulting engagements from targeted investigations to ongoing retainers. Want a quick sanity check before committing to a full engagement? Schedule a call — no commitment required.
One line I see over and over again — I’ve probably said it too when I was young and needed words to fill space — is that CTEs make queries more readable.
Personally, I don’t think they make queries any more readable than derived tables, but whatever. No one cares what I think, anyway.
Working with clients I see a variety of query formatting styles, ranging from quite nice ones that have influenced the way I format things, to completely unformed primordial blobs. Sticking the latter into a CTE does nothing for readability even if it’s commented to heck and back.
nope nope nope
There are a number of options for formatting code:
Formatting your code nicely doesn’t just help others read it, it can also help people understand how it works.
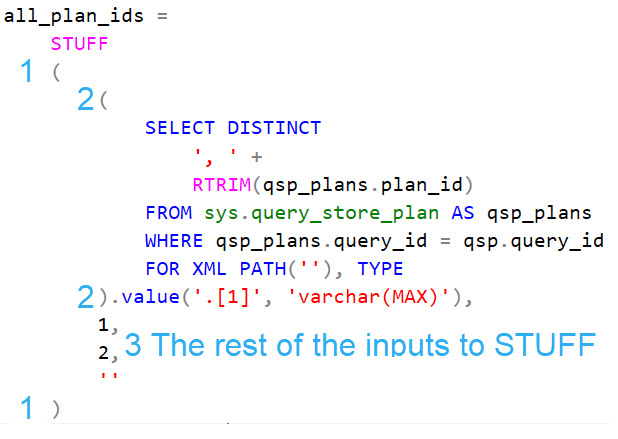
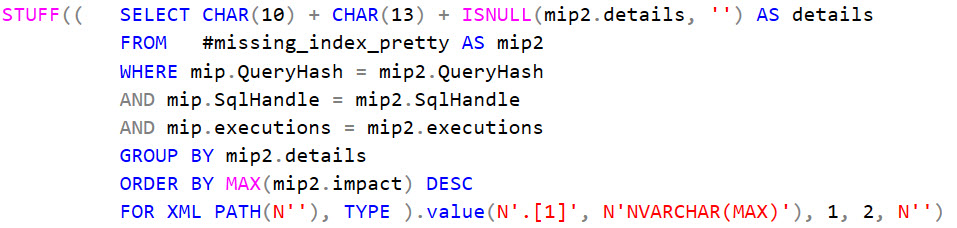
Take this example from sp_QuickieStore that uses the STUFF function to build a comma separated list the crappy way.
If STRING_AGG were available in SQL Server 2016, I’d just use that. Darn legacy software.
parens
The text I added probably made things less readable, but formatting the code this way helps me make sure I have everything right.
The opening and closing parens for the STUFF function
The first input to the function is the XML generating nonsense
The last three inputs to the STUFF function that identify the start, length, and replacement text
I’ve seen and used this specific code a million times, but it wasn’t until I formatted it this way that I understood how all the pieces lined up.
Compare that with another time I used the same code fragment in sp_BlitzCache. I wish I had formatted a lot of the stuff I wrote in there better.
carry the eleventy
With things written this way, it’s really hard to understand where things begin and end and that arguments belong to which part of the code.
Maybe someday I’ll open an issue to reformat all the FRK code ?
Thanks for reading!
Going Further
If this is the kind of SQL Server stuff you love learning about, you’ll love my training. Blog readers get 25% off the Everything Bundle — over 100 hours of performance tuning content. Need hands-on help? I offer consulting engagements from targeted investigations to ongoing retainers. Want a quick sanity check before committing to a full engagement? Schedule a call — no commitment required.
Whomever decided to give “memory bank” its moniker was wise beyond their years, or maybe they just made a very apt observation: all memory is on loan.
Even in the context we’ll be talking about, when SQL Server has lock pages in memory enabled, the pages that are locked in memory may not have permanent residency.
If your SQL Server doesn’t have enough memory, or if various workload elements are untuned, you may hit one of these scenarios:
Query Memory Grant contention (RESOURCE_SEMAPHORE)
Buffer Cache contention (PAGEIOLATCH_XX)
A mix of the two, where both are fighting over finite resources
It’s probably fair to note that not all query memory grant contention will result in RESOURCE_SEMAPHORE. There are times when you’ll have just enough queries asking for memory grants to knock a significant pages out of the plan cache to cause an over-reliance on disk without ever hitting the point where you’ve exhausted the amount of memory that SQL Server will loan out to queries.
To help you track down any of these scenarios, you can use my stored procedure sp_PressureDetector to see what’s going on with things.
Black Friday
Most servers I see have a mix of the two issues. Everyone complains about SQL Server being a memory hog without really understanding why. Likewise, many people are very proud about how fast their storage is without really understanding how much faster memory is. It’s quite common to hear someone say they they recently got a whole bunch of brand new shiny flashy storage but performance is still terrible on their server with 64GB of RAM and 1TB of data.
I recently had a client migrate some infrastructure to the cloud, and they were complaining about how queries got 3x slower. As it turned out, the queries were accruing 3x more PAGEIOLATCH waits with the same amount of memory assigned to SQL Server. Go figure.
If you’d like to see those waits in action, and how sp_PressureDetector can help you figure out which queries are causing problems, check out this video.
Market Economy
The primary driver of how much memory you need is how much control you have over the database. The less control you have, the more memory you need.
Here’s an example: One thing that steals control from you is using an ORM. When you let one translate code into queries, Really Bad Things™ can happen. Even with Perfect Indexes™ available, you can get some very strange queries and subsequently very strange query plans.
One of the best ways to take some control back isn’t even available in Standard Edition.
there are a lot of bad defaults in sql server. most of them you know about and change. here’s another bad one: pic.twitter.com/555xPmgwRW
— Erik Darling Data (@erikdarlingdata) May 8, 2021
If you do have control, the primary drivers of how much memory you need are how effective your indexes are, and how well your queries are written to take advantage of them. You can get away with less memory in general because your data footprint in the buffer pool will be a lot smaller.
You can watch a video I recorded about that here:
Thanks for reading (and watching)!
Going Further
If this is the kind of SQL Server stuff you love learning about, you’ll love my training. Blog readers get 25% off the Everything Bundle — over 100 hours of performance tuning content. Need hands-on help? I offer consulting engagements from targeted investigations to ongoing retainers. Want a quick sanity check before committing to a full engagement? Schedule a call — no commitment required.
“Wow look at all these missing index requests. Where’d they come from?”
So this is neat! And it’s better than nothing, but there are some quirks.
And what’s a quirk, after all, but a twerk that no one enjoys.
Columnar
The first thing to note about this DMV is that there are two columns purporting to have sql_handles in them. No, not thatsql_handle.
One of them can’t be used in the traditional way to retrieve query text. If you try to use last_statement_sql_handle, you’ll get an error.
SELECT
    ddmigsq.group_handle,
    ddmigsq.query_hash,
    ddmigsq.query_plan_hash,
    ddmigsq.avg_total_user_cost,
    ddmigsq.avg_user_impact,
    query_text =
        SUBSTRING
        (
            dest.text,
            (ddmigsq.last_statement_start_offset / 2) + 1,
            (
                (
                    CASE ddmigsq.last_statement_end_offset
                        WHEN -1
                        THEN DATALENGTH(dest.text)
                        ELSE ddmigsq.last_statement_end_offset
                    END
                    - ddmigsq.last_statement_start_offset
                ) / 2
            ) + 1
        )
FROM sys.dm_db_missing_index_group_stats_query AS ddmigsq
CROSS APPLY sys.dm_exec_sql_text(ddmigsq.last_statement_sql_handle) AS dest;
Msg 12413, Level 16, State 1, Line 27
Cannot process statement SQL handle. Try querying the sys.query_store_query_text view instead.
Is Vic There?
One other “issue” with the view is that entries are evicted from it if they’re evicted from the plan cache. That means that queries with recompile hints may never produce an entry in the table.
Is this the end of the world? No, and it’s not the only index-related DMV that behaves this way: dm_db_index_usage_stats does something similar with regard to cached plans.
SELECT
    COUNT_BIG(*)
FROM dbo.Posts AS p
WHERE p.OwnerUserId = 22656
AND   p.Score < 0;
GO

SELECT
    COUNT_BIG(*)
FROM dbo.Posts AS p
WHERE p.OwnerUserId = 22656
AND   p.Score < 0
OPTION(RECOMPILE);
GO
grizzly
Italic Stallion
You may have noticed that may was italicized in when talking about whether or not plans with recompile hints would end up in here.
Some of them may, if they’re part of a larger batch. Here’s an example:
SELECT
    COUNT_BIG(*)
FROM dbo.Posts AS p
WHERE p.OwnerUserId = 22656
AND   p.Score < 0
OPTION(RECOMPILE);

SELECT
    COUNT_BIG(*)
FROM dbo.Users AS u
JOIN dbo.Posts AS p
   ON p.OwnerUserId = u.Id
JOIN dbo.Comments AS c
    ON c.PostId = p.Id
WHERE u.Reputation = 1
AND   p.PostTypeId = 3
AND   c.Score = 0;
Most curiously, if I run that batch twice, the missing index request for the recompile plan shows two uses.
computer
Multiplicity
You may have also noticed something odd in the above screenshot, too. One query has produced three entries. That’s because…
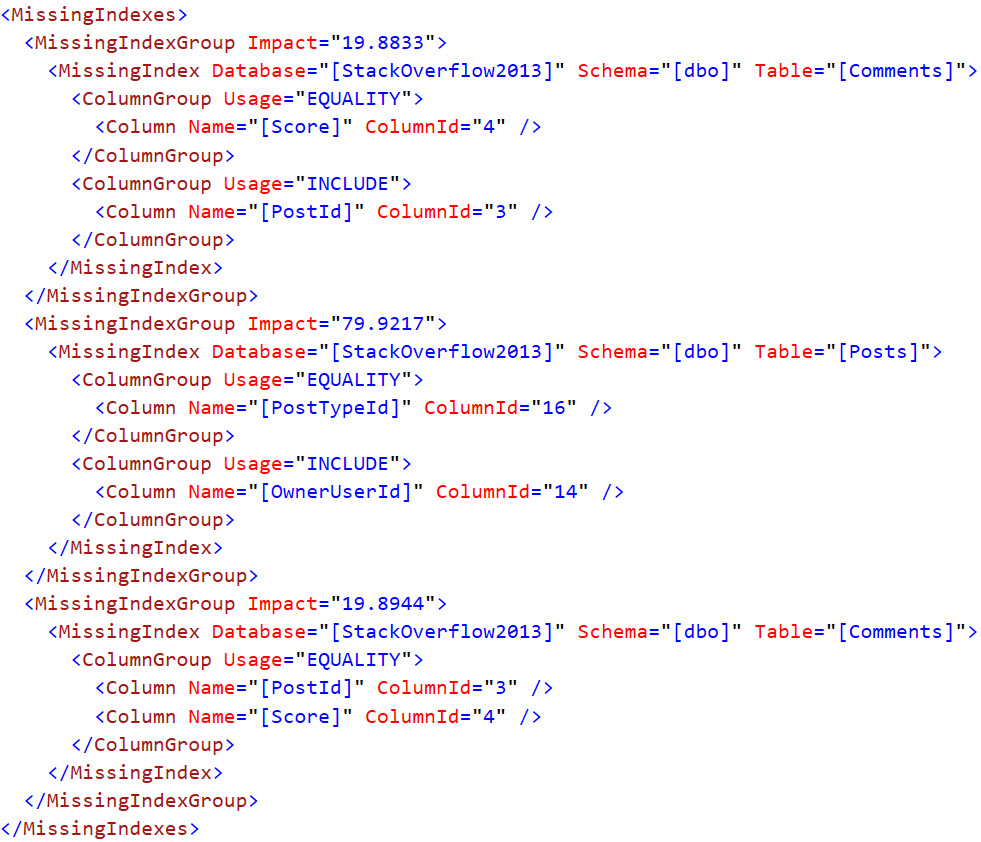
The query has three missing index requests. Go ahead and click on that.
lovecraft, baby
Another longstanding gripe with SSMS is that it only shows you the first missing index request in green text, and that it might not even be the “most impactful” one.
That’s the case here, just in case you were wondering. Neither the XML, nor the SSMS presentation of it, attempt to order the missing indexes by potential value.
You can use the properties of the execution plan to view all missing index requests, like I blogged about here, but you can’t script them out easily like you can for the green text request at the top of the query plan.
something else
At least this way, it’s a whole heck of a lot easier for you to order them in a way that may be more beneficial.
EZPZ
Of course, I don’t expect you to write your own queries to handle this. If you’re the type of person who enjoys Blitzing things, you can find the new 2019 goodness in sp_BlitzIndex, and you can find all the missing index requests for a single query in sp_BlitzCache in a handy-dandy clickable column that scripts out the create statements for you.
Thanks for reading!
Going Further
If this is the kind of SQL Server stuff you love learning about, you’ll love my training. Blog readers get 25% off the Everything Bundle — over 100 hours of performance tuning content. Need hands-on help? I offer consulting engagements from targeted investigations to ongoing retainers. Want a quick sanity check before committing to a full engagement? Schedule a call — no commitment required.
I see people do things like this fairly often with UDFs. I don’t know why. It’s almost like they read a list of best practices and decided the opposite was better.
This is a quite simplified function, but it’s enough to show the bug behavior.
While writing this, I learned that you can’t create a recursive (self-referencing) scalar UDF with the schemabinding option. I don’t know why that is either.
Please note that this behavior has been reported to Microsoft and will be fixed in a future update, though I’m not sure which one.
Swallowing Flies
Let’s take this thing. Let’s take this thing and throw it directly in the trash where it belongs.
CREATE OR ALTER FUNCTION dbo.how_high
(
    @i int,
    @h int
)
RETURNS int
WITH
    RETURNS NULL ON NULL INPUT
AS
BEGIN

    SELECT
       @i += 1;

    IF @i < @h
    BEGIN
        SET
            @i = dbo.how_high(@i, @h);
    END;

    RETURN @i;

END;
GO
Seriously. You’re asking for a bad time. Don’t do things like this.
Unless you want to pay me to fix them later.
Froided
In SQL Server 2019, under compatibility level 150, this is what the behavior looks like currently:
/*
Works
*/
SELECT
    dbo.how_high(0, 36) AS how_high;
GO

/*
Fails
*/
SELECT
    dbo.how_high(0, 37) AS how_high;
GO
The first execution returns 36 as the final result, and the second query fails with this message:
Msg 217, Level 16, State 1, Line 40
Maximum stored procedure, function, trigger, or view nesting level exceeded (limit 32).
A bit odd that it took 37 loops to exceed the nesting limit of 32.
This is the bug.
Olded
With UDF inlining disabled, a more obvious number of loops is necessary to encounter the error.
/*
Works
*/
SELECT
    dbo.how_high(0, 32) AS how_high
OPTION (USE HINT('DISABLE_TSQL_SCALAR_UDF_INLINING'));
GO

/*
Fails
*/
SELECT
    dbo.how_high(0, 33) AS how_high
OPTION (USE HINT('DISABLE_TSQL_SCALAR_UDF_INLINING'));
GO
The first run returns 32, and the second run errors out with the same error message as above.
Does It Matter?
It’s a bit hard to imagine someone relying on that behavior, but I found it interesting enough to ask some of the nice folks at Microsoft about, and they confirmed that it shouldn’t happen. Again, it’ll get fixed, but I’m not sure when.
Thanks for reading!
Going Further
If this is the kind of SQL Server stuff you love learning about, you’ll love my training. Blog readers get 25% off the Everything Bundle — over 100 hours of performance tuning content. Need hands-on help? I offer consulting engagements from targeted investigations to ongoing retainers. Want a quick sanity check before committing to a full engagement? Schedule a call — no commitment required.
In this video, I share my latest improvements to the SP_to_the_Underline_QuickieStore stored procedure for performance troubleshooting in SQL Server. After realizing that navigating through the initial version was cumbersome and required jumping around between tables and XML data, I decided to streamline the process. By formatting query information into XML and displaying it directly after fetching query plans, users can now easily identify slow queries without having to hunt through multiple lines of code or confusing table structures. This update makes troubleshooting much more efficient, allowing for quicker identification and resolution of performance issues in your databases.
Full Transcript
Erik Darling here with Erik Darling Data. And it would figure that as soon as I thought I had closed the book on the initial round of coding for SP to the underscore, what’s it called? Quickie store? Something like that? At least it rhymes so I can remember. I had these like, like, like epiphanies last night. He’s like, Joan of Arc visited me and hit me with a sword and said, do better. Because I was going through the video yesterday about, like, the performance troubleshooting bits.
I was like, ah, it’s a little clunky because you’ve got to look down at this table and see what was slow and then go up here and figure out where it was slow. And I was like, man, that sucks. Like, if I had to do that, I wouldn’t want to do it. I’d be demoralized. I wouldn’t want to deal with that. It’s stupid. It’s dumb.
Dumb. So what did I do to make things better? Well, I think, I think I made things better anyway. The good news is you no longer have to jump around on your screen in order to figure out what was slow and then hunt and peck through a million lines of XML to figure out what was slow.
And I’ll show you how I did that. Wonderful magic trick. So if you’re a troubleshooting performance and you use a troubleshoot performance parameter, you’re going to get some different, a different layout of your information back.
All right. So looking down here, we still create a temp table to hold data about what we did, right? We still have a temp table that holds the current table data, the start time, end time, and then the formatted runtime in milliseconds. So if we have something that runs for over a thousand milliseconds or one second, then we will put some commas in to make numbers a little bit more readable.
And then if we go in a little bit further, this is the change I made that I think makes things a lot better for everybody. If we go down here, what I’m doing instead of dumping stuff into a table and making you deal with it and jump around is I am formatting the information about the query in the runtime into XML. And I’m going to display that to you right after we get the query plans for whatever executed.
So you can see what I’m doing in here is I am hitting that. So what you’ll see in a minute, but it’s going to be after we update the troubleshoot performance table to get information. I’m going to pull data from there based on what the current table situation is. So we’ll get the runtime, the current table, the length of the SQL, and then the statement text of the SQL that just ran.
If you go down a little bit further, just to show you where this happens, and this will happen for every single block too. So we’re going to execute that SQL to generate that XML and just select it. Right. So that’s what I did.
And I think we’re working out pretty well so far. But if we run SP to the underscore quickie store and we see what comes back, it’s a lot cleaner to deal with the performance, any potential performance issues. Granted, there aren’t any here because, again, I keep my query store tight and light.
But in your query store implementations where you have hundreds of thousands of rows, maybe this might be a lot might look a lot different performance wise. So it’s still not perfect because I still can’t separate the insert query from the dynamic SQL select in some cases. So in some instances, you’re going to see the XML for the query that ran.
Right. It’s going to be this. And then right below that, you’re going to see this current query line. And if you click on current query, we’re going to see the milliseconds runtime.
We’re going to see the current table. That’s the process that we’re currently executing. And then we’re going to have the full statement text for that. And the reason I did this is because I wanted it to be a little bit easier to figure out what was slow and where in the XML, like where the query plan for the slow thing is.
Now, where this still isn’t perfect is in cases where I use dynamic SQL to insert into a temp table. So in some cases like this one right here, you might see query plan, query plan, current query. And current query is going to be this insert.
So you can see in this insert, we are selecting a distinct group of plan IDs from query store plan. And we are selecting stuff that is not like this, you know, crappy maintenance stuff. But then if we look at the query plan directly above that, it’s just going to be this insert that didn’t really look like it did much of anything.
Right. We don’t even see the table that we hit in there. But if we look at the query plan just above that, that’s where we’re going to see that we hit the table that looks at where that holds the query text that we were filtering against. So in some cases, you will still have to do a little bit of noggin thinking.
And if you see a current query that took an amount of time that is alarming to you, then you would have to like, you know, skip one and then go up to the one right below the previous one. So that’s what that’s where it is so far. You know, it’s probably about as good as I’m going to get it because I can’t think of a good way to not get the query plan for the insert, not have like the double query plan.
But hopefully you won’t run into so many performance issues that you have to deal with this all that often. But this this is pretty reliable. And if we go all the way down to, you know, I think some of the larger queries, we’ll still get the full query text in there.
And so this is, you know, at least I think a pretty decent way to get you, you know, have you be able to see very quickly the runtime in milliseconds for whatever query. So if you see like some big number right here, then you know, oh, I’m just going to go take a look at that. And then you can look at what ran and you can say, oh, I guess that was slow.
And then, you know, go get the query plan for it and tell me how to performance tune things, because apparently I’m such a bad performance tuner that I have to build all this performance tuning apparatus into my store procedures so that I can troubleshoot performance on them. I guess I guess I’m just that goofy. Sorry about that.
Anyway, that is the new and improved performance troubleshooting for SP to the underscore quickie sore. And I don’t know, I hope you think it’s at least interesting, even if you never have to use it or deal with it and all that others. I don’t know.
It’s fun, isn’t it fun? Fun to do things. Have fun doing nice things for people. I don’t know. Maybe you’ll take this and build some performance troubleshooting framework for your own store procedures where where where things actually matter.
And you can say, thanks, Eric, darling. Thanks for. Thanks for that awesome idea.
All right. It’s bye. That’s enough. You know, just goofy stuff. OK.
Going Further
If this is the kind of SQL Server stuff you love learning about, you’ll love my training. Blog readers get 25% off the Everything Bundle — over 100 hours of performance tuning content. Need hands-on help? I offer consulting engagements from targeted investigations to ongoing retainers. Want a quick sanity check before committing to a full engagement? Schedule a call — no commitment required.
In this video, I delve into implementing verbose debugging for stored procedures that are intended for public use. The goal is to provide users with comprehensive information so they can either file high-quality issues on GitHub or troubleshoot and potentially fix the code themselves if needed. To achieve this, I’ve introduced a `parameter debug` feature that prints out the length of every SQL string and the actual string itself before execution, ensuring any errors are caught and easily traceable. This helps in verifying the exact SQL commands run during procedure execution, making it easier to identify issues or optimize queries. Additionally, the debugging output includes all input parameters, internal procedure states, and relevant metadata like database collation and engine version, providing a detailed snapshot of how the stored procedure operates under different conditions.
Full Transcript
It was a dark and stormy night. Yeah, so here is the video, hopefully, maybe, I don’t know, the last video in the series that I’m doing, maybe? Who knows? Only the future, only time will tell, only the future knows, but the past has not yet forgotten. Shut up. Anyway, we’re talking about, implementing debugging in store procedures. And for store procedures like this, where they are not just for me, but for the sort of general public’s consumption, I want really, really verbose debugging. I want people to get as much information back so that if they need to open up an issue on GitHub, they have a lot of information at their disposable, at their disposable, brain dead, at their disposable about what happened, where, where it happened, and so they can file higher quality issues for me to work on. Or maybe they can say, you gave me so much good information back. Gosh darn it, Eric. I love you. I want, I want to kiss you. But more importantly, I want to fix this code myself. So, great. How do we do that? Well, we have this parameter debug, which unfortunately does not take the bugs out, but it helps you find the bugs.
And the way this, and the way this works. And the way this generally works, if we scroll on down, is when you have debug enabled, the, one of the most important things that happens is that we, what I print out is the length of every SQL string, and then the SQL string prior to it executing so that if it throws an error, we will catch the last thing that threw an error, right? We have that, we have that here, and then we have that in the throw. So, this is maybe a little redundant, but I’m okay with a little redundancy here because people aren’t going to be running this in debug mode constantly. So, the reason why I do this is because, um, uh, for every SQL string that runs, I want you to make sure or be able to verify that the entire string prints here. Uh, I’ll show you an example down a little bit lower of how I handle printing one of the slightly longer strings in the store procedure, but I want you to understand if the whole string is printed on the screen, you can probably eyeball that a little bit, and then, uh, see what exactly the string was. So, that’s most of what debug does, is print out dynamic SQL strings.
Uh, if you go down a little bit further, I believe that’s here. Uh, uh, for this particular SQL string, it is, uh, longer than the 4,000 characters allowed, uh, or whatever. I don’t know. I just, sort of semi-arbitrary. Uh, I, I can never quite figure out exactly how long print strings are allowed to be. I’m not, just not that good at databases, or at least this stuff. And so, I print out, uh, a substring of the first 4,000 characters, and then a substring of the second 4,000 characters. This can get a little confusing because sometimes you will have a line break, probably where you shouldn’t see one, and it might look a little funny. But, uh, whatever. That’s pretty easy to deal with.
Okay. So, we print strings out. We print out dynamic SQL. We print out the length of the string so that you can figure out how long the string is, and you can go and, you know, see if you need to, you need to fix something with the way that strings are concatenated together, or something like that. Maybe whatever. Bah, bah, bah. When we get down to the final debug section, the stuff that I return to you is, uh, first, uh, all the parameters available for the store procedure. Right. So, uh, I identify those as procedure parameters, and everything that got passed in, uh, I will print out here, uh, you know, show you exactly how things looked, um, you know, all this stuff, uh, the version and version date, so that if you need to, uh, file an issue or whatever, like, something like that, you have that stuff available to you right there.
Uh, next, uh, declared parameters. And I think this is probably the more important section because this shows you how some of the stuff that I do internally in the procedure ran and sort of, uh, how it resolved. So, stuff like whether or not you’re on Azure, what engine version you’re using, the product version, how the database ID turned out, what the database and procedure name look like when they’re quoted, the collation of the database, the length of SQL, the parameters, all this other stuff. So, this is good, helpful information to have, uh, when things run. Now, the next thing that shows up is, uh, uh, this is, this was probably the most repetitive code that I’ve ever written in my life, but it seemed useful.
Um, and the reason it seemed useful is because, wow, it is pouring rain. Uh, the reason it seemed useful is because, uh, usually I would just say, uh, this, right? I would just say, at the end of the store procedure, if we’re in debug mode, select this stuff. The problem is, if data doesn’t end up in these tables, then all you get is an empty select back. You don’t get the table name back if there are no rows here. And that can be kind of confusing and hard to figure out exactly where things showed up or didn’t show up.
So, what I do is, I make sure that data shows up in, in these tables. Then, if it does, I select from them. And if it doesn’t, I say, that table was empty. So, you get an alternative string where it just prints out, uh, that the table was empty if it was empty. And I do that for every single, I think every single table in the store procedure. I, if I’m, I’m, I, there are so many, I may have missed one or two, but if I think I got all of them, um, at least I made a checklist and went through all of them and, uh, did all that.
So, that was nice of me. It was responsible of me. Uh, so, yeah, uh, we do, we do that. And then, uh, one thing, uh, just to show you kind of what those results end up looking like. We’ll run this, which I think we’ve seen in the last video. Uh, but what we’ll get back is, uh, sort of a regular set of output up here. Uh, we’ll get back this sort of, um, semi-helpful, uh, support. How to get help, how to troubleshoot performance, how to debug things, blah, blah, blah. Uh, and all that good stuff. Um, if you debug, the first thing you get back is procedure parameters.
So, this is all the stuff that we passed into the store procedure, right? Uh, this will show us nulls for where we had nulls and expert modes and formats and all this other stuff. And there, and then declared parameters, which will show us things that we figured out while, during the course of the store procedure running. So, we know we’re not in Azure. Uh, our engine version is three, which I think is enterprise slash developer. Uh, product version is 15. The database ID that we went after was five, and that should correlate to stack overflow.
Uh, we see the unfortunate collation of my database. Um, uh, we, you know, just a whole bunch of stuff, right? Things that we got, things that we did during here, right? All right. Useful, helpful stuff. Then a little bit lower, we’ll have, uh, the temp table stuff. So, you know, the plans that we worked on, uh, we didn’t look for, uh, plans associated with any specific store procedure. So, we, uh, don’t have that anything in that table. Uh, we did look for some specific plan IDs. So, we had them in that table. Uh, you know, we had some other empty temp tables just based on things that we didn’t search for.
Um, one thing that I, I don’t know, I didn’t really highlight this in any of the other videos, but, uh, one thing that I do, one thing that used to always frustrate the hell out of me when I was working with Query Store is that, um, uh, it would pull back query plans for, uh, create or alter index. And it would pull back query plans for create or update statistics, which I always found weird. Uh, and so I have some filters in there to automatically to screen those plans out because how the hell are you going to troubleshoot that? How are you going to get performance tune that? It’s useless to you. Who cares? Stop logging that. Dimwitted.
Uh, so after that, we get back all the stuff that we filled in. Uh, then we can see, you know, um, you know, a little bit repetitive, but, you know, we’ll see the options we had for Query Store, the query plans that we pulled, the query plans that we got from Query Store plan, the query text that we got, or sorry, the query information that we got from Query Store query, the query text that we got from Query Store text. Uh, you know, at some point I go out and try to figure out if there’s additional information in the plan cache about anything that ran. Usually isn’t because the plan cache is an unreliable memory pressured piece of crap, but whatever. Deal with it some other way. Uh, stuff from runtime stats and stuff from Query Store stats. And I think that should just, oh yeah, context settings. Last but not least, pulling up the rare context settings. So, uh, you know, pretty verbose output. It should be enough to get you going in here, uh, and, uh, help you figure out, uh, what might have gone wrong in where, if I’m doing something wrong, if I have something logically wrong in the procedure, there’s all sorts of stuff for you to, uh, help me help you, um, get things to the right place.
That is if you hit any errors, but I don’t know. I’m pretty confident that things are okay in there, which means things are going to break spectacularly, but I am at least fairly confident for now that, uh, whatever. I don’t know. Figure it out. Figure it out eventually. Anyway, uh, that was the last of the code review videos that I had lined up for now. Uh, if there’s anything that, uh, you would like to see, uh, feel free to leave a comment. If there’s anything that you are more interested, interested in learning more about, uh, I don’t know.
You could, I can record another video or answer your questions on GitHub or whatever it is, but, uh, I don’t know. That’s about it for me this time. Uh, everyone go back to enjoying whatever you’re doing. I’m going to hopefully be still on vacation and, uh, I will see you in another video sometime else. I should just go now. I feel unwell. All right. Goodbye.
Going Further
If this is the kind of SQL Server stuff you love learning about, you’ll love my training. Blog readers get 25% off the Everything Bundle — over 100 hours of performance tuning content. Need hands-on help? I offer consulting engagements from targeted investigations to ongoing retainers. Want a quick sanity check before committing to a full engagement? Schedule a call — no commitment required.