Of the new things in SQL Server 2019 that I plan on presenting about, the Batch Mode on Row Store (BMOR, from here) enhancements are probably the most interesting from a query tuning point of view.
The thing with BMOR is that it’s not just one thing. Getting Batch Mode also allows Adaptive Joins and Memory Grant Feedback to kick in.
But they’re all separate heuristics.
Getting Batch Mode
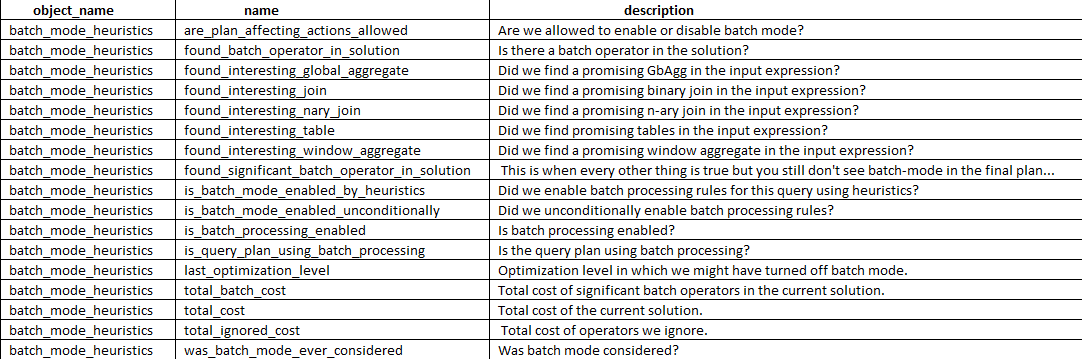
To get Batch Mode to kick in for a Row Store query, it has to pass a certain set of heuristics, which can be viewed in Extended Events.
SELECT dxoc.object_name, dxoc.name, dxoc.description
FROM sys.dm_xe_object_columns AS dxoc
JOIN sys.dm_xe_objects AS dxo
    ON  dxo.package_guid = dxoc.object_package_guid
    AND dxo.name = dxoc.object_name
WHERE dxo.name = 'batch_mode_heuristics' AND dxoc.column_type = 'data'
ORDER BY dxoc.name;
Once we’ve got Batch Mode, we can use the other stuff. But they have their own jim-jams.
Getting Adaptive Joins
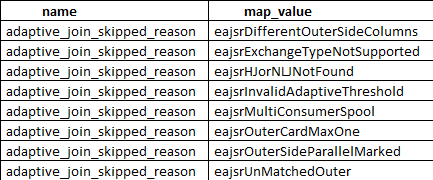
To get Adaptive Joins, you need to pass these heuristics.
SELECT dxmv.name,
       dxmv.map_value,
       dxo.description
FROM sys.dm_xe_map_values AS dxmv
    JOIN sys.dm_xe_objects AS dxo
        ON dxmv.object_package_guid = dxo.package_guid
           AND dxmv.name = dxo.name
WHERE dxmv.name = 'adaptive_join_skipped_reason';
Try refreshing
No, those aren’t plain English, but you can decode most of them. They mostly deal with index matching, and cardinality making sense to go down this route.
For excessive grants, if the granted memory is more than two times the size of the actual used memory, memory grant feedback will recalculate the memory grant and update the cached plan. Plans with memory grants under 1MB will not be recalculated for overages.
For insufficiently sized memory grants that result in a spill to disk for batch mode operators, memory grant feedback will trigger a recalculation of the memory grant. Spill events are reported to memory grant feedback and can be surfaced via the spilling_report_to_memory_grant_feedback XEvent event. This event returns the node id from the plan and spilled data size of that node.
We can still see some stuff, though.
SELECT dxoc.object_name,
       dxoc.name,
       dxoc.description
FROM sys.dm_xe_object_columns AS dxoc
JOIN sys.dm_xe_objects AS dxo
ON dxo.package_guid = dxoc.object_package_guid
AND dxo.name = dxoc.object_name
WHERE dxo.name = 'memory_grant_feedback_loop_disabled'
AND dxoc.column_type = 'data'

UNION ALL

SELECT dxoc.object_name,
       dxoc.name,
       dxoc.description
FROM sys.dm_xe_object_columns AS dxoc
JOIN sys.dm_xe_objects AS dxo
ON dxo.package_guid = dxoc.object_package_guid
AND dxo.name = dxoc.object_name
WHERE dxo.name = 'memory_grant_updated_by_feedback'
AND dxoc.column_type = 'data'
ORDER BY dxoc.name;
Leeches
Getting All Three
In SQL Server 2019, you may see plans with Batch Mode operators happening for Row Store indexes, but you may not get an Adaptive Join, or Memory Grant Feedback. If you have a lot of single-use plans, you’ll never see them getting Memory Grant Feedback (I mean, they might, but it won’t matter because there won’t be a second execution, ha ha ha).
It’s important to remember that this isn’t all just one feature, but a family of them for improving query performance for specific scenarios.
If this is the kind of SQL Server stuff you love learning about, you’ll love my training. Blog readers get 25% off the Everything Bundle — over 100 hours of performance tuning content. Need hands-on help? I offer consulting engagements from targeted investigations to ongoing retainers. Want a quick sanity check before committing to a full engagement? Schedule a call — no commitment required.
In this video, I dive into the world of cursors and explore why my favorite cursor option is the local static cursor. Despite some contention in the SQL community about which cursor options are best, I share one compelling reason for preferring local static cursors over others like the fast forward cursor. I explain how using a fast forward cursor can force your entire query to run serially, leading to suboptimal performance. By contrast, a local static cursor allows for parallel execution, significantly improving query performance in certain scenarios. The video also covers the importance of testing different cursor options and understanding their impact on execution plans and performance metrics.
Full Transcript
This is still just plain black coffee and I’m having a tough time with that this morning. I’m recording video number two today on this cold, chilly, rainy day. Brrr, day where it sure would be nice to have a heaping helping of some Lafroig or Lagavulin or Ardbeg in a fellas coffee cup. Sure would be nice. Ah, boy. So I want to talk about my favorite cursor options. I know that there is some contention.
I almost knocked my coffee over because I’m apparently too sober to function. So there is some contention about what the best cursor options are and why. And you should always use this and never use this. And I’m going to throw my hat in the ring.
And my favorite cursor options are local static. And there are very smart people out there like Erlend Somerskog who agree with me. And I’m going to show you one of my reasons why I like the local static cursor better than other cursor types. But first, we have to go look at that other cursor type.
So this is a type of cursor that a lot of people will tell you to use a local fast forward cursor. And if you look at the documentation for cursor options, you’ll see that fast forward has some optimizations. Optimizations.
What those optimizations are, we don’t know. I don’t know. I don’t think they’re documented. But one optimization about fast forward cursors that I heartily dislike is that when you run them, much like many other things in SQL Server, like inline scalar, non-valued functions, non-inlined scalar valued functions, modifying table variables, reading from multi-statement table valued function table variables, accessing some system views, blah, blah, blah, blah, blah, will force your entire query to run serially.
Let’s go take a look. So with the fast forward cursor in place, we can see that this query plan up here is entirely serial. And it runs for just about 11 and a half seconds. If I go look at the properties of this open cursor, right?
Something again, I think I say this in a lot of videos when I’m talking about execution plans. One should always be looking at the properties window when they are looking at query plans. There is so much good, rich, detailed information in there about what is going on with your query.
Without it, you would be lost. Sad babe in the woods. We can see immediately that there is a non-parallel plan reason. Now, why none of these things have spaces in them is beyond, is a little bit beyond me.
I’m not quite sure why. You know, I understand that sometimes space bars stop working. You could probably just ask Microsoft’s IT department for a new one.
They probably have some spares sitting around. But anyway, we have a non-parallel plan reason that says no parallel fast forward cursor, which is a bit of a departure from most non-parallel plan reasons.
Most of the time when you see a non-parallel plan reason, it will either say maxed offset to one or could not generate valid parallel plan. And could not generate valid parallel plan is an umbrella for a lot of things that we cannot have query parallelism for.
Now, am I saying that parallel queries should always be used or that they are the best or that you should always strive to have a parallel query? No. No, of course not. And if we’re being honest about the query that’s running, there are probably some indexes that would help this thing run a lot faster, where you wouldn’t notice a difference in the type of cursor that you are using.
But not everyone is in a position where they can, you know, change indexes or, you know, tune queries or tune logic or any of that other stuff. And you might have a big honking crazy query that drives the initial result set of the cursor you’re going to use. And you might not have too many options for tuning that.
This is one thing where changing the cursor option can help you a little bit. So this query takes 11 and a half seconds when it runs serially with the local and fast forward options assigned to the cursor. But over here we have a query or we have a cursor.
We have a… With my favorite cursor options, local static. And when we look at the query plan for local static, we can see that we do not have the same parallelism inhibitor going on that we did in the fast forward plan.
We actually have parallel, parallel, parallel, parallel up until we gather streams here. And this runs for about 2 point… Well, let’s be fair.
About 2.8 seconds. So we got about 12 seconds versus about 3 seconds. Right? Okay. So about a 9 second difference in the query that drives the initial population of the cursor temp table doodad thingy. So, kinda nice that you can…
You should be careful with your cursors and all that. And, you know… I think…
I think cursors are a bit inevitable in some cases. And, you know… Well, you know, some people might watch this video and hiss because I’m talking about ways to tune a cursor rather than just getting rid of the cursor. Well, I mean, like, you know, what if I was going to take the results of this cursor?
What if I was going to take ID, display name, and score? And what if I was going to feed those into a stored procedure and I was going to have to run that stored procedure over a whole bunch of rows? Like, how else am I really going to do that?
If I write a while loop, is it going to make a difference in how I call a stored procedure? If I dump those rows into a temp table, is it really going to be all that different than if I use a cursor to populate a static temporary object? No.
It’s not going to be all that different. So, you know, well, a lot of people will get mad about the cursor in general. And I understand why because there are some very bad uses for cursors. And, you know, I see them and I got to help people with those kind of performance problems pretty often.
But, you know, if I had the choice between spending a long time tuning a cursor query and just changing the cursor option and, you know, saving nine seconds right off the bat, you know, if I’m in a hustle, if I’m trying to like, you know, really get some stuff done, I might just go with the different cursor options to move things along. Maybe get to something else that’s, you know, a performance bump in the night for something I’m trying to tune.
Anyway, the moral of the story is don’t use cursors if you don’t have to. But if you have to or if you’re stuck with them for some other reason, choose a cursor. Look at your cursor options carefully.
Don’t just jump right to the fast forward cursor. It can, you know, do some do some performance testing, you know, run the run the query inside the cursor and see how it goes. And then then run the query inside the cursor and see if see if you get the same execution plan.
See if you get the same time, the same performance metrics, because, you know, if you run the query, then, you know, you don’t use outside of the cursor and you get a nice parallel plan and everything’s fast. And then you put it in the cursor and it takes 20 minutes, you’re gonna be like, oh, this damn cursor. But it’s you. It’s your fault. You chose the wrong cursor options.
Don’t blame the cursor. Blame the you. That’s it. Anyway, I’m gonna go now. I’m going to go invest in Scotland and have a nice day. So, thanks for watching. I hope you I hope you learned something.
I hope that you enjoyed yourself. Maybe. And I will see you in another video. Maybe even another one today.
I don’t know. I don’t know where I don’t know where today may take me in. And if I’m feeling proper Scottish, I might I might feel very record-y today. I don’t know. We’ll see. It’s a surprise for everyone.
Anyway. Thank you. And I will see you in another video where maybe I’ll still be able to stand up. Goodbye.
Going Further
If this is the kind of SQL Server stuff you love learning about, you’ll love my training. Blog readers get 25% off the Everything Bundle — over 100 hours of performance tuning content. Need hands-on help? I offer consulting engagements from targeted investigations to ongoing retainers. Want a quick sanity check before committing to a full engagement? Schedule a call — no commitment required.
This is an okay trick to keep in mind when you need to use order by on a large table.
Of course, we care about order by for many very good reasons, especially when we don’t have an index to support the ordering.
Sorting data requires memory, and Sort operators particularly may ask for quite a bit of memory.
Why? Because you need to sort all the columns you’re selecting by the column you’re ordering by.
Sorts aren’t just for the column(s) in your order by — if you SELECT *, you need order to all the columns in the * by all the columns in the order by.
I know I basically repeated myself. That’s for emphasis. It’s something professional writers do.
Dig it.
Butheywhatabout
Let’s say, just for kicks, that we have a table in our database. And maybe it has a column called something like “Id” in it.
Pushing this tale further into glory, let’s also assume that this legendary “Id” column is the primary key and clustered index.
That means we have the entire table sorted by this one column. Cool.
Tighten those wood screws, because we’re about to go cat 5 here. Ready?
There’s a date or date time column in the table — let’s say it defines when the row was first inserted into the table.
It could be a creation date, or an order date. Doesn’t matter.
What does matter? That the “Id” and the “*Date” column increment at the same time, which means that they’re in the same order.
It may suit your queries better to order by the clustered index key column rather than another column in the table which may not be in a helpful index in a helpful order for you query.
Too Sort
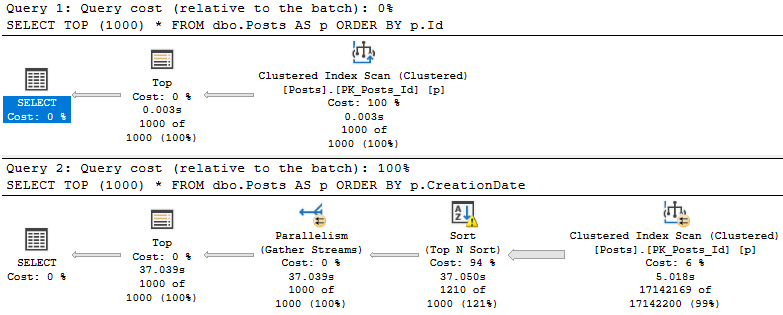
Take these two queries:
SELECT TOP (1000) *
FROM dbo.Posts AS p
ORDER BY p.Id;

SELECT TOP (1000) *
FROM dbo.Posts AS p
ORDER BY p.CreationDate;
I know, they’re terribly unrealistic. No one would ever. Not even close. Fine.
smh
Though both queries present the same data in the same order, the query that orders by the CreationDate column takes uh.
Considerably longer.
For reasons that should be apparent.
Of course, we could add an index to help. Just add all the indexes. What could go wrong?
If you have the type of application that lets users, say, dynamically filter and order by whatever columns they want, you’ve got a whole lot of index to create.
Better get started.
Thanks for reading!
Going Further
If this is the kind of SQL Server stuff you love learning about, you’ll love my training. Blog readers get 25% off the Everything Bundle — over 100 hours of performance tuning content. Need hands-on help? I offer consulting engagements from targeted investigations to ongoing retainers. Want a quick sanity check before committing to a full engagement? Schedule a call — no commitment required.
Yes, indexed view maintenance can be quite rough. I don’t mean like, rebuilding them. I will never talk about that.
I mean that, in some cases locks are serializable, and that if you don’t mind your indexes you may find run-of-the-mill modifications taking quite a long time.
Let’s go look!
Mill Town
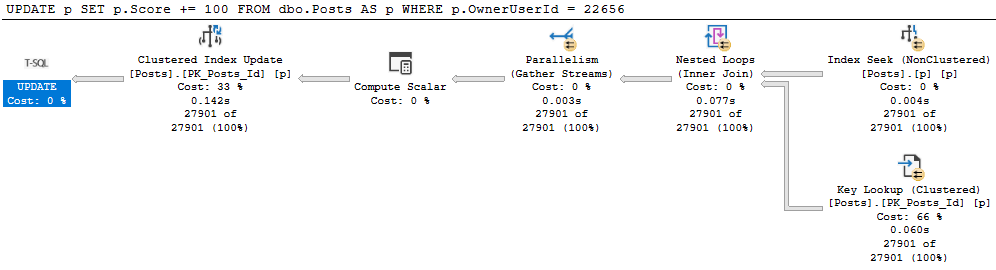
Let’s get update a small chunk of the Posts table.
BEGIN TRAN
UPDATE p
SET p.Score += 100
FROM dbo.Posts AS p
WHERE p.OwnerUserId = 22656;
ROLLBACK
Let’s all digress from the main point of this post for a moment!
It’s generally useful to give modifications an easy path to find data they need to update. For example:
Uh no
This update takes 1.6 seconds because we have no useful index on OwnerUserId. But we get a daft missing index request, because it wants to include Score, which would mean we’d need to then update that index as well as read from it. Locking leads to NOLOCK hints. I tend to want to introduce as little of it as possible.
With an index on just OwnerUserId, our situation improves dramatically.
100000X IMPROVEMENT
Allow Me To Reintroduce Myself
Let’s see what happens to our update with an indexed view in place.
CREATE OR ALTER VIEW dbo.PostScoresVotes
WITH SCHEMABINDING
AS
SELECT   p.Id,
         SUM(p.Score * 1.0) AS ScoreSum,
		 COUNT_BIG(v.Id) AS VoteCount,
		 COUNT_BIG(*) AS OkayThen
FROM     dbo.Posts AS p
JOIN     dbo.Votes AS v
    ON p.Id = v.PostId
WHERE p.PostTypeId = 2
AND   p.CommunityOwnedDate IS NULL
GROUP BY p.Id;
GO

CREATE UNIQUE CLUSTERED INDEX c_Id
    ON dbo.PostScoresVotes(Id);
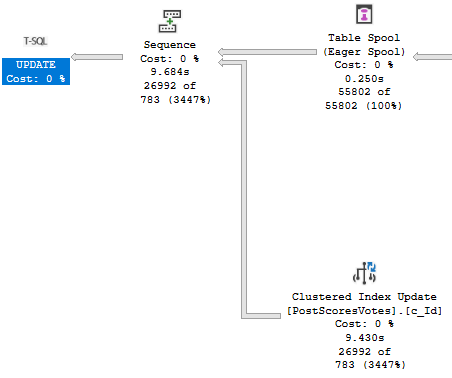
Our update query now takes about 10 seconds…
Oof dawg
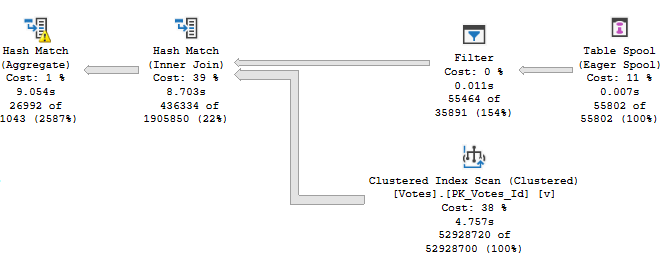
With the majority of the time being spent assembling the indexed view for maintenance.
Yikes dawg
The Problem Of Course
Is that our indexes are bad. We’ve got no helpful index between Posts and Votes to help with the assembly.
Our first clue may have been when creating the indexed view took a long time, but hey.
Let’s fix it.
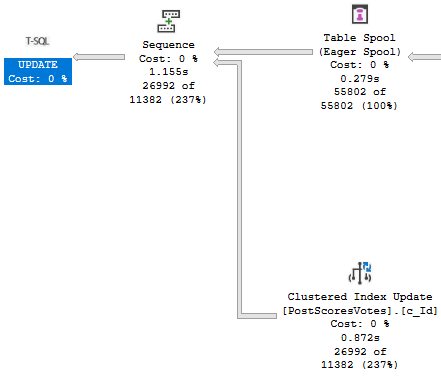
CREATE INDEX v ON dbo.Votes(PostId);
Now our update finishes in about a second!
Cleant Up
Thanks for reading!
Going Further
If this is the kind of SQL Server stuff you love learning about, you’ll love my training. Blog readers get 25% off the Everything Bundle — over 100 hours of performance tuning content. Need hands-on help? I offer consulting engagements from targeted investigations to ongoing retainers. Want a quick sanity check before committing to a full engagement? Schedule a call — no commitment required.
Unless you’re looking at an actual execution plan, one must never ever ever ever ever believe what one is seeing.
What one is seeing is a series of estimates that may have very little to do with reality. I don’t only mean within the execution plan; I also mean the runtime issues a query may encounter.
With all that in mind, here are some of the many ways a query plan can hide work:
Over the next few weeks, I’m going to show you how all of these things can be dreadfully wrong. The links will come alive here over the next few weeks, but you can see the full playlist here.
Anyway.
Thanks for reading!
Video Summary
In this video, I’m Erik Darling from Erik Darling Data, and I’m excited to share my insights on performance tuning queries in SQL Server. As someone who has been diving deep into the intricacies of query optimization, I realized there are some tricky aspects that weren’t as clear when I first started. This series aims to explore these complexities, particularly focusing on how actual execution plans can differ from cached plans in the plan cache or Query Store. I’ll also delve into why queries with low costs but high CPU usage can be misleading and discuss what happens when stored procedures call dynamic SQL or other stored procedures. Additionally, we’ll examine the nuances of parallelism and merge joins, as well as some parameter-related issues that aren’t exactly about sniffing but still significantly impact performance tuning. Stay tuned for more insights as this list grows over time, and who knows—maybe Microsoft will surprise us with a solution to these challenges!
Full Transcript
Hello, Erik Darling here with Erik Darling Data, almost on the verge of celebrating my one year anniversary. I’m going to be recording a series of videos because I think this is something that I wish I understood better when I was first getting into performance tuning queries. And I think there’s some really tricky and interesting things that I’m going to be recording. stuff that happens between like differences between actual execution plans and the cache plans that you might look at in the plan cache or in query store. And the ways that the cache plans can be very, very misleading. So I plan on also having all of these demos as a talk. So I’m recording these videos sort of as supplementary material to that too, in case anyone wants to go and revisit. anything. And this is just sort of the introductory video where I’m going to talk through the stuff that I’m going to record over the course of today. And this might change over time. This list will probably get a little bit longer. Hopefully, maybe have some new stuff added to it. But just like I got drunk on a Sunday and this is what I put together. I mean, it’s what day is today? No, this is now Thursday.
So I’ve been I’ve been working on this. And I look forward to giving my liver a break. So what I’m going to talk through what can stuff that can be misleading. When queries have a very low cost, but use a lot of CPU and the things that can cause those when see when queries have low CPU but high duration spools and how those can be crappy and misleading. Weird stuff that can go on with parallel What happens to a store procedure when you use it to call dynamic SQL or other store procedures? When merge joins have the many to many flags that is true. And then some stuff sort of I don’t want to call it parameter sniffing. I just want to call it parameter related because not all of it is exactly parameter sniffy stuff. Some of it is like if you like have if logic or something like that in your query that you use to like branch stuff off or like make some decisions about what exactly what you want to call it. You’re going to do inside of a store procedure when it runs. So I’m looking forward to sharing all this stuff with you. I’m also looking forward to this list growing as I don’t know as the time as time goes on or I don’t know maybe Microsoft will magically make it so that we don’t have to worry about this stuff anymore. That would be nice too. I’m going to go make some phone calls about that. Anyway, I will see you in the next video where we will talk about. Well, we will start with getting these liars to expose themselves. Anyway, see you there.
Going Further
If this is the kind of SQL Server stuff you love learning about, you’ll love my training. Blog readers get 25% off the Everything Bundle — over 100 hours of performance tuning content. Need hands-on help? I offer consulting engagements from targeted investigations to ongoing retainers. Want a quick sanity check before committing to a full engagement? Schedule a call — no commitment required.
I know, it’s tough to think about the tropical days of March in Chicago while you’re chattering your way through January. But for some of you, this is about how long it takes for you to get an expense approved and a day off. You’ll wanna be first in line once AP’s ink pads thaw out.
If your job is performance tuning SQL Server, and you’ve had it with struggling from one CPU fire to another, then you need to come to my precon. It’s taking place Friday March 20, in the lead up to SQL Saturday Chicago, which is a fantastic event.
I’m going to teach you how to solve the tough problems you have today with a mix of query and index tuning. You’ll walk out the door with new ways to think about performance tuning, and creative approaches to those queries that just seem totally untuneable.
For a limited time, use the coupon code “newyorkpizza” for $50 off the price of admission. That expires in February, so use it while you can.
Thanks for reading!
Going Further
If this is the kind of SQL Server stuff you love learning about, you’ll love my training. Blog readers get 25% off the Everything Bundle — over 100 hours of performance tuning content. Need hands-on help? I offer consulting engagements from targeted investigations to ongoing retainers. Want a quick sanity check before committing to a full engagement? Schedule a call — no commitment required.
If you have selective predicates earlier in the index that filter a lot of rows, the SARGability of trailing predicates matters less.
	CREATE INDEX shorty ON dbo.a_table(selective_column, non_selective_column);

	SELECT COUNT(*) AS records
	FROM dbo.a_table AS a
	WHERE selective_column = 1
	AND ISNULL(non_selective_column, 'whatever') = 'whatever';
Am I saying you should do this? Am I saying that it’s a good example to set?
No. I’m just saying you can get away with it in this situation.
Longer Answer
The less selective other predicates are, the less you can get away with it.
Take these two queries:
	SELECT COUNT(*) AS records
	FROM dbo.Users AS u
	WHERE u.Id = 8
	AND ISNULL(u.Location, N'') = N'';

    SELECT COUNT(*) AS records
    FROM dbo.Users AS u
    WHERE u.Id BETWEEN 8 AND 9693617
	AND ISNULL(u.Location, N'') = N'';
The first one has an equality predicate on the Id, the primary key of the table. It’s going to touch one row, and then evaluate the residual predicate on Location.
The second query has a very non-selective range predicate on Id — still a selective column, just not a selective predicate anymore — so, we do a lot more work (relatively).
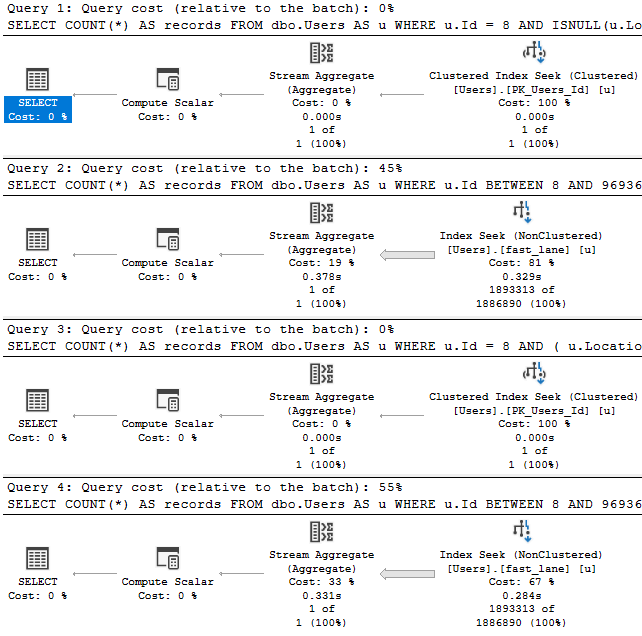
If we have this index, and we look at how four logically equivalent queries perform:
CREATE UNIQUE INDEX fast_lane ON dbo.Users(Id, Location);
SELECT COUNT(*) AS records
FROM   dbo.Users AS u
WHERE  u.Id = 8
AND    ISNULL(u.Location, N'') = N'';

SELECT COUNT(*) AS records
FROM   dbo.Users AS u
WHERE  u.Id BETWEEN 8 AND 9693617
AND    ISNULL(u.Location, N'') = N'';

SELECT COUNT(*) AS records
FROM   dbo.Users AS u
WHERE  u.Id = 8
AND   (   u.Location = N''
      OR   u.Location IS NULL );

SELECT COUNT(*) AS records
FROM   dbo.Users AS u
WHERE  u.Id BETWEEN 8 AND 9693617
AND   (   u.Location = N''
      OR   u.Location IS NULL );
The query plans tell us enough:
Toasty
It really doesn’t matter if we obey the laws of SARGability here.
Expect Depression
There have been many times when explaining SARGability to people that they went back and cleaned up code like this to find it didn’t make much of a difference to performance. That’s because SARGability depends on indexes that can support seekable predicates. Without those indexes, it makes no practical difference how you write these queries.
Again, I’m not condoning writing Fast Food Queries when you can avoid it. Like I said earlier, it sets a bad example.
Once this kind of code creeps into your development culture, it’s hard to keep it contained.
There’s no reason to not avoid it, but sometimes it hurts more than others. For instance, if Location were the first column in the index, we’d have a very different performance profile across all of these queries, and other rewrites might start to make more sense.
Thanks for reading!
Going Further
If this is the kind of SQL Server stuff you love learning about, you’ll love my training. Blog readers get 25% off the Everything Bundle — over 100 hours of performance tuning content. Need hands-on help? I offer consulting engagements from targeted investigations to ongoing retainers. Want a quick sanity check before committing to a full engagement? Schedule a call — no commitment required.
I see people using OUTPUT to audit modifications from time to time, often because “triggers are bad” or “triggers are slow”.
Well, sometimes, sure. But using OUTPUT can be a downer, too.
Let’s look at how.
A Process Emerges
Say we’ve got a table that we’re using to track user high scores for their questions.
CREATE TABLE dbo.HighQuestionScores
(
    Id INT PRIMARY KEY CLUSTERED,
    DisplayName NVARCHAR(40) NOT NULL,
    Score BIGINT NOT NULL
);
To test the process, let’s put a single user in the table:
INSERT dbo.HighQuestionScores WITH (TABLOCK)
        (Id, DisplayName, Score)
SELECT u.Id, u.DisplayName, p.Score
FROM dbo.Users AS u
JOIN
(
    SELECT p.OwnerUserId,
	       MAX(p.Score) AS Score
    FROM dbo.Posts AS p
    WHERE p.PostTypeId = 1
    GROUP BY p.OwnerUserId
) AS p ON p.OwnerUserId = u.Id
WHERE u.Id = 22656;
To exacerbate the problem, I’m not going to create any helpful indexes here. This is a good virtual reality simulator, because I’ve seen your indexes.
Yes you. Down in front.
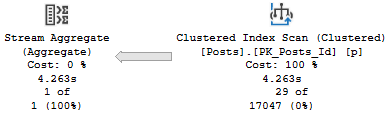
The relevant part of the query plan is the scan of the Posts table:
Practice
It’s parallel, and takes 1.8 seconds.
Aw, dit
Now let’s add in an OUTPUT clause.
I’m going to skip over inserting the output into any structure, because I want you to understand that the target doesn’t matter.
INSERT dbo.HighQuestionScores WITH (TABLOCK)
        (Id, DisplayName, Score)
OUTPUT Inserted.Id,
       Inserted.DisplayName,
       Inserted.Score
SELECT u.Id, u.DisplayName, p.Score
FROM dbo.Users AS u
JOIN
(
    SELECT p.OwnerUserId, MAX(p.Score) AS Score
    FROM dbo.Posts AS p
    WHERE p.PostTypeId = 1
    GROUP BY p.OwnerUserId
) AS p ON p.OwnerUserId = u.Id
WHERE u.Id = 22656;
The relevant part of the plan now looks like this:
Golf Coach
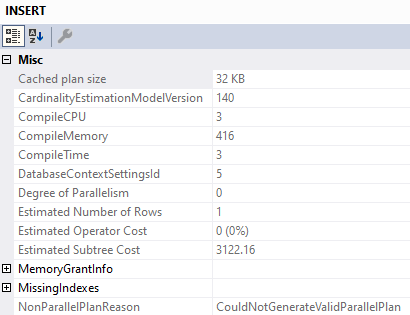
We’ve lost parallelism, and inspecting the properties of the Insert operator tells us why:
Less Successful
We’ve got a Non Parallel Plan Reason. Why aren’t there any spaces? I don’t know.
Why can’t that go parallel? I also don’t know.
What About Triggers?
If we create a minimal trigger on the table, we can see if it has the same overhead.
CREATE OR ALTER TRIGGER dbo.hqs_insert ON dbo.HighQuestionScores
AFTER INSERT
AS
BEGIN
SET NOCOUNT ON;

    SELECT Inserted.Id,
           Inserted.DisplayName,
           Inserted.Score
    FROM Inserted;

END
Let’s go back to the original insert, without the output! We care about two things:
Is the parallel portion of the insert plan still there?
Is there any limitation on parallelism with the Inserted (and by extension, Deleted) virtual tables?
The answers are mostly positive, too. The insert plan can still use parallelism.
I’m not gonna post the same picture here, you can scroll back fondly.
Though the select from the Inserted table within the trigger doesn’t go parallel, it doesn’t appear to limit parallelism for the entire plan. It does appear that reads from the Inserted table can’t use parallelism (sort of like the table variable in a MSTVF).
Let’s modify the trigger slightly:
CREATE OR ALTER TRIGGER dbo.hqs_insert ON dbo.HighQuestionScores
AFTER INSERT
AS
BEGIN
SET NOCOUNT ON;

    DECLARE @Id INT
	DECLARE @DisplayName NVARCHAR(40)
	DECLARE @Score BIGINT

    SELECT @Id = Inserted.Id,
           @DisplayName = Inserted.DisplayName,
           @Score = Inserted.Score
    FROM Inserted
	JOIN dbo.Comments AS c
	    ON c.UserId = Inserted.Id;

END
And for variety, let’s insert a lot more data into our table:
TRUNCATE TABLE dbo.HighQuestionScores;

INSERT dbo.HighQuestionScores WITH (TABLOCK)
        (Id, DisplayName, Score)
SELECT u.Id, u.DisplayName, p.Score
FROM dbo.Users AS u
JOIN
(
    SELECT p.OwnerUserId, MAX(p.Score) AS Score
    FROM dbo.Posts AS p
    WHERE p.PostTypeId = 1
    GROUP BY p.OwnerUserId
) AS p ON p.OwnerUserId = u.Id
WHERE u.Id < 500000;
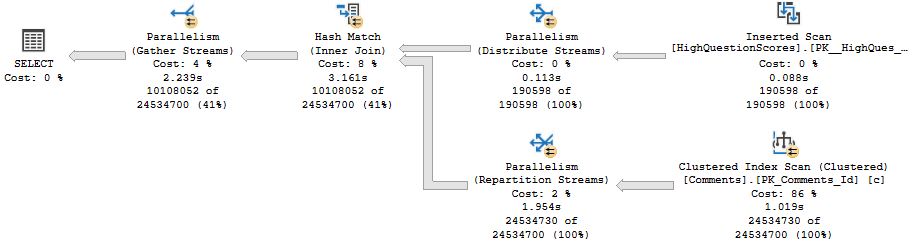
Here’s the query plan:
Wrecking Ball
The read from Inserted is serial, but the remainder of the plan fully embraces parallelism like a long lost donut.
Togetherness
Given a well-tuned workload, you may not notice any particular overhead from using OUTPUT to audit certain actions.
Of course, if you’re using them alongside large inserts, and those large inserts happen to run for longer than you’d like, it might be time to see how long they take sans the OUTPUT clause. It’s entirely possible that using a trigger instead would cause fewer performance issues.
Thanks for reading!
Going Further
If this is the kind of SQL Server stuff you love learning about, you’ll love my training. Blog readers get 25% off the Everything Bundle — over 100 hours of performance tuning content. Need hands-on help? I offer consulting engagements from targeted investigations to ongoing retainers. Want a quick sanity check before committing to a full engagement? Schedule a call — no commitment required.
I speak with a lot of people who have SQL Server performance problems. Sometimes they’re constant, sometimes they’re obvious, and sometimes they’re intermittent.
Constant and obvious problems are easy to observe, though not necessarily easy to resolve without experience. Still, they’re a bit less frustrating, because at least you’ve got some idea what’s going on. It’s those intermittent problems that can be a real pain.
SQL Server is very catch-me-if-you-can when it comes to most issues. I’ve talked about this before I’m sure, but if you’re not hitting F5 at in the right place at the right time, you could totally miss what happened when you had a problem, and very there’s no time sliced data collection (except in query store) that can help with any reliability.
Not wait stats, not perfmon, not index usage. The plan cache can be okay, but is often unreliable, and has many blind spots.
Whatcha Got?
The people I talk to generally fall into two groups:
We don’t have a monitoring tool at all
We have one, but we can’t figure anything out with it
If you don’t have one, Sentry One is a good place to start. It’s not perfect, but I tend to have good luck with it.
If you do have one, make the most of it. Have a sales tech give you some training. That’s part of what you pay for. Take it a step further: tell them about the kind of problems you have, and ask them to show you how to find them using their monitoring tool. If they can’t do that, it might be time to shop around for one that can.
Old Block
This isn’t just for you, either. This request is sort of selfish.
Let’s say you call someone like me in to look at your server. If you’ve got intermittent issues, it’s a whole lot easier to show me what was happening in the monitoring tool the last time you had an issue than to try to explain to me what happened. It’s a lot less annoying than hoping it happens again while we’re looking at the server together, or trying to recreate it.
Thanks for reading!
Going Further
If this is the kind of SQL Server stuff you love learning about, you’ll love my training. Blog readers get 25% off the Everything Bundle — over 100 hours of performance tuning content. Need hands-on help? I offer consulting engagements from targeted investigations to ongoing retainers. Want a quick sanity check before committing to a full engagement? Schedule a call — no commitment required.
There are lots of great options out there for figuring out what’s happening on a server. If you’re the kind of person still running sp_who, or sp_who2, or sp_who8045, it’s time to stop.
You’ve got much better options, like sp_WhoIsActive, or the First Responder Kit. They’re both great, but sometimes I needed this very specific information very quickly without all the bells and whistles.
I call it the pressure detector. It’s four simple DMV queries that will give you different levels of detail about memory and CPU usage currently taking place on a server. Like a lot of these scripts, when a server is Baltimoring, you’re better off running them using the DAC. Otherwise, you’re kinda stuck in the same place all your other queries are.
So what does this help you with? Situations where you’re running out of worker threads, or when you’re running out of memory.
When you hit those, you’ll get smacked with a couple nasty waits:
THREADPOOL: Running out of worker threads
RESOURCE_SEMAPHORE: Running out of query memory
The thing is, sometimes it’s hard to see what’s happening, what’s causing problems, and what’s on the receiving end.
Check out this video to walk you through the procedure results.
Video Killed
Thanks for reading!
Going Further
If this is the kind of SQL Server stuff you love learning about, you’ll love my training. Blog readers get 25% off the Everything Bundle — over 100 hours of performance tuning content. Need hands-on help? I offer consulting engagements from targeted investigations to ongoing retainers. Want a quick sanity check before committing to a full engagement? Schedule a call — no commitment required.