That’s a pretty good start, but what about other kinds of writes, like the ones outlined in the Q&A I linked to?
So uh, I wrote this script to find them.
Downsides
The downsides here are that it’s looking at the plan cache, so I can’t show you which operator is spilling. You’ll have to figure that out on your own.
The source of the writes may be something else, too. It could be a spool, or a stats update, etc. That’s why I tried to set the spill size (1024.) kind of high, to not detect trivial writes.
WITH
XMLNAMESPACES
    ('http://schemas.microsoft.com/sqlserver/2004/07/showplan' AS x),
writes AS
(
    SELECT TOP (100)
        deqs.statement_start_offset,
        deqs.statement_end_offset,
        deqs.plan_handle,
        deqs.creation_time,
        deqs.last_execution_time,
        deqs.total_logical_writes,
        deqs.last_logical_writes,
        deqs.min_logical_writes,
        deqs.max_logical_writes,
        deqs.query_hash,
        deqs.query_plan_hash
    FROM sys.dm_exec_query_stats AS deqs
    WHERE deqs.min_logical_writes > 1024.
    ORDER BY deqs.min_logical_writes DESC
),
plans AS
(
    SELECT DISTINCT
        w.plan_handle,
        w.statement_start_offset,
        w.statement_end_offset,
        w.creation_time,
        w.last_execution_time,
        w.total_logical_writes,
        w.last_logical_writes,
        w.min_logical_writes,
        w.max_logical_writes
    FROM writes AS w
    CROSS APPLY sys.dm_exec_query_plan(w.plan_handle) AS deqp
    CROSS APPLY deqp.query_plan.nodes('//x:StmtSimple') AS s(c)
    WHERE deqp.dbid > 4
    AND   s.c.value('@StatementType', 'VARCHAR(100)') = 'SELECT'
    AND   NOT EXISTS
          (
              SELECT
                  1/0 --If nothing comes up, quote out the NOT EXISTS.
              FROM writes AS w2
              CROSS APPLY deqp.query_plan.nodes('//x:StmtSimple') AS s2(c)
              WHERE w2.query_hash = w.query_hash
              AND   w2.query_plan_hash = w.query_plan_hash
              AND   s2.c.value('@StatementType', 'VARCHAR(100)') <> 'SELECT'
          )
)
SELECT
    p.creation_time,
    p.last_execution_time,
    p.total_logical_writes,
    p.last_logical_writes,
    p.min_logical_writes,
    p.max_logical_writes,
    text =
        SUBSTRING
        (
            dest.text,
        	( p.statement_start_offset / 2 ) + 1,
            ((
        	    CASE p.statement_end_offset
        		     WHEN -1
        			 THEN DATALENGTH(dest.text)
        	         ELSE p.statement_end_offset
                END - p.statement_start_offset
        	  ) / 2 ) + 1
        ),
    deqp.query_plan
FROM plans AS p
CROSS APPLY sys.dm_exec_sql_text(p.plan_handle) AS dest
CROSS APPLY sys.dm_exec_query_plan(p.plan_handle) AS deqp
ORDER BY p.min_logical_writes DESC
OPTION ( RECOMPILE );
Going Further
If this is the kind of SQL Server stuff you love learning about, you’ll love my training. Blog readers get 25% off the Everything Bundle — over 100 hours of performance tuning content. Need hands-on help? I offer consulting engagements from targeted investigations to ongoing retainers. Want a quick sanity check before committing to a full engagement? Schedule a call — no commitment required.
In this video, I delve into a fascinating debate: when is union better or worse than union all? Often maligned due to its requirement for distinct rows, the union operator can indeed be cumbersome, especially without proper indexing. However, I demonstrate that there are scenarios where using union can significantly improve query performance by avoiding unnecessary sorting and spooling operations. Through a practical example from my recent SQLBits session, I show how tuning with union instead of union all can drastically reduce execution time—from 16 seconds to just three seconds in one case. This video is not about promoting vintage seltzer but rather encouraging viewers to consider the context before choosing between these operators, emphasizing that responsible query optimization requires understanding the nuances and specific needs of your data.
Full Transcript
Howdy folks, Erik Darling here with Erik Darling Data, which only makes sense. I’m drinking this lovely vintage seltzer. This YouTube video is not sponsored by vintage seltzer. I’m here to ask an interesting question, and that is, is union always better, or always better, always worse than union all. See, union gets kind of a bad reputation on account of it has to come up with a distinct set of rows and columns, or fields and records, if you’re into that sort of thing. But, and that can be painful. So when we think about union, we have a ton of columns, we have a ton of records, rows, or whatever you want to call them, who’s he, what’s it’s gadgets and ding-dongs. It can be pretty painful to come up with a unique set of those, especially when you’re there’s no supporting indexing, get some string columns in there, stuff can get pretty nasty. And that’s where union all can kind of be better because the SQL Server is not wasting time trying to uniqueify that result set. It’s just saying, you’re all welcome, come on, hang out, come into the light, some duplicates, repetitives, nulls, anything you want, throw it in there.
But, sometimes, getting a unique set of values is a good idea. And I’m going to show you one example of that. Now I’ve got two queries here. Now this is kind of a small deviation of a query that I presented in my indexing session at SQLBits. And the query doesn’t do anything terribly interesting, but I rewrote it a little bit. And this one here uses a union operator. And this one here uses a union all operator. And I’m going to show you something kind of interesting. I’m going to run, which one do I want to do first? You know what, I’m going to run the union all query first. And I’m going to kick that off. I’ve got query plans turned on, I hope. Otherwise, I’m going to waste about 15 seconds of your life. And while this runs, and runs, and runs, and runs, and kind of just keeps going. Oh, 16 seconds. Yeah, all right. Splendid. Now I’m going to run the union query.
And, ooh, that felt better to me. Three seconds. Not bad. Go us. We tuned that query with the magnificent use of union over union all. So what was the difference between these two queries? Well, let’s look at the union all plan first. I’m going to go over into the execution plan. And we’re going to concentrate on this bottom part, because believe me, this bottom part is where SQL Server did the majority of the work.
And let’s first look at this sort operator. And what I want to do is hit F4 there to bring up the properties window. Before we get to that, if we look at the sort, we can see that we spilled two threads. Spill level two. Oh, wrong button. There we go. And we spilled about 1,287 pages to disk.
Not a lot. Not terrible. If we look at the actual time statistics, we can see that we spent a little under a second on the sort. Where we spent the rest of our time was in this index. Sorry, this table spool.
So if we look at the actual time statistics here, a full 10. Oh, come on. Zoom it. There we go. A full 10 of our 16 seconds was spent spooling data about.
Spooled all over the place. Spooled once forth and beyond to the grave. Spooled.
It’s a long time to spend spooling data. If we look at kind of what we did for work in here. Well, we did about 243,000 executions. Right down there.
We did, if you add up the rebinds and the rewinds, that’ll add up to that number down there. And we spooled through above. That’s a lot.
Throw some commas in there, about 10 million rows. All right. Cool. So that’s our union all plan. If we look over at the union plan, right? That was three seconds, remember? Three wonderful seconds.
This is about the best you get out of me. It’s about, I mean, by that I mean that’s about as quickly as I can tune a query down to. Don’t think that there is any innuendo there. Sick people.
But if we look at the actual time stats here on the sort, we do about the same. But we have a slightly different sort over here. In this plan, we have a distinct sort. So this is where SQL Server decided to go and make our data set unique.
This is the distinct sort. If we look back over at the other plan, we just have, oh, where’d you go? Why’d you run away from me?
We have a regular sort. There is no distinctification going on in this sort operator. So let’s go back over here and let’s look at what happened in this query plan. So now let’s look at this table spool.
And it’s kind of interesting that if we look at what the spool did, it’s the same as the other one. We have 243, 205. And if we add up these, 40938, 202, 266, it adds up to the same thing.
But we spooled a lot less rows through this one. Yeah. Far fewer rows ended up going through that because we had a distinct result set from the union of those two tables rather than everything.
So sometimes, sometimes, we can save a lot of time in the query by getting a distinct result set. Now, in the session that I presented, I gave you a different way of tuning the query to get it down pretty quickly. Again, about three seconds.
So that’s why they call me three seconds, Eric. That’s why I tune queries down to. Anyway, sometimes, union can be better than union all.
Not always. Sometimes. It’s up to you as a, what do you call it? What’s a good word? Responsible.
Yeah. As a responsible query tuner to do this kind of investigation into your queries and why they’re slow. Anyway, I’m almost at the seven minute mark and that’s two minutes longer than I wanted to go. So thank you for watching and I’ll see you next time.
Video Summary
In this video, I delve into a fascinating debate: when is union better or worse than union all? Often maligned due to its requirement for distinct rows, the union operator can indeed be cumbersome, especially without proper indexing. However, I demonstrate that there are scenarios where using union can significantly improve query performance by avoiding unnecessary sorting and spooling operations. Through a practical example from my recent SQLBits session, I show how tuning with union instead of union all can drastically reduce execution time—from 16 seconds to just three seconds in one case. This video is not about promoting vintage seltzer but rather encouraging viewers to consider the context before choosing between these operators, emphasizing that responsible query optimization requires understanding the nuances and specific needs of your data.
Full Transcript
Howdy folks, Erik Darling here with Erik Darling Data, which only makes sense. I’m drinking this lovely vintage seltzer. This YouTube video is not sponsored by vintage seltzer. I’m here to ask an interesting question, and that is, is union always better, or always better, always worse than union all. See, union gets kind of a bad reputation on account of it has to come up with a distinct set of rows and columns, or fields and records, if you’re into that sort of thing. But, and that can be painful. So when we think about union, we have a ton of columns, we have a ton of records, rows, or whatever you want to call them, who’s he, what’s it’s gadgets and ding-dongs. It can be pretty painful to come up with a unique set of those, especially when you’re there’s no supporting indexing, get some string columns in there, stuff can get pretty nasty. And that’s where union all can kind of be better because the SQL Server is not wasting time trying to uniqueify that result set. It’s just saying, you’re all welcome, come on, hang out, come into the light, some duplicates, repetitives, nulls, anything you want, throw it in there.
But, sometimes, getting a unique set of values is a good idea. And I’m going to show you one example of that. Now I’ve got two queries here. Now this is kind of a small deviation of a query that I presented in my indexing session at SQLBits. And the query doesn’t do anything terribly interesting, but I rewrote it a little bit. And this one here uses a union operator. And this one here uses a union all operator. And I’m going to show you something kind of interesting. I’m going to run, which one do I want to do first? You know what, I’m going to run the union all query first. And I’m going to kick that off. I’ve got query plans turned on, I hope. Otherwise, I’m going to waste about 15 seconds of your life. And while this runs, and runs, and runs, and runs, and kind of just keeps going. Oh, 16 seconds. Yeah, all right. Splendid. Now I’m going to run the union query.
And, ooh, that felt better to me. Three seconds. Not bad. Go us. We tuned that query with the magnificent use of union over union all. So what was the difference between these two queries? Well, let’s look at the union all plan first. I’m going to go over into the execution plan. And we’re going to concentrate on this bottom part, because believe me, this bottom part is where SQL Server did the majority of the work.
And let’s first look at this sort operator. And what I want to do is hit F4 there to bring up the properties window. Before we get to that, if we look at the sort, we can see that we spilled two threads. Spill level two. Oh, wrong button. There we go. And we spilled about 1,287 pages to disk.
Not a lot. Not terrible. If we look at the actual time statistics, we can see that we spent a little under a second on the sort. Where we spent the rest of our time was in this index. Sorry, this table spool.
So if we look at the actual time statistics here, a full 10. Oh, come on. Zoom it. There we go. A full 10 of our 16 seconds was spent spooling data about.
Spooled all over the place. Spooled once forth and beyond to the grave. Spooled.
It’s a long time to spend spooling data. If we look at kind of what we did for work in here. Well, we did about 243,000 executions. Right down there.
We did, if you add up the rebinds and the rewinds, that’ll add up to that number down there. And we spooled through above. That’s a lot.
Throw some commas in there, about 10 million rows. All right. Cool. So that’s our union all plan. If we look over at the union plan, right? That was three seconds, remember? Three wonderful seconds.
This is about the best you get out of me. It’s about, I mean, by that I mean that’s about as quickly as I can tune a query down to. Don’t think that there is any innuendo there. Sick people.
But if we look at the actual time stats here on the sort, we do about the same. But we have a slightly different sort over here. In this plan, we have a distinct sort. So this is where SQL Server decided to go and make our data set unique.
This is the distinct sort. If we look back over at the other plan, we just have, oh, where’d you go? Why’d you run away from me?
We have a regular sort. There is no distinctification going on in this sort operator. So let’s go back over here and let’s look at what happened in this query plan. So now let’s look at this table spool.
And it’s kind of interesting that if we look at what the spool did, it’s the same as the other one. We have 243, 205. And if we add up these, 40938, 202, 266, it adds up to the same thing.
But we spooled a lot less rows through this one. Yeah. Far fewer rows ended up going through that because we had a distinct result set from the union of those two tables rather than everything.
So sometimes, sometimes, we can save a lot of time in the query by getting a distinct result set. Now, in the session that I presented, I gave you a different way of tuning the query to get it down pretty quickly. Again, about three seconds.
So that’s why they call me three seconds, Eric. That’s why I tune queries down to. Anyway, sometimes, union can be better than union all.
Not always. Sometimes. It’s up to you as a, what do you call it? What’s a good word? Responsible.
Yeah. As a responsible query tuner to do this kind of investigation into your queries and why they’re slow. Anyway, I’m almost at the seven minute mark and that’s two minutes longer than I wanted to go. So thank you for watching and I’ll see you next time.
Going Further
If this is the kind of SQL Server stuff you love learning about, you’ll love my training. Blog readers get 25% off the Everything Bundle — over 100 hours of performance tuning content. Need hands-on help? I offer consulting engagements from targeted investigations to ongoing retainers. Want a quick sanity check before committing to a full engagement? Schedule a call — no commitment required.
In this video, I delve into a quirky yet important aspect of SQL Server execution plans: the warning for implicit conversions. I start by sharing a personal anecdote about my silent air horn and how it led to a bit of downtime, but now that I’ve wrapped up those preparations, I’m excited to share insights on query optimization. The video highlights a common scenario where an implicit conversion in a query can trigger a warning, making you think the execution plan might be suboptimal. However, I demonstrate through examples how this warning isn’t always as dire as it seems; sometimes, even without the conversion, you won’t get a seek plan due to missing indexes. By creating these necessary indexes, we see the difference in performance, with SQL Server finally able to use a seek operation instead of a scan. This video aims to clarify when such warnings are actually significant and when they might be misleading, helping you make more informed decisions about your query optimization strategies.
Full Transcript
Erik Darling here with Erik Darling Data. Still do not have a proper air horn. Still have a silent air horn, which is very, very sad and depressing for me. I’m going to get on that this weekend. I’ve been a little busy. Now I’m less busy. Now that I don’t have bits to prepare for. Now that I just have a couple other things to prepare for. But now that I’ve delivered the material, I’m really happy with it and I think I’ll be able to move on from there. But anyway, I wanted to talk to you about something kind of funny that shows up in execution plans that can be a little bit misleading. And it’s a warning about implicit conversions. And I’m just going to jump in and show you the warning so that we’re all on the same page here. Now when I run this query over here, when I hit execute, I get query plans turned on. I’m going to run this and I’m going to get results back and that’s not really the point. The point is that when I go into the execution plan, I have this little bingo bango over the select operator. Sign that SQL Server is angry with me. We have summoned the wrath of SQL Server. All of a sudden, we have to worry about these things.
That little bang is coming up because we have an implicit conversion in this execution plan and it may affect the seek plan in the query choice. Yeah, it might do that. Yeah, crazy, right? Something went terribly wrong. And what went terribly wrong is that we have flubbed this query from the get-go. What we’ve done is tremendously idiotic. We are converting a column that’s an integer to be a varkar 10 and then comparing it to a string over here. I know. Who would ever do that in real life?
Anyway, what’s misleading about this is that if we run this query in a way that does not summon the implicit conversion gods like this, we still won’t get a seek plan. I know. Crazy, right? Over here. We are still just scanning the clustered index. Bananas. Bonkers. Outrageous. Slings and arrows, my friends. Slings and arrows. There is something different in the plan now, though. We do have a missing index request. Now, SQL Server is saying, hey, pal, between you and me, you create this index on this badges table on that user ID column.
We could do good things together. We could have a good time. And that’s exactly what you need in order to get a seek. See, without an index on that column, the way this query is set up, specifically without an index that leads on user ID. If we had user ID second in the index and we had another equality predicate first, then we could seek for both. But with this one with just one predicate, without an index that leads on user ID, this 22656 is just going to have to scan something else.
The primary key clustered index on the badges table is a column called ID, not user ID. So we are missing out on something fundamental there. But if I go and I create an index on user ID, well, I’m sorry, this takes a second for some reason. There we go. Now we’re cooking with indexes. Get rid of you. Goodbye. Now if we go back and run this one, we will in fact get a real snappy seek plan. Get that. Good. Yeah. Seek. Look at that. We did it. Thanks, ma. Look, ma. No hands.
But now it makes this warning reasonable. So now if I run this and we look at the execution plan, we are going to go back to scanning. Well, not back to. Now we’re going to be scanning our nonclustered index rather than our clustered index. But we still had to scan it. Now when we get this warning over here about affecting the seek plan choice, that’s not terrible at all to say. Thanks, Microsoft wording people. But now this warning is at least accurate because it did affect the optimizer’s ability to seek. So just a heads up, when you get that warning, that doesn’t mean that you have a good index for SQL Server to use to seek into.
That means that even if you did have the index, we wouldn’t be able to seek into it. So don’t think that just because you get rid of the implicit conversion, all of a sudden you’re going to see a seek plan, you still need an index to back it up. Anyway, that’s it for me. I’m going to keep this to five minutes. Thanks for watching. Again, I’m Erik Darling with Erik Darling Data. And thanks for watching and I’ll see you next time. What’s that stop button? Goodbye.
Going Further
If this is the kind of SQL Server stuff you love learning about, you’ll love my training. Blog readers get 25% off the Everything Bundle — over 100 hours of performance tuning content. Need hands-on help? I offer consulting engagements from targeted investigations to ongoing retainers. Want a quick sanity check before committing to a full engagement? Schedule a call — no commitment required.
While working with a client, I came up with a query against the SentryOne repository.
The point of it is to find queries that waited more than a second to get a memory grant. I wrote it because this information is logged but not exposed in the GUI yet.
It will show you basic information about the collected query, plus:
How long it ran in seconds
How long it waited for memory in seconds
How long it ran for after it got memory
SELECT   HostName,
         CPU,
         Reads,
         Writes,
         Duration,
         StartTime,
         EndTime,
         TextData,
         TempdbUserKB,
         GrantedQueryMemoryKB,
         DegreeOfParallelism,
         GrantTime,
         RequestedMemoryKB,
         GrantedMemoryKB,
         RequiredMemoryKB,
         IdealMemoryKB,
         Duration / 1000. AS DurationSeconds,
         DATEDIFF(SECOND, StartTime, GrantTime) AS SecondsBetweenQueryStartingAndMemoryGranted,
         (Duration - DATEDIFF(MILLISECOND, StartTime, GrantTime)) / 1000. AS HowFastTheQueryRanAfterItGotMemory
FROM     PerformanceAnalysisTraceData
WHERE DATEDIFF(SECOND, StartTime, GrantTime) > 1
ORDER BY SecondsBetweenQueryStartingAndMemoryGranted DESC
The results I saw were surprising! Queries that waited 10+ seconds for memory, but finished instantly when they finally got memory.
If you’re a Sentry One user, you may find this helpful. If you find queries waiting a long time for memory, you may want to look at if you’re hitting RESOURCE_SEMAPHORE waits too.
Thanks for reading!
Going Further
If this is the kind of SQL Server stuff you love learning about, you’ll love my training. Blog readers get 25% off the Everything Bundle — over 100 hours of performance tuning content. Need hands-on help? I offer consulting engagements from targeted investigations to ongoing retainers. Want a quick sanity check before committing to a full engagement? Schedule a call — no commitment required.
Thank you to everyone who donated, attended the session, and of course the lovely people at SQLBits for putting on a great conference. Hope to see everyone again next year…
If this is the kind of SQL Server stuff you love learning about, you’ll love my training. Blog readers get 25% off the Everything Bundle — over 100 hours of performance tuning content. Need hands-on help? I offer consulting engagements from targeted investigations to ongoing retainers. Want a quick sanity check before committing to a full engagement? Schedule a call — no commitment required.
In this video, I share one of my favorite features in SQL Server execution plans that often goes unnoticed but can provide invaluable insights into query performance. I dive into the actual time statistics property, which allows you to see exactly how long each operator ran for without needing live query plans. By highlighting examples from a recent podcast and demonstrating with a practical query plan, I show how this feature can pinpoint where your queries are spending most of their time—whether it’s on sorting or other operations—and help identify areas for optimization. If you’re curious about optimizing your SQL Server queries or just want to understand execution plans better, make sure to check out the pre-con I’ll be giving at SQL Bits and start exploring this feature in your own plans!
Full Transcript
What’s up? Erik Darling here with Erik Darling Data, the official sticker of my company, or the official company of my stickers, I guess, I don’t know, whatever. I’m recording a quick video today to talk about one of my favorite new features, or not even new, but one of my favorite features that I don’t see enough people talking about when they’re looking at query plans. And I’ve been watching this podcast called Drink Champs, which is awesome, and it’s just like all interviews with rap dudes from the 80s and 90s and stuff.
And I get jealous because when they record their thing, they get to be like, make some noise! And they have like air horns. All I have is this lame can of compressed air. So when I do make some noise, it’s just… It doesn’t have the same effect. And I think next video I might try to get an air horn in here so that I can make some noise too.
But, so anyway, what I’m going to show you is actually a little bit of a preview from my pre-con that I have coming up at SQL Bits. And I’m really looking forward to that. I’m getting a little nervous because it’s like the Saturday and it’s, man, it’s creeping up. Whew! It’s so close.
But, so one thing that I’m going to be talking about in the pre-con is this cool thing in execution plans that shows you how long an operator kind of ran for. So we have this query, right? Now we have this query plan. And there’s a whole bunch of stuff in it.
And there’s a whole lot of stuff that could be slow. If you look down the bottom of the screen, let me zoom in a little bit down here, we can see this dog ran for 29 seconds. 29! And I know people will be like, well turn on live query plans, rerun it.
Well I don’t want to turn on live query plans, I just want to get my actual plan. And I want to see where I spent all my time. Now if I hit F4 on one of these operators, what’s going to pop up is this new window over on the side, the properties thing. And there’s a property in here called actual time statistics.
And when I open it up, not only can I see the actual CPU and elapsed time that I spend on an operator, but if I click these out, I can see how many rows ended up on threads. I can see if my parallelism got all skewed and stuff got all nasty. So we have this timing here.
So we can see that for this index scan, we spent about six and a half CPU seconds on it. And we spent, we use multiple CPUs to make things faster. And so we spent about one point, well, you know what, I’m going to round up and say 1.8 actual seconds on the index scan.
Right? And if we go down the line, and we look at all of these different operators, we proceed to different operators, we can start to see how much time we spent in different places. And we get over to this sort operator, whoo-wee!
We spent 19 seconds sorting data. That’s crazy. So 19 out of 29 seconds in this execution plan was just spent on this sort. And of course, this sort spills out to disk and it’s all nasty and gnarly.
And that thing spilled almost 1 million pages out to disk. 980,000 pages. That’s bonkers.
Of course, that took 19 seconds. That’s terrible. And as we go down the line, we’ll see different things for, we’ll see different timings. And the timing kind of adds up as you go down. So it wasn’t a full 19 seconds here, but there wasn’t really a whole lot else going on between that scan and that sort.
So we’re going to call that sort the majority of the time we spend in the query plan. Not every operator has this attribute. So if we look at the, if you look at the, sorry, the compute scalar over here, we don’t have that attribute.
And that’s why it disappears. But if you come back to the sequence project compute scalar, we’ll have our actual time statistics back. And we can look at our filter and we can see that as we go kind of to the left, the time will sort of add up.
But it resets in weird places. I haven’t quite figured out the entire dynamic of when things reset and when things change. It’s a little bit weird.
It’s a little bit weird and foreign to me. I don’t think it’s documented anywhere. So I’m going to, I’m going to refrain from making too many guesses. But as we click around, we can kind of see where different parts of the plan spent different amounts of time. And by the time we get to the very end here to this parallelism, where we gather all the streams together, we’re at about 28 seconds.
And then the sort will have us a little bit higher up a little bit closer to 20. So there was some time spent in the query to show us the results, right? So we had to show the results and format that.
But overall, the majority of the time was spent sorting all this data. Now, of course, you’re going to have to come to my pre-con to learn how we can fix this and make this not take 19 seconds. And maybe you, maybe, maybe I’ll see you there.
Or maybe I’ll see you when I, when I talk about this somewhere else, live and in person. I hope I do, because it’s really neat. And you don’t even need an index to fix it. Anyway, that was, that was a short demo of this cool new, well, I keep saying new, this cool thing that I don’t see enough people talking about when they’re looking through execution plans.
And I hope that you watch this video and you start looking at this when you start looking at your actual plans, too. Thanks, and I’ll see you hopefully again soon, maybe. I don’t know.
It’s gearing up to be a weird weekend.
Video Summary
In this video, I share one of my favorite features in SQL Server execution plans that often goes unnoticed but can provide invaluable insights into query performance. I dive into the actual time statistics property, which allows you to see exactly how long each operator ran for without needing live query plans. By highlighting examples from a recent podcast and demonstrating with a practical query plan, I show how this feature can pinpoint where your queries are spending most of their time—whether it’s on sorting or other operations—and help identify areas for optimization. If you’re curious about optimizing your SQL Server queries or just want to understand execution plans better, make sure to check out the pre-con I’ll be giving at SQL Bits and start exploring this feature in your own plans!
Full Transcript
What’s up? Erik Darling here with Erik Darling Data, the official sticker of my company, or the official company of my stickers, I guess, I don’t know, whatever. I’m recording a quick video today to talk about one of my favorite new features, or not even new, but one of my favorite features that I don’t see enough people talking about when they’re looking at query plans. And I’ve been watching this podcast called Drink Champs, which is awesome, and it’s just like all interviews with rap dudes from the 80s and 90s and stuff.
And I get jealous because when they record their thing, they get to be like, make some noise! And they have like air horns. All I have is this lame can of compressed air. So when I do make some noise, it’s just… It doesn’t have the same effect. And I think next video I might try to get an air horn in here so that I can make some noise too.
But, so anyway, what I’m going to show you is actually a little bit of a preview from my pre-con that I have coming up at SQL Bits. And I’m really looking forward to that. I’m getting a little nervous because it’s like the Saturday and it’s, man, it’s creeping up. Whew! It’s so close.
But, so one thing that I’m going to be talking about in the pre-con is this cool thing in execution plans that shows you how long an operator kind of ran for. So we have this query, right? Now we have this query plan. And there’s a whole bunch of stuff in it.
And there’s a whole lot of stuff that could be slow. If you look down the bottom of the screen, let me zoom in a little bit down here, we can see this dog ran for 29 seconds. 29! And I know people will be like, well turn on live query plans, rerun it.
Well I don’t want to turn on live query plans, I just want to get my actual plan. And I want to see where I spent all my time. Now if I hit F4 on one of these operators, what’s going to pop up is this new window over on the side, the properties thing. And there’s a property in here called actual time statistics.
And when I open it up, not only can I see the actual CPU and elapsed time that I spend on an operator, but if I click these out, I can see how many rows ended up on threads. I can see if my parallelism got all skewed and stuff got all nasty. So we have this timing here.
So we can see that for this index scan, we spent about six and a half CPU seconds on it. And we spent, we use multiple CPUs to make things faster. And so we spent about one point, well, you know what, I’m going to round up and say 1.8 actual seconds on the index scan.
Right? And if we go down the line, and we look at all of these different operators, we proceed to different operators, we can start to see how much time we spent in different places. And we get over to this sort operator, whoo-wee!
We spent 19 seconds sorting data. That’s crazy. So 19 out of 29 seconds in this execution plan was just spent on this sort. And of course, this sort spills out to disk and it’s all nasty and gnarly.
And that thing spilled almost 1 million pages out to disk. 980,000 pages. That’s bonkers.
Of course, that took 19 seconds. That’s terrible. And as we go down the line, we’ll see different things for, we’ll see different timings. And the timing kind of adds up as you go down. So it wasn’t a full 19 seconds here, but there wasn’t really a whole lot else going on between that scan and that sort.
So we’re going to call that sort the majority of the time we spend in the query plan. Not every operator has this attribute. So if we look at the, if you look at the, sorry, the compute scalar over here, we don’t have that attribute.
And that’s why it disappears. But if you come back to the sequence project compute scalar, we’ll have our actual time statistics back. And we can look at our filter and we can see that as we go kind of to the left, the time will sort of add up.
But it resets in weird places. I haven’t quite figured out the entire dynamic of when things reset and when things change. It’s a little bit weird.
It’s a little bit weird and foreign to me. I don’t think it’s documented anywhere. So I’m going to, I’m going to refrain from making too many guesses. But as we click around, we can kind of see where different parts of the plan spent different amounts of time. And by the time we get to the very end here to this parallelism, where we gather all the streams together, we’re at about 28 seconds.
And then the sort will have us a little bit higher up a little bit closer to 20. So there was some time spent in the query to show us the results, right? So we had to show the results and format that.
But overall, the majority of the time was spent sorting all this data. Now, of course, you’re going to have to come to my pre-con to learn how we can fix this and make this not take 19 seconds. And maybe you, maybe, maybe I’ll see you there.
Or maybe I’ll see you when I, when I talk about this somewhere else, live and in person. I hope I do, because it’s really neat. And you don’t even need an index to fix it. Anyway, that was, that was a short demo of this cool new, well, I keep saying new, this cool thing that I don’t see enough people talking about when they’re looking through execution plans.
And I hope that you watch this video and you start looking at this when you start looking at your actual plans, too. Thanks, and I’ll see you hopefully again soon, maybe. I don’t know.
It’s gearing up to be a weird weekend.
Going Further
If this is the kind of SQL Server stuff you love learning about, you’ll love my training. Blog readers get 25% off the Everything Bundle — over 100 hours of performance tuning content. Need hands-on help? I offer consulting engagements from targeted investigations to ongoing retainers. Want a quick sanity check before committing to a full engagement? Schedule a call — no commitment required.
Sometimes, the optimizer can take a query with a complex where clause, and turn it into two queries.
This only happens up to a certain point in complexity, and only if you have really specific indexes to allow these kinds of plan choices.
Here’s a haphazard query:
SELECT COUNT(*) AS records
FROM dbo.Posts AS p
WHERE (
           p.PostTypeId = 1
       AND p.AcceptedAnswerId <> 0
       AND p.CommentCount > 5
       AND p.CommunityOwnedDate IS NULL
       AND p.FavoriteCount > 0
      )
OR   (
          p.PostTypeId = 2
      AND p.CommentCount > 1
      AND p.LastEditDate IS NULL
      AND p.Score > 5
      AND p.ParentId = 0
     )
AND (p.ClosedDate IS NULL);
There’s a [bunch of predicates], an OR, then a [bunch of predicates]. Since there’s some shared spaced, we can create an okay general index.
It’s pretty wide, and it may not be the kind of index I’d normally create, unless I really had to.
CREATE INDEX whatever
    ON dbo.Posts (PostTypeId, CommentCount, ParentId)
         INCLUDE(AcceptedAnswerId, FavoriteCount, LastEditDate, Score, ClosedDate, CommunityOwnedDate);
It covers every column we’re using. It’s a lot. But I had to do it to show you this.
Computer Love
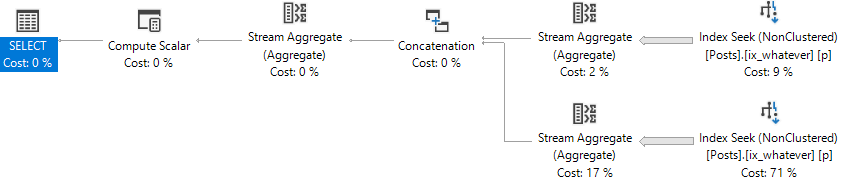
The optimizer took each separate group of predicates, and turned it into a separate index access, with a union operator.
It’s like if you wrote two count queries, and then counted the results of both.
But With A Twist
Let’s tweak the where clause a little bit.
SELECT COUNT(*) AS records
FROM dbo.Posts AS p
WHERE (
           p.PostTypeId = 1
       AND p.AcceptedAnswerId <> 0
       AND p.CommentCount > 5
       OR p.CommunityOwnedDate IS NULL --This is an OR now
       AND p.FavoriteCount > 0
      )
OR   (
          p.PostTypeId = 2
      AND p.CommentCount > 1
      AND p.LastEditDate IS NULL
      OR p.Score > 5 -- This is an OR now
      AND p.ParentId = 0
     )
AND (p.ClosedDate IS NULL)
Wham!
We don’t get the two seeks anymore. We get one big scan.
Is One Better?
The two seek plan has this profile:
Table 'Posts'. Scan count 10, logical reads 30678
Table 'Worktable'. Scan count 0, logical reads 0
Table 'Workfile'. Scan count 0, logical reads 0

 SQL Server Execution Times:
   CPU time = 439 ms,  elapsed time = 108 ms.
Here’s the scan plan profile:
Table 'Posts'. Scan count 5, logical reads 127472

 SQL Server Execution Times:
   CPU time = 4624 ms,  elapsed time = 1617 ms.
In this case, the index union optimization works in our favor.
We can push the optimizer towards a plan like that by breaking up complicated where clauses.
SELECT COUNT(*)
FROM (
SELECT 1 AS x
FROM dbo.Posts AS p
WHERE (
           p.PostTypeId = 1
       AND p.AcceptedAnswerId <> 0
       AND p.CommentCount > 5
       AND p.CommunityOwnedDate IS NULL
       AND p.FavoriteCount > 0
      )

UNION ALL

SELECT 1 AS x
FROM dbo.Posts AS p
WHERE (
          p.PostTypeId = 2
      AND p.CommentCount > 1
      AND p.LastEditDate IS NULL
      AND p.Score > 5
      AND p.ParentId = 0
     )
AND (p.ClosedDate IS NULL)
) AS x
Et voila!
Chicken Leg
Which has this profile:
Table 'Posts'. Scan count 2, logical reads 30001

 SQL Server Execution Times:
   CPU time = 329 ms,  elapsed time = 329 ms.
Beat My Guest
The optimizer is full of all sorts of cool tricks.
The better your indexes are, and the more clearly you write your queries, the more of those tricks you might see it start using
Thanks for reading!
Going Further
If this is the kind of SQL Server stuff you love learning about, you’ll love my training. Blog readers get 25% off the Everything Bundle — over 100 hours of performance tuning content. Need hands-on help? I offer consulting engagements from targeted investigations to ongoing retainers. Want a quick sanity check before committing to a full engagement? Schedule a call — no commitment required.
CREATE INDEX ix_fraud ON dbo.Votes ( CreationDate );

SELECT *
FROM   dbo.Votes AS v
WHERE  v.CreationDate >= '20101230';

SELECT *
FROM   dbo.Votes AS v
WHERE  v.CreationDate >= '20101231';
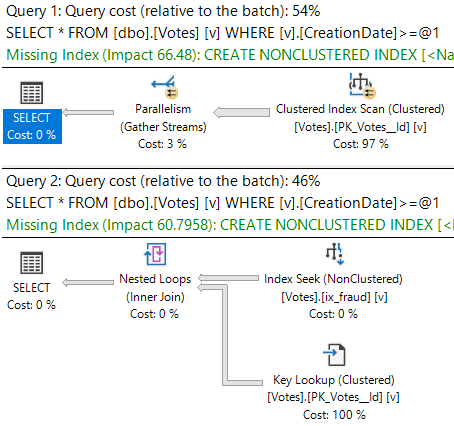
What a difference a day makes to a query plan!
Curse the head
Hard To Digest
Let’s paramaterize that!
DECLARE @creation_date DATETIME = '20101231';
DECLARE @sql NVARCHAR(MAX) = N''

SET @sql = @sql + N'
SELECT *
FROM   dbo.Votes AS v
WHERE  v.CreationDate >= @i_creation_date;
'

EXEC sys.sp_executesql @sql,
                       N'@i_creation_date DATETIME',
                       @i_creation_date = @creation_date;
This’ll give us the key lookup plan you see above. If I re-run the query and use the 2010-12-30 date, we’ll re-use the key lookup plan.
That’s an example of how parameters are sniffed.
Sometimes, that’s not a good thing. Like, if I passed in 2008-12-30, we probably wouldn’t like a lookup too much.
One common “solution” to parameter sniffing is to tack a recompile hint somewhere.
Recently, I saw someone use it like this:
DECLARE @creation_date DATETIME = '20101230';
DECLARE @sql NVARCHAR(MAX) = N''

SET @sql = @sql + N'
SELECT *
FROM   dbo.Votes AS v
WHERE  v.CreationDate >= @i_creation_date;
'

EXEC sys.sp_executesql @sql,
                       N'@i_creation_date DATETIME',
                       @i_creation_date = @creation_date
                       WITH RECOMPILE;
Which… gives us the same plan. That doesn’t recompile the query that sp_executesql runs.
You can only do that by adding OPTION(RECOMPILE) to the query, like this:
SET @sql = @sql + N'
SELECT *
FROM   dbo.Votes AS v
WHERE  v.CreationDate >= @i_creation_date
OPTION(RECOMPILE);
'
A Dog Is A Cat
Chalk this one up to “maybe it wasn’t parameter sniffing” in the first place.
I don’t usually advocate for jumping right to recompile, mostly because it wipes the forensic trail from the plan cache.
There are some other potential issues, like plan compilation overhead, and there have been bugs around it in the past.
Thanks for reading!
Going Further
If this is the kind of SQL Server stuff you love learning about, you’ll love my training. Blog readers get 25% off the Everything Bundle — over 100 hours of performance tuning content. Need hands-on help? I offer consulting engagements from targeted investigations to ongoing retainers. Want a quick sanity check before committing to a full engagement? Schedule a call — no commitment required.
One is the loneliest number. Sometimes it’s also the hardest number of rows to get, depending on how you do it.
In this video, I’ll show you how a TOP 1 query can perform much differently from a query where you generate row numbers and look for the first one.
Thanks for watching!
Video Summary
In this video, I delve into an interesting performance discrepancy between two queries that produce the same results but exhibit vastly different execution times. The primary query uses a `CROSS APPLY` with `TOP 1`, which surprisingly took over a minute to return just 101 rows, despite minimal logical reads on the involved tables. By examining the execution plan and statistics, I highlight how an index spool operator was created behind the scenes by SQL Server, significantly impacting performance due to its single-threaded nature even in a parallel query context. To contrast this, I demonstrate a slightly modified version of the query that uses `ROW_NUMBER` instead, achieving a much faster execution time with similar logical reads but vastly reduced CPU and elapsed times. This comparison underscores how simple query rewrites can have substantial performance benefits.
Full Transcript
Howdy folks, Erik Darling here with Erik Darling Data because Brent is lazy. And I was kind of enjoying my Saturday afternoon and writing some blog posts when I came across what I thought was an interesting difference between two queries that are written slightly differently, give you the same results but quite different performance. So I wanted to talk about that with you and unfortunately to talk about that with you I have to put this drink down to operate the computer. So, but that’s okay. because it’s a quick video and hopefully no one will notice. Now, I have this query here and the whole point of the query is to get the top 100 users by reputation and their most recent badge. And to do that I’m using cross apply with the top one over to the badges table. And if you look down in the corner you can probably see that this query ran for a little over a minute to return those 101 rows. That’s a pretty long time for not a lot of data.
Now, we can figure out why when we start looking at some different aspects of the query. And by different aspects I mean what happened with statistics time and IO and what happened in the query plan. Now, the CPU and elapsed time are almost the same which is a little bit weird because this is a parallel plan. Usually the whole point of a parallel plan is to use multiple threads to cut down on the total elapsed time. So you sacrifice using extra CPU to make the query overall run quicker. And you can also see that we didn’t do a lot of work against users or badges.
The users table we did 44,000 logical reads and the badges table we did about 50,000 logical reads. That’s not a lot of reads. The other thing we’re running into though is that we have this work table.
And this work table does a ton of logical reads. That’s about 24 million. So we have to ask ourselves where that came from.
And if we look over at the execution plan, it’ll become a little bit more obvious. Well, it’s really obvious to me and now it’s going to be obvious to you too. That work table comes from this index spool operator.
SQL Server wanted an index so badly on this data that it created an index behind your back up in tempdb. And it didn’t ask for an index. If you look at this top line here, there is no missing index request.
If we go and we look in the execution plan XML, there will be no missing index request. There is just this query running where SQL Server says, I’m going to create an index for you, you lazy bad DBA. What really stinks about this index spool?
Well, there’s a couple things that stink about it. One is that after this query runs, SQL Server will throw it away. And if this query runs again, or if this query runs a million times, every time this query runs, this spool will get created and thrown away. But what’s particularly nasty about these index spools is that if we go look at the properties, and we look at where all the rows line up across the parallel threads in the query, they all end up on one.
And it doesn’t matter how big this table is. It doesn’t matter, like if you use a different table, if I use seven different tables. Index spools build the index behind them single threaded.
That’s just the way it goes. So all eight million rows end up on one single thread. In this case, it’s thread three.
If I ran it a bunch of different times, they might end all end up on one different thread, but they would all always end up on one thread. That’s no good. We don’t like that.
And that’s basically what made this parallel query run like a serial query. Because this whole unit of work is done serially. And this is really where we spent the majority of the time in the query.
Well, that stinks. And you see this pretty frequently, specifically with cross-apply with a top one. And it’s because the optimizer can’t really unroll that.
And what I mean by unroll that is just turn it into a regular join. It’s going to use like kind of like the literal translation of cross-apply to go get a row and apply it to what’s down here. The optimizer is free to transform that into a regular join, but it doesn’t, especially when a top is involved.
Now, let’s contrast that with a query that’s written slightly differently. It’s still going to return the same results, but we’re going to use row number instead. We’re even still going to use cross-apply.
And we’re going to select the user ID and the name from the badges table. But this time we’re going to generate a row number over the same columns that we generated the top one with. And then we’re going to end up filtering out the results to only where row number equals one.
Now, remember that first query took a minute and three seconds to run. And if we go and execute this, it will be significantly faster. I forget how fast, but long enough for me to take a sip.
Now, that took six seconds. Why did that only take six seconds? Why did we end up with like, you know, you can see that it’s the same amount of reads here, the 44,000 and 49,000.
But for the CPU time and elapsed time, we did way better. That’s about, you know, there was like a tenth of the time. One percent of the time.
I’m not good. I’m not good at math no matter what. It doesn’t matter if it’s Saturday morning or not. If we look over in the execution plan, this plan is also parallel. But we don’t have any spooling operators.
You know, we, in this case, the optimizer was free to take that cross supply. And rather than do a nested loops row by row join, it was free to transform that into a hash join right here. And when we went and generated the row number over all the results of the badges table partitioned by user ID and ordered by the date column, we filtered out all of those rows, all of the rows that we weren’t using with this filter operator pretty early on.
So we still did it. And I’m not saying that this query is perfect and that we couldn’t tune things better and that we couldn’t make things better for this query. But it just goes to show you that sometimes a pretty simple rewrite can have pretty profound effects on a query.
And that, you know, sometimes that cross-apply with top is not always the best form of a query that can be written. Anyway, I’m going to go get back to the rest of this. I hope you enjoyed this.
I hope you learned something. And I will see you, I don’t know, maybe, maybe, maybe I’ll record something later that I won’t remember. I don’t know. We’ll see. Thanks for watching.
Video Summary
In this video, I delve into an interesting performance discrepancy between two queries that produce the same results but exhibit vastly different execution times. The primary query uses a `CROSS APPLY` with `TOP 1`, which surprisingly took over a minute to return just 101 rows, despite minimal logical reads on the involved tables. By examining the execution plan and statistics, I highlight how an index spool operator was created behind the scenes by SQL Server, significantly impacting performance due to its single-threaded nature even in a parallel query context. To contrast this, I demonstrate a slightly modified version of the query that uses `ROW_NUMBER` instead, achieving a much faster execution time with similar logical reads but vastly reduced CPU and elapsed times. This comparison underscores how simple query rewrites can have substantial performance benefits.
Full Transcript
Howdy folks, Erik Darling here with Erik Darling Data because Brent is lazy. And I was kind of enjoying my Saturday afternoon and writing some blog posts when I came across what I thought was an interesting difference between two queries that are written slightly differently, give you the same results but quite different performance. So I wanted to talk about that with you and unfortunately to talk about that with you I have to put this drink down to operate the computer. So, but that’s okay. because it’s a quick video and hopefully no one will notice. Now, I have this query here and the whole point of the query is to get the top 100 users by reputation and their most recent badge. And to do that I’m using cross apply with the top one over to the badges table. And if you look down in the corner you can probably see that this query ran for a little over a minute to return those 101 rows. That’s a pretty long time for not a lot of data.
Now, we can figure out why when we start looking at some different aspects of the query. And by different aspects I mean what happened with statistics time and IO and what happened in the query plan. Now, the CPU and elapsed time are almost the same which is a little bit weird because this is a parallel plan. Usually the whole point of a parallel plan is to use multiple threads to cut down on the total elapsed time. So you sacrifice using extra CPU to make the query overall run quicker. And you can also see that we didn’t do a lot of work against users or badges.
The users table we did 44,000 logical reads and the badges table we did about 50,000 logical reads. That’s not a lot of reads. The other thing we’re running into though is that we have this work table.
And this work table does a ton of logical reads. That’s about 24 million. So we have to ask ourselves where that came from.
And if we look over at the execution plan, it’ll become a little bit more obvious. Well, it’s really obvious to me and now it’s going to be obvious to you too. That work table comes from this index spool operator.
SQL Server wanted an index so badly on this data that it created an index behind your back up in tempdb. And it didn’t ask for an index. If you look at this top line here, there is no missing index request.
If we go and we look in the execution plan XML, there will be no missing index request. There is just this query running where SQL Server says, I’m going to create an index for you, you lazy bad DBA. What really stinks about this index spool?
Well, there’s a couple things that stink about it. One is that after this query runs, SQL Server will throw it away. And if this query runs again, or if this query runs a million times, every time this query runs, this spool will get created and thrown away. But what’s particularly nasty about these index spools is that if we go look at the properties, and we look at where all the rows line up across the parallel threads in the query, they all end up on one.
And it doesn’t matter how big this table is. It doesn’t matter, like if you use a different table, if I use seven different tables. Index spools build the index behind them single threaded.
That’s just the way it goes. So all eight million rows end up on one single thread. In this case, it’s thread three.
If I ran it a bunch of different times, they might end all end up on one different thread, but they would all always end up on one thread. That’s no good. We don’t like that.
And that’s basically what made this parallel query run like a serial query. Because this whole unit of work is done serially. And this is really where we spent the majority of the time in the query.
Well, that stinks. And you see this pretty frequently, specifically with cross-apply with a top one. And it’s because the optimizer can’t really unroll that.
And what I mean by unroll that is just turn it into a regular join. It’s going to use like kind of like the literal translation of cross-apply to go get a row and apply it to what’s down here. The optimizer is free to transform that into a regular join, but it doesn’t, especially when a top is involved.
Now, let’s contrast that with a query that’s written slightly differently. It’s still going to return the same results, but we’re going to use row number instead. We’re even still going to use cross-apply.
And we’re going to select the user ID and the name from the badges table. But this time we’re going to generate a row number over the same columns that we generated the top one with. And then we’re going to end up filtering out the results to only where row number equals one.
Now, remember that first query took a minute and three seconds to run. And if we go and execute this, it will be significantly faster. I forget how fast, but long enough for me to take a sip.
Now, that took six seconds. Why did that only take six seconds? Why did we end up with like, you know, you can see that it’s the same amount of reads here, the 44,000 and 49,000.
But for the CPU time and elapsed time, we did way better. That’s about, you know, there was like a tenth of the time. One percent of the time.
I’m not good. I’m not good at math no matter what. It doesn’t matter if it’s Saturday morning or not. If we look over in the execution plan, this plan is also parallel. But we don’t have any spooling operators.
You know, we, in this case, the optimizer was free to take that cross supply. And rather than do a nested loops row by row join, it was free to transform that into a hash join right here. And when we went and generated the row number over all the results of the badges table partitioned by user ID and ordered by the date column, we filtered out all of those rows, all of the rows that we weren’t using with this filter operator pretty early on.
So we still did it. And I’m not saying that this query is perfect and that we couldn’t tune things better and that we couldn’t make things better for this query. But it just goes to show you that sometimes a pretty simple rewrite can have pretty profound effects on a query.
And that, you know, sometimes that cross-apply with top is not always the best form of a query that can be written. Anyway, I’m going to go get back to the rest of this. I hope you enjoyed this.
I hope you learned something. And I will see you, I don’t know, maybe, maybe, maybe I’ll record something later that I won’t remember. I don’t know. We’ll see. Thanks for watching.
Going Further
If this is the kind of SQL Server stuff you love learning about, you’ll love my training. Blog readers get 25% off the Everything Bundle — over 100 hours of performance tuning content. Need hands-on help? I offer consulting engagements from targeted investigations to ongoing retainers. Want a quick sanity check before committing to a full engagement? Schedule a call — no commitment required.
When you’re reading query plans, you can be faced with an overwhelming amount of information, and some of it is only circumstantially helpful.
Sometimes when I’m explaining query plans to people, I feel like a mechanic (not a Machanic) who just knows where to go when the engine makes a particular rattling noise.
That’s not the worst thing. If you know what to do when you hear the rattle next time, you learned something.
One particular source of what can be a nasty rattle is query plan operators that execute a lot.
Busy Killer Bees
I’m going to talk about my favorite example, because it can cause a lot of confusion, and can hide a lot of the work it’s doing behind what appears to be a friendly little operator.
Something to keep in mind is that I’m looking at the actual plans. If you’re looking at estimated/cached plans, the information you get back may be inaccurate, or may only be accurate for the cached version of the plan. A query plan reused by with parameters that require a different amount of work may have very different numbers.
Nested Loops
Let’s look at a Key Lookup example, because it’s easy to consume.
CREATE INDEX ix_whatever ON dbo.Votes(VoteTypeId);

SELECT v.VoteTypeId, v.BountyAmount
FROM dbo.Votes AS v
WHERE v.VoteTypeId = 8
AND v.BountyAmount = 100;
You’d think with “loops” in the name, you’d see the number of executions of the operator be the number of loops SQL Server thinks it’ll perform.
But alas, we don’t see that.
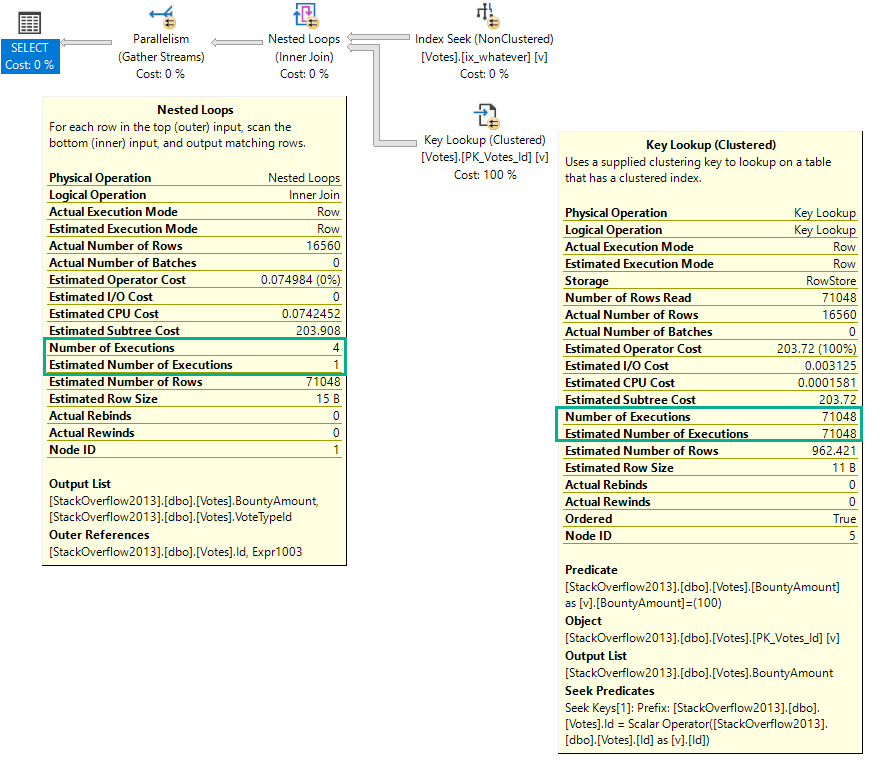
In a parallel plan, you may see the number of executions equal to the number of threads the query uses for the branch that the Nested Loops join executes in.
For instance, the above query runs at MAXDOP four, and coincidentally uses four threads for the parallel nested loops join. That’s because with parallel nested loops, each thread executes a serial version of the join independently. With stuff like a parallel scan, threads work more cooperatively.
Too Much Speed
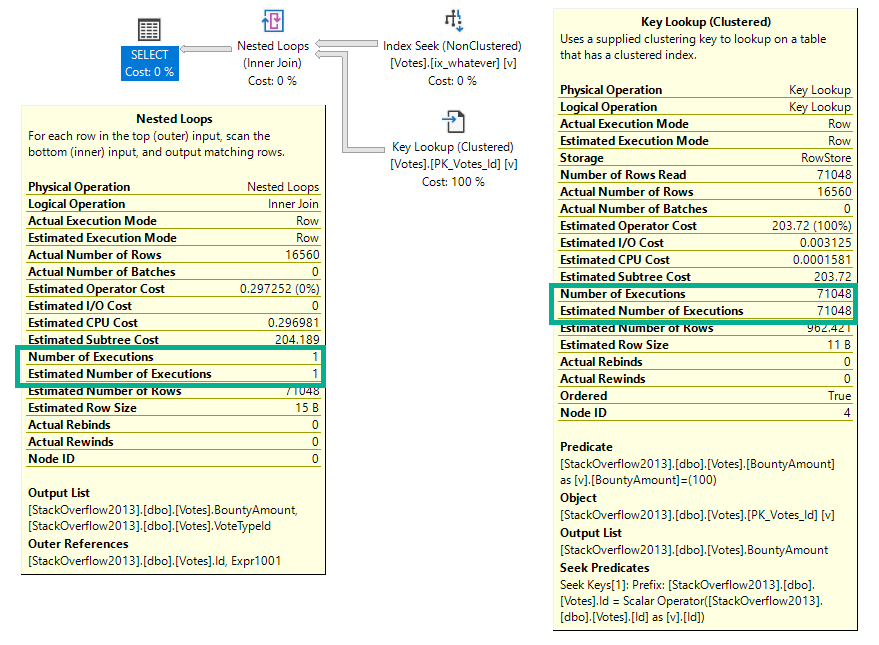
If we re-run the same query at MAXDOP 1, the number of executions drops to 1 for the nested loops operator, but remains at 71,048 for the key lookup.
Beat Feet
But here we are at the very point! It’s the child operators of the nested loops join that show how many executions there were, not the nested loops join itself.
Weird, right?
Thanks for reading!
Going Further
If this is the kind of SQL Server stuff you love learning about, you’ll love my training. Blog readers get 25% off the Everything Bundle — over 100 hours of performance tuning content. Need hands-on help? I offer consulting engagements from targeted investigations to ongoing retainers. Want a quick sanity check before committing to a full engagement? Schedule a call — no commitment required.