SQL Server Scalar UDF Inlining And Security Functions

You’ve Got No Security


Despite being a bouncer for many years, I have no interest at all in security.

Users, logins, roles, grant, deny. Not for me. I’ve seen those posters, and they’re terrifying.

Gimme 3000 lines of dynamic SQL any day.

This is a slightly different take on yesterday’s post, which is also a common problem I see in queries today.

Someone wrote a function to figure out if a user is trusted, or has the right permissions, and sticks it in a predicate — it could be a join or where clause.

High Finance


Stack Overflow isn’t exactly a big four accounting firm, but for some reason big four accounting firms don’t make their databases public under Creative Commons licensing.

So uh. Here we are.

And here’s our query.

DECLARE @UserId INT = 22656, --2788872, 22656
		@SQL NVARCHAR(MAX) = N'';

SET @SQL = @SQL + N'
SELECT    p.Id,
          p.AcceptedAnswerId,
          p.AnswerCount,
          p.CommentCount,
          p.CreationDate,
          p.FavoriteCount,
          p.LastActivityDate,
          p.OwnerUserId,
          p.Score,
          p.ViewCount,
          v.BountyAmount,
          c.Score
FROM      dbo.Posts AS p
LEFT JOIN dbo.Votes AS v
    ON p.Id = v.PostId
	AND dbo.isTrusted(@iUserId) = 1
LEFT JOIN dbo.Comments AS c
    ON p.Id = c.PostId
WHERE     p.PostTypeId = 5;
';

EXEC sys.sp_executesql @SQL,
                       N'@iUserId INT',
					   @iUserId = @UserId;

There’s a function in that join to the Votes table. This is what it looks like.

CREATE OR ALTER FUNCTION dbo.isTrusted ( @UserId INT )
RETURNS BIT
WITH SCHEMABINDING, RETURNS NULL ON NULL INPUT
AS
    BEGIN
        DECLARE @Bitty BIT;

        SELECT @Bitty = CASE WHEN u.Reputation >= 10000 
		                     THEN 1 
							 ELSE 0 
					    END
        FROM   dbo.Users AS u
        WHERE  u.Id = @UserId;
        
		RETURN @Bitty;

    END;
GO

Bankrupt


There’s not a lot of importance in the indexes, query plans, or reads.

What’s great about this is that you don’t need to do a lot of analysis — we can look purely at runtimes.

It also doesn’t matter if we run the query for a trusted (22656) or untrusted (2788872) user.

In compat level 140, the runtimes look like this:

ALTER DATABASE StackOverflow2013 SET COMPATIBILITY_LEVEL = 140;

 SQL Server Execution Times:
   CPU time = 7219 ms,  elapsed time = 9925 ms.

 SQL Server Execution Times:
   CPU time = 7234 ms,  elapsed time = 9903 ms.

In compat level 150, the runtimes look like this:

ALTER DATABASE StackOverflow2013 SET COMPATIBILITY_LEVEL = 150;

 SQL Server Execution Times:
   CPU time = 2734 ms,  elapsed time = 781 ms.

 SQL Server Execution Times:
   CPU time = 188 ms,  elapsed time = 142 ms.

In both runs, the trusted user is first, and the untrusted user is second.

Sure, the trusted user query ran half a second longer, but that’s because it actually had to produce data in the join.

One important thing to note is that the query was able to take advantage of parallelism when it should have (CPU time is higher than elapsed time).

In older versions (or even lower compat levels), scalar valued functions would inhibit parallelism. Now they don’t when they’re inlined.

Thanks for reading!

Going Further


If this is the kind of SQL Server stuff you love learning about, you’ll love my training. Blog readers get 25% off the Everything Bundle — over 100 hours of performance tuning content. Need hands-on help? I offer consulting engagements from targeted investigations to ongoing retainers. Want a quick sanity check before committing to a full engagement? Schedule a call — no commitment required.
Common Parameter Sniffing In Entity Framework Queries For SQL Server

Still Not A Developer


I’m going to use a funny example to show you something weird that I see often in EF queries.

I’m not going to use EF to do it, because I have no idea how to. Please use your vast imagination.

In this case, I’m going to figure out if a user is trusted, and only if they are will I show them certain information.

Here goes!

Trust Bust


The first part of the query establishes if the user is trusted or not.

I think this is silly because no one should ever trust users.

DECLARE @UserId INT = 22656, --2788872
        @PostId INT = 11227809,
		@IsTrusted BIT = 0,
		@SQL NVARCHAR(MAX) = N'';

SELECT @IsTrusted = CASE WHEN u.Reputation >= 10000 
                         THEN 1 
						 ELSE 0 
				    END
FROM   dbo.Users AS u
WHERE  u.Id = @UserId;

The second part will query and join a few tables, but one of the joins (to the Votes table) will only run if a user is trusted.

SET @SQL = @SQL + N'
SELECT p.Title, p.Score,
       c.Text, c.Score,
	   v.*
FROM dbo.Posts AS p
LEFT JOIN dbo.Comments AS c
    ON p.Id = c.PostId
LEFT JOIN dbo.Votes AS v
    ON p.Id = v.PostId
    AND 1 = @iIsTrusted
WHERE p.Id = @iPostId
AND   p.PostTypeId = 1;
';

EXEC sys.sp_executesql @SQL,
                       N'@iIsTrusted BIT, @iPostId INT',
					   @iIsTrusted = @IsTrusted,
					   @iPostId = @PostId;

See where 1 = @iIsTrusted? That determines if the join runs at all.

Needless to say, adding an entire join in to the query might slow things down if we’re not prepared.

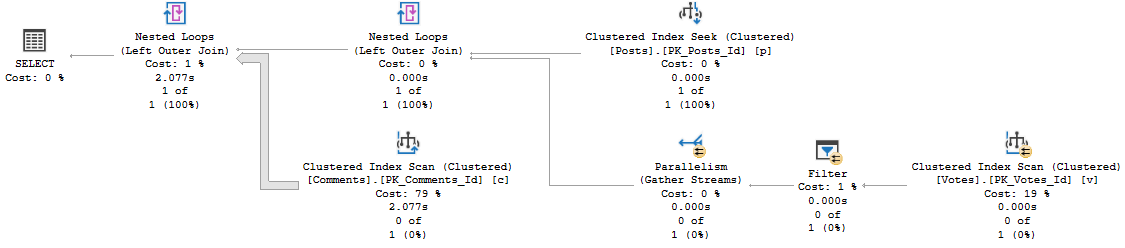
First I’m going to run it for user 2788872, who isn’t trusted.

This query finishes rather quickly (2 seconds), and has an interesting operator in it.

SQL Server Query Plan
Henanigans, S.
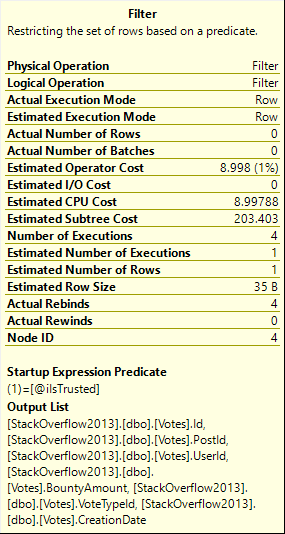
SQL Server Query Plan Tool Tip
Pump the brakes

The filter has a startup expression in it, which means it’s sort of a gatekeeper, here. If the parameter is 0, we don’t touch Votes.

If it’s 1… Boy, do we touch Votes. This is another case of where cached plans can lie to us.

Rep Up


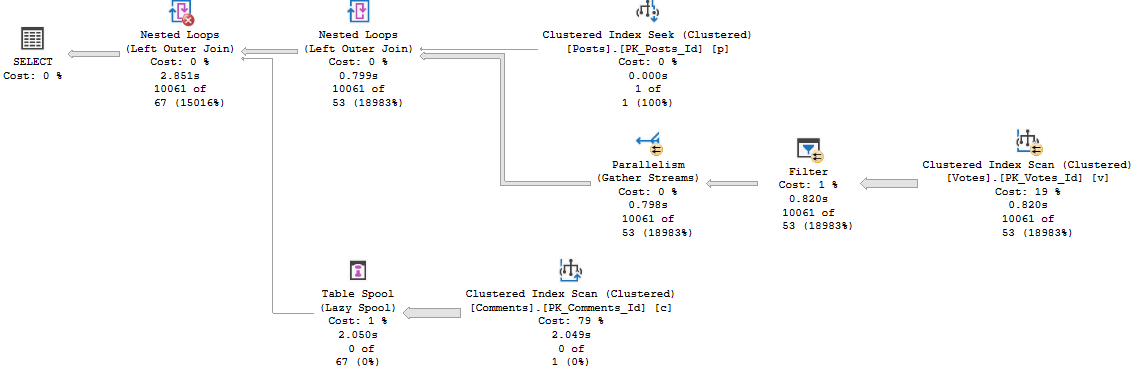
If we run this for user 22656 (Jon Skeet) afterwards, we will definitely need to touch the Votes table.

I grabbed the Live Query Plan to show you just how little progress it makes over 5 minutes.

SQL Server Query Plan
Dirge

The cached plan will look identical. And looking at the plan, it’ll be hard to believe there’s any way it could run >5 minutes.

SQL Server Query Plan
CONFESS

If we clear the cache and run this for 22656 first, the plan runs relatively quickly, and looks a little different.

SQL Server Query Plan
Bag of Ice

Running it for an untrusted user has a similar runtime. It’s not great, but it’s the better of the two.

Fixing It?


It’s difficult to control EF queries with much granularity.

You could branch the application code to run two different queries based on if a user is trusted.

In a perfect world, you’d never even consider that join at all, and avoid having to worry about it.

On the plus side (at least in this case), the good plan for trusted users runs in the same time as the good plan for untrusted users, even though they’re different.

If you’re feeling extra confident, you can try adding an OPTIMIZE FOR hint to your code, or implementing a plan guide.

Thanks for reading!

Going Further


If this is the kind of SQL Server stuff you love learning about, you’ll love my training. Blog readers get 25% off the Everything Bundle — over 100 hours of performance tuning content. Need hands-on help? I offer consulting engagements from targeted investigations to ongoing retainers. Want a quick sanity check before committing to a full engagement? Schedule a call — no commitment required.

The Waiting Life Of A SQL Server Query

Smoking Ain’t Allowed In School


While working on my new training, part of what I want to show people is how to match what happens in a query plan to the type of wait stats they’ll see on their servers.

Take this query plan for example:

SQL Server Query Plan
Nose Boop™

There are THINGS GOING ON HERE! Scans, parallelism, sorting, spilling.

What do the waits look like for this query?

SQL Server Wait Stats

Spy vs Spy


It’s fairly easy to focus in on what a session is doing using sys.dm_exec_session_wait_stats, though there are some caveats about when the numbers reset.

On my laptop, I can just open a new SSMS tab without worrying about connection pooling or any weird app stuff.

When I do, these are the waits I see while the query runs.

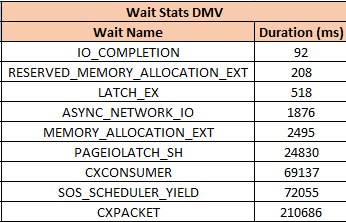
Every single one of those waits is accounted for by something that happened in the query plan (or its attributes).

Breakdown


Our pages weren’t in memory, so we read them from disk (PAGEIOLATCH_SH), we had to allocate buffer pool memory (MEMORY_ALLOCATION_EXT), we used parallelism (both CX waits), we needed memory to sort data (RESERVED_MEMORY_ALLOCATION_EXT), we didn’t get enough so we spilled (IO_COMPLETION), and we returned data to SSMS (ASYNC_NETWORK_IO).

LATCH_EX can be a lot of things. In a parallel plan, it can be associated with exchange buffers and the parallel page supplier.

The goal here is for you to both look at a server’s wait stats and come up with a mental image of the types of queries you’re going to see, and be able to tie query plan operators and attributes back to wait stats.

Thanks for reading!

SQL Server Joins With OR Clauses = ?

A Long Time Ago


I had to write some hand-off training about query tuning when I was starting a new job.

As part of the training, I had to explain why writing “complicated logic” could lead to poor plan choices.

So I did what anyone would do: I found a picture of a pirate, named him Captain Or, and told the story of how he got Oared to death for giving confusing ORders.

This is something that I unfortunately still see people doing quite a bit, and then throwing their hands up as queries run forever.

I’m going to show you a simple example of when this can go wrong, and also beg and plead for the optimizer team to do something about it.

Big Bully


“Write the query in the simplest way possible”, they said.

So we did, and we got this.

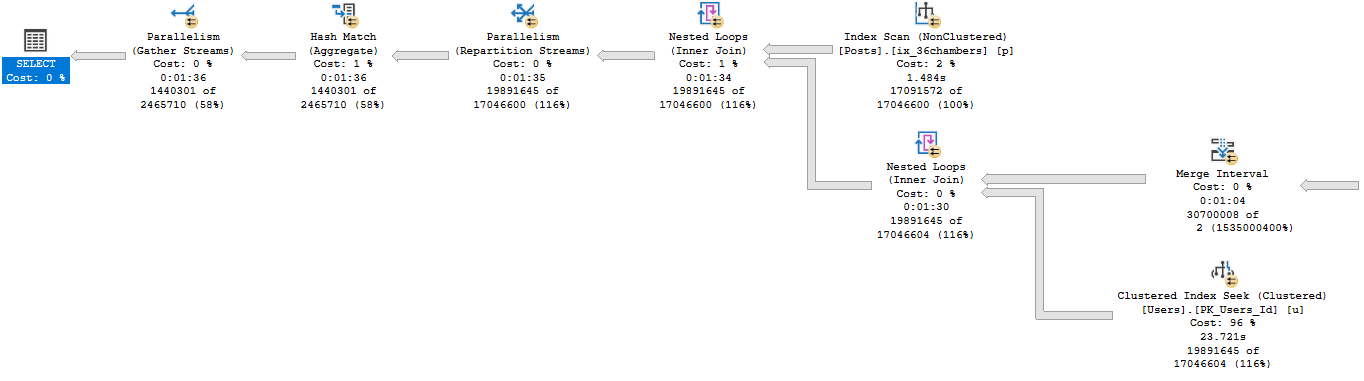
SELECT u.Id, MAX(p.Score)
FROM   dbo.Users AS u
JOIN   dbo.Posts AS p
    ON u.Id = p.OwnerUserId
    OR u.Id = p.LastEditorUserId
WHERE  p.PostTypeId IN (1, 2)
GROUP BY u.Id;

Note the OR in the join condition — we can match on either of those columns.

Here’s the index we created to make this SUPERFAST.

CREATE NONCLUSTERED INDEX 36chambers
    ON dbo.Posts ( OwnerUserId, LastEditorUserId, PostTypeId )
    INCLUDE ( Score );

If we’re good DBAs, still doing as we’re told, we’ll read the query plan from right to left.

The first section we’re greeted with is this:

SQL Server Query Plan
No Cardio

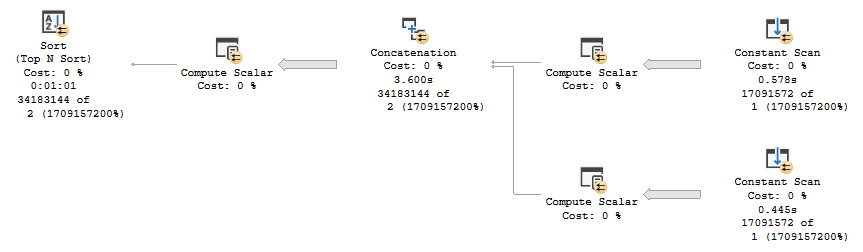
We spend a full minute organizing and ordering data. If you want to poke around, the plan XML is here.

The columns in the Compute Scalars are OwnerUserId and LastEditorUserId.

Next in the plan is this fresh hell:

SQL Server Query Plan
Squozed

24 seconds seeking into the Users table and joining that to the results of the Constant Scans, etc.

What’s a little confusing here is that the scan on the Posts table occurs on the outer side of Nested Loops.

It’s also responsible for feeding rows through the Constant Scans. That’s their data source.

Overall, this query takes 1:36 seconds to run.

My gripe with it is that it’s possible to rewrite this query in an obvious way to fix the problem.

Magick


Using a second join to Posts clears things up quite a bit.

SELECT u.Id, MAX(p.Score)
FROM   dbo.Users AS u
JOIN   dbo.Posts AS p
    ON u.Id = p.OwnerUserId
	AND p.PostTypeId IN (1, 2)
JOIN   dbo.Posts AS p2
    ON u.Id = p2.LastEditorUserId
	AND p2.PostTypeId IN (1, 2)  
GROUP BY u.Id;

I know, it probably sounds counterintuitive to touch a table twice.

Someone will scream that we’re doing more reads.

Someone else will faint at all the extra code we wrote.

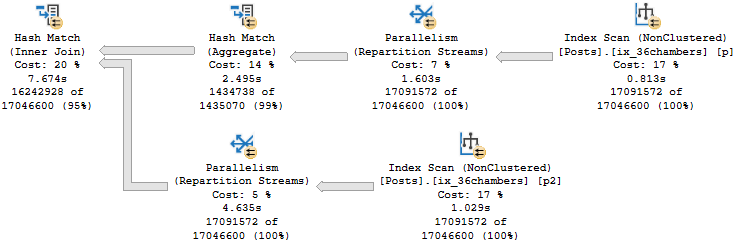
But when we run this query, it finishes in 10 seconds.

SQL Server Query Plan
That’s better!

This plan does something a bit different. It joins the nonclustered index we have on Posts to itself.

SQL Server Query Plan
Seminar

The optimizer has a rule that makes this possible, called Index Intersection.

Extra Magick


A more accurate description of what I’d want the optimizer to consider here would be the plan we get when we rewrite the query like this.

SELECT u.Id, MAX(p.Score)
FROM   dbo.Users AS u
CROSS APPLY
    (
        SELECT p.Score
        FROM   dbo.Posts AS p
        WHERE u.Id = p.OwnerUserId
        AND p.PostTypeId IN (1, 2)
        
        UNION ALL 
        
        SELECT p2.Score
        FROM  dbo.Posts AS p2
        WHERE u.Id = p2.LastEditorUserId
        AND p2.PostTypeId IN (1, 2)  
    ) AS p
GROUP BY u.Id;
SQL Server Query Plan
Mush.

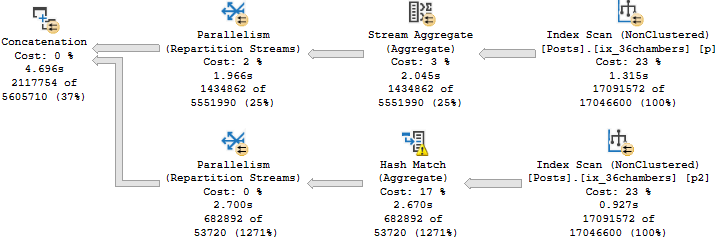
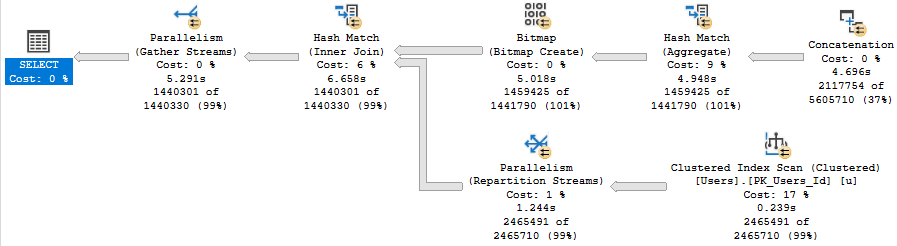
This query runs a bit faster than the second one (around 7 seconds), and the plan is a little different.

Rather than a Hash Join between the index on the Posts table, we have a Concatenation operator.

The rest of the plan looks like this:

SQL Server Query Plan
Yabadabadoo!

The optimizer has a rule that can produce this plan, too, called Index Union.

Problemagick


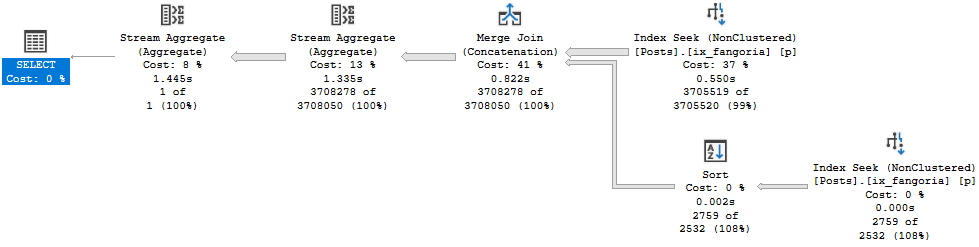
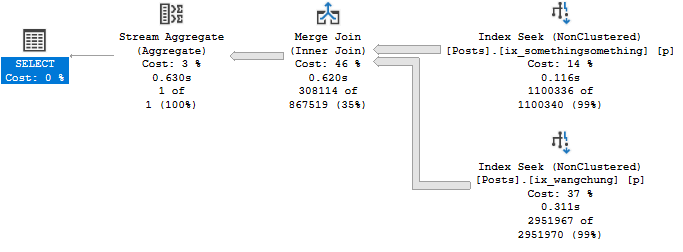
The thing is, these rules seem to be favored more with WHERE clauses than with JOINs.

CREATE INDEX ix_fangoria
    ON dbo.Posts(ClosedDate);

SELECT COUNT_BIG(*) AS records
FROM dbo.Posts AS p
WHERE p.ClosedDate IS NULL
OR p.ClosedDate >= '20170101'
AND 1 = (SELECT 1);
SQL Server Query Plan
Index Union
CREATE INDEX ix_somethingsomething 
    ON dbo.Posts(PostTypeId);

CREATE INDEX ix_wangchung 
    ON dbo.Posts(AcceptedAnswerId);

SELECT COUNT_BIG(*) AS records
FROM dbo.Posts AS p
WHERE p.PostTypeId = 1
AND p.AcceptedAnswerId = 0
AND 1 = (SELECT 1);
SQL Server Query Plan
Index Intersection

Knackered


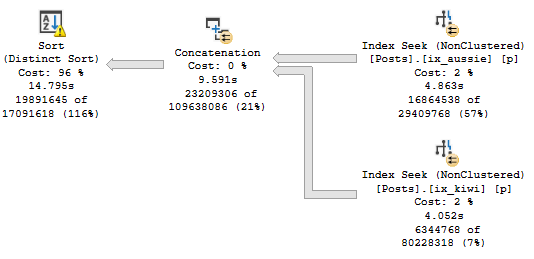
It is possible to get these kind of plans with joins, but not without join hints and a couple indexes.

CREATE INDEX aussie 
    ON dbo.Posts (OwnerUserId, PostTypeId, Score);

CREATE INDEX kiwi 
    ON dbo.Posts (LastEditorUserId, PostTypeId, Score);
SELECT u.Id, MAX(p.Score)
FROM   dbo.Users AS u
JOIN   dbo.Posts AS p
    WITH (FORCESEEK)
    ON u.Id = p.OwnerUserId
    OR u.Id = p.LastEditorUserId
WHERE  p.PostTypeId IN (1, 2)
GROUP BY u.Id;

There’s more background from, of course, Paul White, here and here.

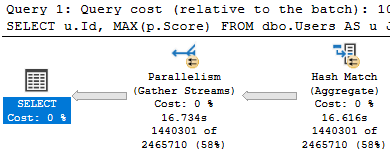
Even with Paul White ~*~Magick~*~, the hinted query runs for ~16 seconds.

If you remember, the Index Intersection plan ran for around 10 seconds, and the Index Union plan ran for around 7 seconds.

SQL Server Query Plan
2slow

This plan uses Index Union:

SQL Server Query Plan
Spillzo

Thanks for reading!

Going Further


If this is the kind of SQL Server stuff you love learning about, you’ll love my training. Blog readers get 25% off the Everything Bundle — over 100 hours of performance tuning content. Need hands-on help? I offer consulting engagements from targeted investigations to ongoing retainers. Want a quick sanity check before committing to a full engagement? Schedule a call — no commitment required.

Why is SYSDATETIME() slower than SYSUTCDATETIME() In SQL Server?

Consider the following code that calls SYSDATETIME() 10 million times in a loop:

GO

CREATE OR ALTER PROCEDURE #p_local AS
BEGIN
	SET NOCOUNT ON;

	DECLARE @dummy DATETIME2(7), @loops INT = 0;

	WHILE @loops <= 10000000
	BEGIN
		SET @dummy = SYSDATETIME();

		SET @loops = @loops + 1;
	END;
END;

GO

EXEC #p_local;

On my machine the code takes about 11.6 seconds to execute. Replacing SYSDATETIME() with SYSUTCDATETIME() makes the code take only 4.3 seconds to execute. Why is SYSUTCDATETIME() so much faster than SYSDATETIME()?

It’s always a CPU problem


Both while loops drive a CPU core to 100% while executing. Within SQL server, elapsed time nearly equals CPU. For this code, I wouldn’t expect waits, latches, or spinlocks to reveal any clues. Query plans, execution stats, and other DMVs are unlikely to help as well. One thing that could help is information about the internals of SYSDATETIME() and SYSUTCDATETIME(). There’s a little bit on books online:

SQL Server obtains the date and time values by using the GetSystemTimeAsFileTime() Windows API. The accuracy depends on the computer hardware and version of Windows on which the instance of SQL Server is running. The precision of this API is fixed at 100 nanoseconds. The accuracy can be determined by using the GetSystemTimeAdjustment() Windows API.

Probably all of the useful information is likely locked behind the vault at Microsoft. Fortunately, both SQL Server and the guest OS are happy to give us information about what SQL Server is using its CPU to do if we have the right public symbols and ask nicely. I know of four primary ways of doing this:

  1. A True Professional could use WinDbg (the cool kids pronounce it “wind bag”) or another debugger to step through the code of both functions. I don’t have the skills or patience to do that.
  2. DBCC STACKDUMP or sqldumper.exe can be used to create a filtered memory dump on demand. The problem with this approach is that it only provides a single snapshot and our functions execute very quickly.
  3. Extended events can provide callstacks for many events. I’m not aware of an extended event that would fire at the right times for this code.
  4. ETW tracing can provide a summary of call stacks during a sampled time period. Common choices are Windows Performance Recorder or PerfView.

Option 4 is exactly what we need. We can run a single query at a time that performs uniform work and we want to see where CPU time is spent during the entire query’s execution. My tool of choice is PerfView.

Revealing SQL Server’s secrets


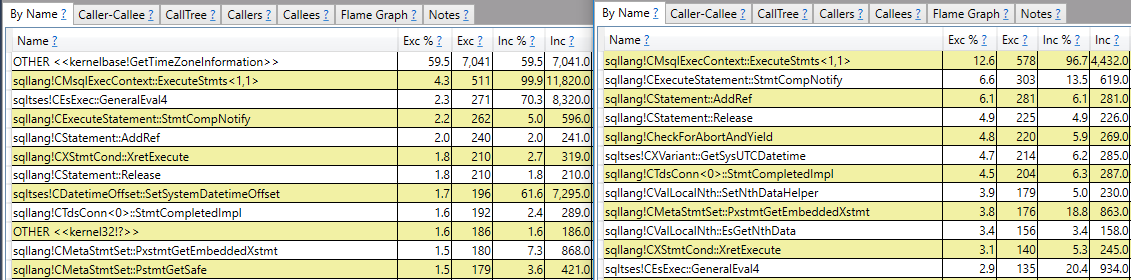
I used PerfView’s default settings and collected ETW profile data separately during both while loops. After resolving symbols and changing folding to 0, there’s a clear difference between SYSDATETIME() (on the left) and SYSUTCDATETIME() (on the right):

a40 perfview 1

kernelbase!GetTimeZoneInformation shows up with a high percentage for exclusive time for SYSDATETIME(). It does not show up at all for SYSUTCDATETIME(). In case it helps, here’s documention for a few of the column names:

Exc – The amount of cost (msec of CPU time) that can be attributed to the particular method itself (not any of its callees)
Exc % – The exclusive cost expressed as a percentage of the total cost of all samples.
Inc – The cost associated with this node as well as all its children (callees) recursively. The inclusive cost of the ROOT contains all costs.
Inc % – The inclusive cost expressed as a percentage of the total cost of all samples (will be 100% for the ROOT node)

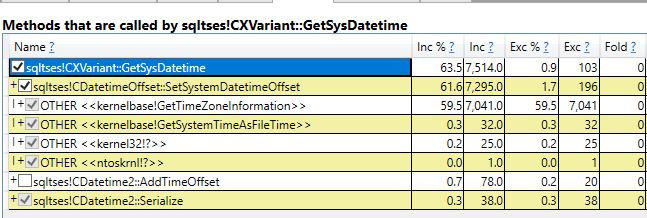
sqltses!CXVariant::GetSysDatetime sounds an awful lot like SYSDATETIME() to me. It also shows up in the right place in the stack to be a match. Drilling into the methods are called by it:

a40 getsysdatetime

Note that the call to kernelbase!GetTimeZoneInformation takes up nearly all CPU time. There’s also a call to kernelbase!GetSystemTimeAsFileTime that barely shows up as well.

Sharp-eyed readers might be wondering if SYSDATETIMEOFFSET() results in calls to sqltses!CDatetimeOffset::SetSystemDatetimeOffset. The answer is yes, but this is left as an exercise for the reader.

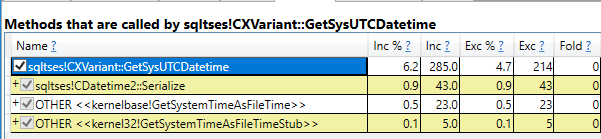
Again, sqltses!CXVariant::GetSysUTCDatetime sounds like awful lot like SYSUTCDATETIME() to me. Drilling into the methods are called by it:

a40 getsysUTCdatetime

Note the low percentage of inclusive time for the call. SYSUTCDATETIME() is so cheap to call that most of the CPU time is spent executing the loop code instead of that function. kernelbase!GetTimeZoneInformation does not show up at all. There’s is still a call to kernelbase!GetSystemTimeAsFileTime that barely shows up.

This is probably an oversimplification, but I think it’s fair to say that each call to SYSDATETIME() needs to get time zone information. This results in a call to kernelbase!GetTimeZoneInformation that is relatively expensive. There is no need to call that method for SYSUTCDATETIME().

Does this matter? It depends™


Database folks like answering questions with “it depends”. Regrettably, they don’t always provide sufficient or accurate details about what it depends on. I strive to not fall into that trap. For many queries the performance difference between the two functions won’t matter. Consider the following two batches:

DROP TABLE IF EXISTS #BENCHMARK_TIME_FUNCTIONS;

CREATE TABLE #BENCHMARK_TIME_FUNCTIONS (SAVED_DATETIME DATETIME2(7) NULL);

INSERT INTO #BENCHMARK_TIME_FUNCTIONS WITH (TABLOCK)
SELECT TOP (10000000) SYSDATETIME()
FROM master..spt_values t1
CROSS JOIN master..spt_values t2
CROSS JOIN master..spt_values t3
OPTION (MAXDOP 1);

GO

DROP TABLE IF EXISTS #BENCHMARK_TIME_FUNCTIONS;

CREATE TABLE #BENCHMARK_TIME_FUNCTIONS (SAVED_DATETIME DATETIME2(7) NULL);

INSERT INTO #BENCHMARK_TIME_FUNCTIONS WITH (TABLOCK)
SELECT TOP (10000000) SYSUTCDATETIME()
FROM master..spt_values t1
CROSS JOIN master..spt_values t2
CROSS JOIN master..spt_values t3
OPTION (MAXDOP 1);

SQL Server doesn’t need to execute the datetime functions once per row. If it did, we’d expect a run time difference of about 7 seconds between the two queries. Instead, they execute in nearly exactly the same amount of time. I think that the details about guarantees of this behavior were found on a Connect (RIP) comment.

The performance difference can make a difference when the function is used to profile code that executes row by row. Suppose that we have related SQL statements and we want to measure the execution time of just one of the statements by calculating the time difference before and after execution. I’m not saying that this is the best way of doing this analysis, but I suspect it to be a common technique. Below is an example stored procedure with one copy using SYSDATETIME() and the other using SYSUTCDATETIME():

GO

CREATE OR ALTER PROCEDURE #USE_SUPERIOR_AMERICAN_TIME AS
BEGIN
	DECLARE @start_time DATETIME2(7),
	@end_time DATETIME2(7),
	@total_microseconds BIGINT = 0,
	@loops INT = 0;

	SET NOCOUNT ON;

	DROP TABLE IF EXISTS dbo.OFFICIAL_STATEMENTS;
	CREATE TABLE dbo.OFFICIAL_STATEMENTS (OFFICIAL_STATEMENT VARCHAR(30));
	
	WHILE @loops <= 50000 BEGIN INSERT INTO dbo.OFFICIAL_STATEMENTS VALUES ('NO COLLUSION');
		IF @@ROWCOUNT > 0	
		BEGIN
			SET @start_time = SYSDATETIME();

			INSERT INTO dbo.OFFICIAL_STATEMENTS VALUES ('NO OBSTRUCTION');

			SET @end_time = SYSDATETIME();

			SET @total_microseconds = @total_microseconds + DATEDIFF(MICROSECOND, @start_time, @end_time);
		END;

		SET @loops = @loops + 1;
	END;

	SELECT @total_microseconds;
END;

GO

EXEC #USE_SUPERIOR_AMERICAN_TIME;

GO

CREATE OR ALTER PROCEDURE #USE_INFERIOR_EUROPEAN_TIME AS
BEGIN
	DECLARE @start_time DATETIME2(7),
	@end_time DATETIME2(7),
	@total_microseconds BIGINT = 0,
	@loops INT = 0;

	SET NOCOUNT ON;

	DROP TABLE IF EXISTS dbo.OFFICIAL_STATEMENTS;
	CREATE TABLE dbo.OFFICIAL_STATEMENTS (OFFICIAL_STATEMENT VARCHAR(30));
	
	WHILE @loops <= 50000 BEGIN INSERT INTO dbo.OFFICIAL_STATEMENTS VALUES ('NO COLLUSION');
		IF @@ROWCOUNT > 0	
		BEGIN
			SET @start_time = SYSUTCDATETIME();

			INSERT INTO dbo.OFFICIAL_STATEMENTS VALUES ('NO OBSTRUCTION');

			SET @end_time = SYSUTCDATETIME();

			SET @total_microseconds = @total_microseconds + DATEDIFF(MICROSECOND, @start_time, @end_time);
		END;

		SET @loops = @loops + 1;
	END;

	SELECT @total_microseconds;
END;

GO

EXEC #USE_INFERIOR_EUROPEAN_TIME;

The second insert query takes a total of 4381219 microseconds with SYSDATETIME() and 4164658 microseconds with SYSUTCDATETIME(). That’s a 5% difference just from changing the datetime function. Of course, given that this code is measuring the difference of times SYSUTCDATETIME() is the correct choice because it remains accurate even if there’s a daylight savings switch during code execution. My own approach is trying to avoid running one-off stored procedures around 2:00 AM.

Final thoughts


There’s a large performance difference between SYSDATETIME() and SYSUTCDATETIME(). It isn’t necessary to guess which one is slower and why. ETW tracing tools such as PerfView can reveal exactly where the performance difference comes from. Thanks for reading!

How Bad Cardinality Estimates Lead To Bad Query Plan Choices: Tuning Indexes For Better Performance

Batch Cussidy


In the last post, we looked at how SQL Server 2019’s Batch Mode for Row Store could have helped our query.

In short, it didn’t. Not because it’s bad, just because the original guess was still bad.

Without a hint, we still got a poorly performing Merge Join plan. With a hint, we got a less-badly-skewed parallel plan.

Ideally, I’d like a good plan without a hint.

In this post, I’ll focus on more traditional things we could do to improve our query.

I’ll approach this like I would if you gave me any ol’ query to tune.

Here’s what we’re starting with:

    SELECT   p.*
    FROM     dbo.Posts AS p
    JOIN     dbo.Votes AS v
        ON p.Id = v.PostId
    WHERE    p.PostTypeId = 2
    AND      p.CreationDate >= '20131225'
    ORDER BY p.Id;

First Pass


I don’t know about you, but I typically like to index my join columns.

Maybe not always, but when the optimizer is choosing to SORT 52 MILLION ROWS each and every time, I consider that a cry for help.

Indexes sort data.

Let’s try that first.

	CREATE INDEX ix_fluffy 
	    ON dbo.Votes(PostId);

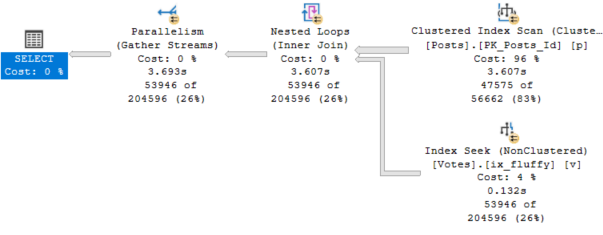
This is… Okay.

SQL Server Query Plan
Willingly!

I’m not saying this plan is great. It’s certainly faster than the Merge Join plan, and the optimizer chose it without us having to hint anything.

It takes 3.6 seconds total. I think we can do better.

Second Pass


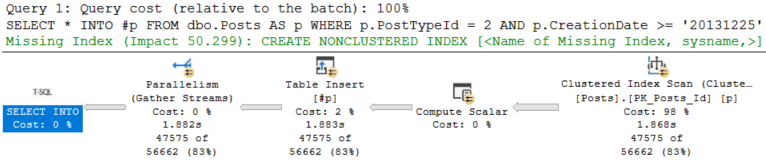
I wonder if a temp table might help us.

    SELECT   *
	INTO     #p
    FROM     dbo.Posts AS p
    WHERE    p.PostTypeId = 2
    AND      p.CreationDate >= '20131225';

This is… Okay. Again.

The Insert takes 1.8 seconds:

SQL Server Query Plan
Scrunchy face.

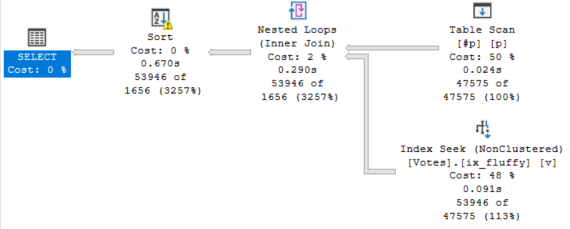
The final select takes 670ms:

SQL Server Query Plan
Add’em up.

Usually this is the point where I’ll stop and report in:

“I’ve spent X amount of time working on this, and I’ve gotten the query from 27 seconds down to about 2.5 seconds. I can do a little more and maybe shave more time off, but I’ll probably need to add another index. It’s up to you though, and how important this query is to end users.”

We could totally stop here, but sometimes people wanna go one step further. That’s cool with me.

Third Pass


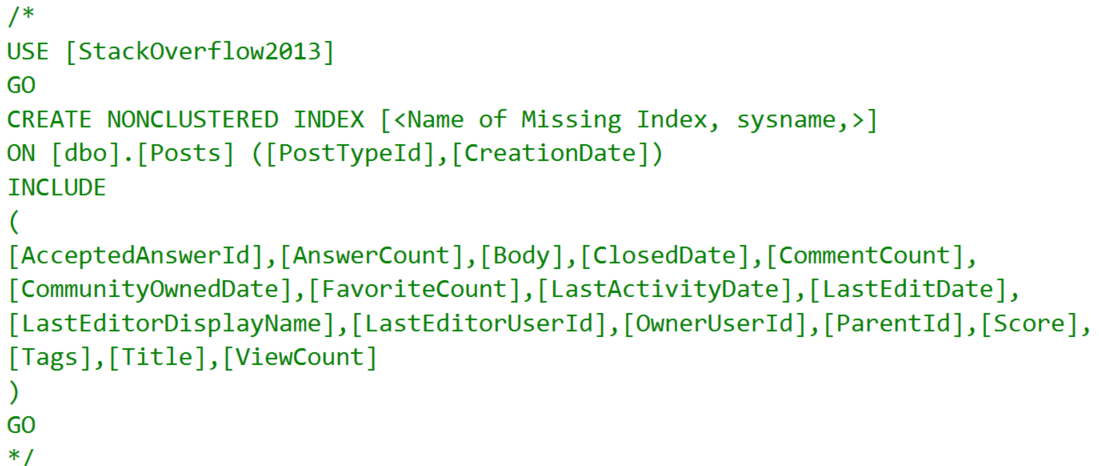
The insert query is asking for an index, but it’s a dumb dumb booty head index.

SQL Server Query Plan
Thanks, Robots.

Yep. Include every column in the table. Sounds legit.

Let’s hedge our bets a little.

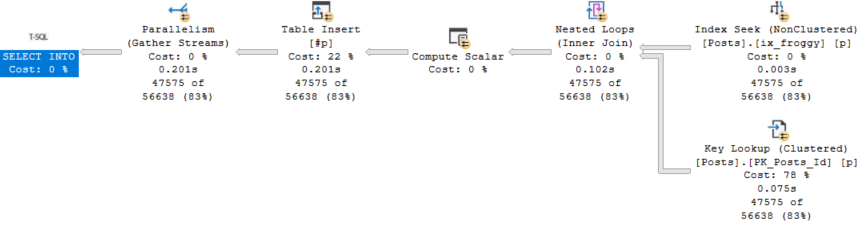
    CREATE INDEX ix_froggy
	    ON dbo.Posts(PostTypeId, CreationDate);

I bet we’ll use a narrow index on just the key columns here, and do a key lookup for the rest.

SQL Server Query Plan
Righto

This time I was right, and our Insert is down to 200ms.

This doesn’t change the speed of our final select — it’s still around 630-670ms when I run it.

Buuuuuuut, this does get us down to ~900ms total.

Final Destination


Would end users notice 900ms over 2.5 seconds? Maybe if they’re just running it in SSMS.

In my experience, by the time data ends up in the application, gets rendered, and then displayed to end users, your query tuning work can feel a bit sabotaged.

They’ll notice 27 seconds vs 2.5 seconds, but not usually 2.5 seconds vs 1 second.

It might make you feel better as a query tuner, but I’m not sure another index is totally worth that gain (unless it’s really helping other queries, too).

Thanks for reading!

Going Further


If this is the kind of SQL Server stuff you love learning about, you’ll love my training. Blog readers get 25% off the Everything Bundle — over 100 hours of performance tuning content. Need hands-on help? I offer consulting engagements from targeted investigations to ongoing retainers. Want a quick sanity check before committing to a full engagement? Schedule a call — no commitment required.
How Bad Cardinality Estimates Lead To Bad Query Plan Choices: Does SQL Server 2019 Batch Mode On Rowstore Help?

Bad Fit


In the last post, I tried to play some tricks on the optimizer to have Batch Mode make a query faster.

It didn’t quite work out the way I wanted.

That isn’t to knock Batch Mode. It’s not supposed to fix everything, and I played a silly trick to get some operators to use it.

But it did make me curious if 2019’s Batch Mode for Row Store would improve anything.

After all, no dirty tricks are involved, which means more operators can potentially use Batch Mode, and maybe we’ll avoid that whole skewed parallelism problem.

I mean, what are the odds that I’ll get the exact same plans and everything?

Spoiler


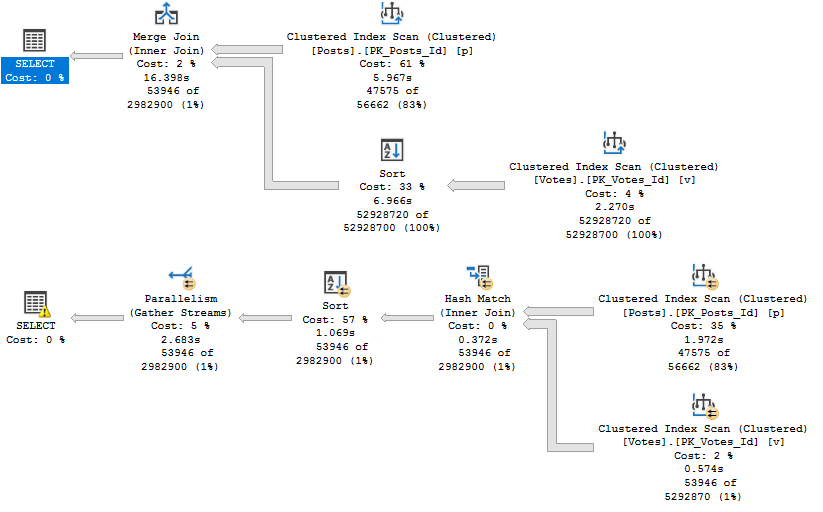
SQL Server Query Plan
50%

The Merge Join plan is still wack as hell.

The forced hash join plan got better, though.

Still Skewy?


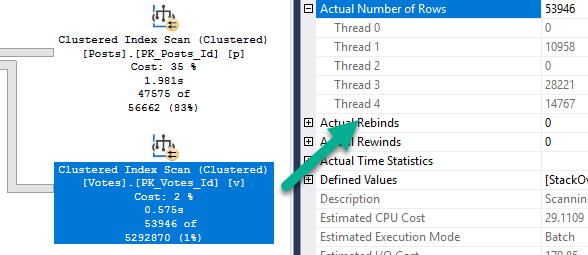
The skewed parallelism isn’t as contagious going across without the separate Filter/Bitmap operator.

SQL Server Query Plan
Uggo

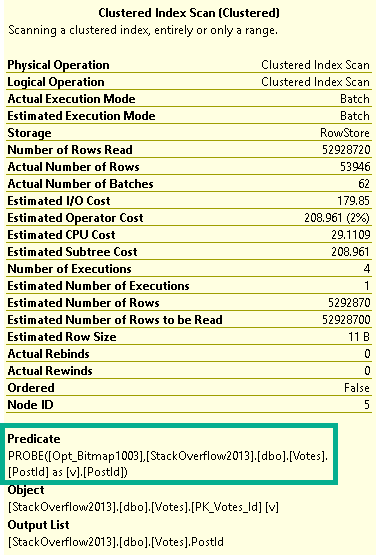
With both the Hash Join and the Scan of Votes occurring in Batch Mode, the Bitmap is able to be pushed to the storage engine.

Note that there’s no explicit Bitmap filter anywhere in the plan, but one still shows up in the predicate of the Scan of the Votes table.

SQL Server Query Plan
Something new

With 3 out of 4 threads doing… vaguely even work, we end up in a better place, especially compared to only one thread doing any work.

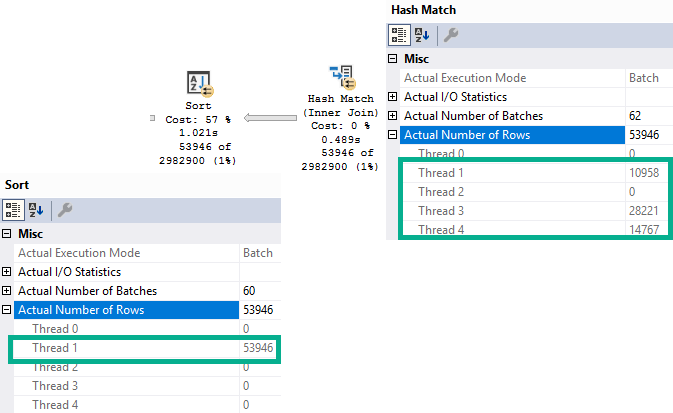
At least now I can show you the Batch Mode Sort lie about being parallel.

SQL Server Query Plan
Crud

Three threads with rows at the Hash Join go into the Sort on a single thread.

You Know…


As much as I love these new bells and whistles, I’m gonna go back to good ol’ fashion query tuning next.

The problem here is still that a bad estimate causes a Merge Join to be chosen in the first place.

When we force the Hash Join, query runtime is reduced at the expense of a quite large memory grant.

This is likely preferable for most people (especially with Batch Mode Memory Grant Feedback), but it doesn’t address the root cause.

Thanks for reading!

Going Further


If this is the kind of SQL Server stuff you love learning about, you’ll love my training. Blog readers get 25% off the Everything Bundle — over 100 hours of performance tuning content. Need hands-on help? I offer consulting engagements from targeted investigations to ongoing retainers. Want a quick sanity check before committing to a full engagement? Schedule a call — no commitment required.
How Bad Cardinality Estimates Lead To Bad Query Plan Choices

Let’s Run A Cruddy Query


We’ve got no supporting indexes right now. That’s fine.

The optimizer is used to not having helpful indexes. It can figure things out.

    SELECT   p.*
    FROM     dbo.Posts AS p
    JOIN     dbo.Votes AS v
        ON p.Id = v.PostId
    WHERE    p.PostTypeId = 2
    AND      p.CreationDate >= '20131225'
    ORDER BY p.Id;
SQL Server Query Plan
Snap City.

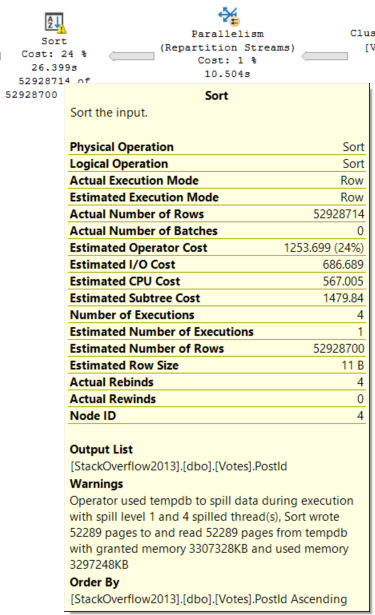
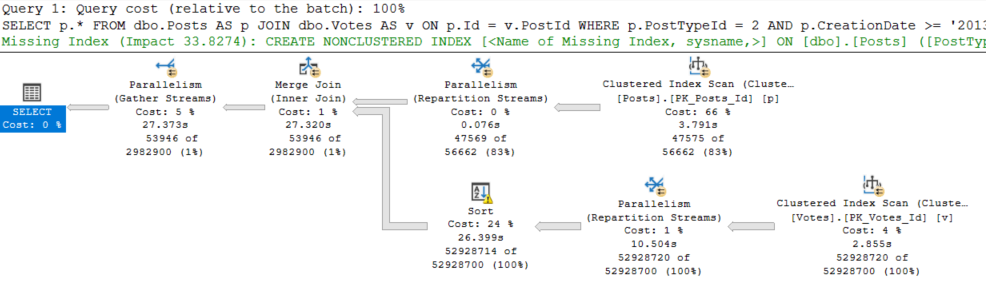
So uh. We got a merge join here. For some reason. And a query that runs for 27 seconds.

The optimizer was all “no, don’t worry, we’re good to sort 52 million rows. We got this.”

SQL Server Query Plan
YOU’VE GOT THIS.

[You don’t got this — ED]

Choices, Choices


Since we have an order by on the Id column of the Posts table, and that column is the Primary Key and Clustered index, it’s already in order.

The optimizer chose to order the PostId column from the Votes table, and preserve the index order of the Id column.

Merge Joins expect ordered input on both sides, don’tcha know?

It could have chosen a Hash Join, but then the order of the Id column from the Posts table wouldn’t have been preserved on the other side.

Merge Joins are order preserving, Hash Joins aren’t. If we use a Hash Join, we’re looking at ordering the results of the join after it’s done.

But why?

SQL Server Query Plan
Good Guess, Bad Guess

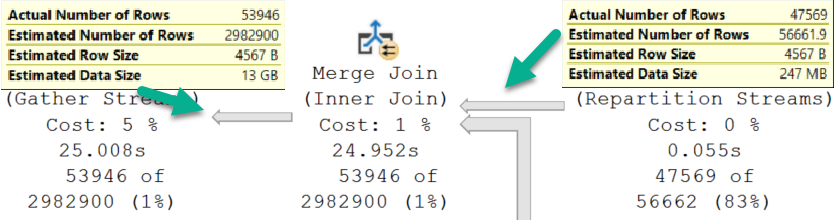
Going into the Merge Join, we have a Good Guess™

Coming out of the Merge Join, we have a Bad Guess™

Thinking back to the Sort operator, it only has to order the PostId column from the Votes table.

That matters.

Hash It Up


To compare, we need to see what happens with a Hash Join.

SQL Server Query Plan
smh

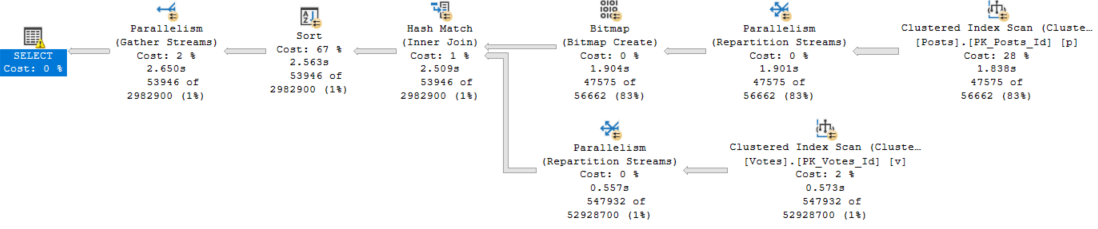
Okay, ignore the fact that this one runs for 2.6 seconds, and the other one ran for 27 seconds.

Just, like, put that aside.

Here’s why:

SQL Server Query Plan
Neither Nor

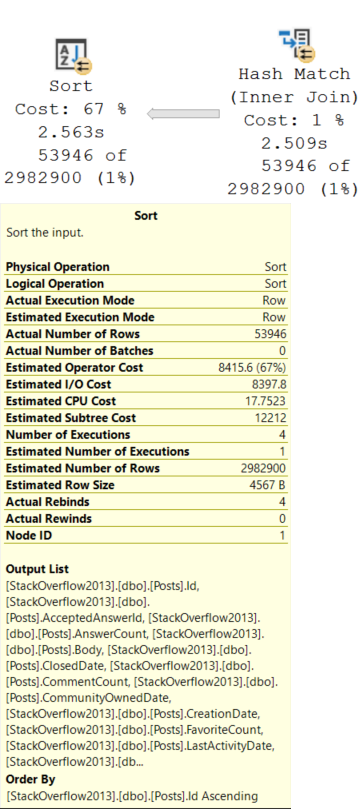
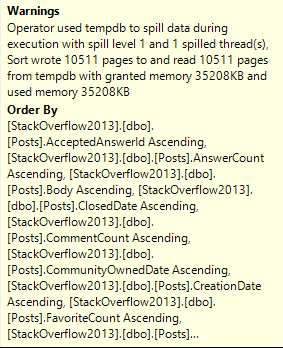
This Sort operator is different. We need to sort all of the columns in the Posts table by the Id column.

Remember that the Id column is now out of order after the Hash Join.

Needing to sort all those columns, including a bunch of string columns, along with an NVARCHAR(MAX) column — Body — inflates the ever-weeping-Jesus out of the memory grant.

SQL Server Query Plan
I see.

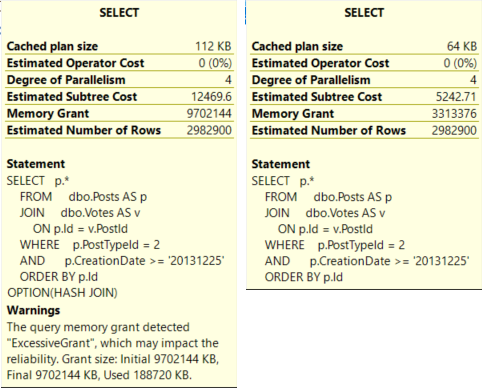
The Hash Join plan is not only judged to be more than twice as expensive, but it also asks for a memory grant that’s ~3x the size of the Merge Join plan.

Finish Strong


Let’s tally up where we’re at.

Both queries have identical estimated rows.

The optimizer chooses the Merge Join plan because it’s cheaper.

  • The Merge Join plan runs for 27 seconds, asks for 3.3GB of RAM, and spills to disk.
  • The Hash Join plan runs for 3 seconds, asks for 9.7GB of RAM and doesn’t spill, but it only uses 188MB of the memory grant.

That has impacted the reliability.

In a world where memory grants adjust between executions, I’ll take the Hash Join plan any day of the week.

But this is SQL Server 2017, and we don’t get that without Batch Mode, and we don’t get Batch Mode without playing some tricks.

There are lots of solutions if you’re allowed to tune queries or indexes, but not so much otherwise.

In the next couple posts, I’ll look at different ways to approach this.

Thanks for reading!

Going Further


If this is the kind of SQL Server stuff you love learning about, you’ll love my training. Blog readers get 25% off the Everything Bundle — over 100 hours of performance tuning content. Need hands-on help? I offer consulting engagements from targeted investigations to ongoing retainers. Want a quick sanity check before committing to a full engagement? Schedule a call — no commitment required.
Does Using DISTINCT In SQL Server Queries Cause Performance Problems?

Footnote


I have two queries. They return the same number of rows.

The only difference is one column in the select list.

This query has the Id column, which is the primary key and clustered index of the Posts table.

    SELECT   DISTINCT
             p.Id, p.AcceptedAnswerId, p.AnswerCount, p.Body, p.ClosedDate,
             p.CommentCount, p.CommunityOwnedDate, p.CreationDate,
             p.FavoriteCount, p.LastActivityDate, p.LastEditDate,
             p.LastEditorDisplayName, p.LastEditorUserId, p.OwnerUserId,
             p.ParentId, p.PostTypeId, p.Score, p.Tags, p.Title, p.ViewCount
    FROM     dbo.Posts AS p
    JOIN     dbo.Votes AS v
        ON p.Id = v.PostId
    WHERE    p.PostTypeId = 2
    AND      p.CreationDate >= '20131225'
    ORDER BY p.Id;

The query plan for it looks like this:

SQL Server Query Plan
Eligible

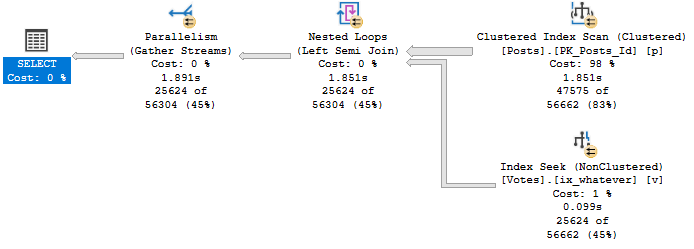
Notice that no operator in this plan performs any kind of aggregation.

There’s no Hash Match Aggregate, no Stream Aggregate, no Distinct Sort, NADA!

It runs for ~1.9 seconds to return about 25k rows.

Lessen


Watch how much changes when we remove that Id column from the select list.

    SELECT   DISTINCT
             p.AcceptedAnswerId, p.AnswerCount, p.Body, p.ClosedDate,
             p.CommentCount, p.CommunityOwnedDate, p.CreationDate,
             p.FavoriteCount, p.LastActivityDate, p.LastEditDate,
             p.LastEditorDisplayName, p.LastEditorUserId, p.OwnerUserId,
             p.ParentId, p.PostTypeId, p.Score, p.Tags, p.Title, p.ViewCount
    FROM     dbo.Posts AS p
    JOIN     dbo.Votes AS v
        ON p.Id = v.PostId
    WHERE    p.PostTypeId = 2
    AND      p.CreationDate >= '20131225';

This is what the query plan now looks like:

SQL Server Query Plan
What’s wrong with you.

Zooming in a bit…

SQL Server Query Plan
Woof.

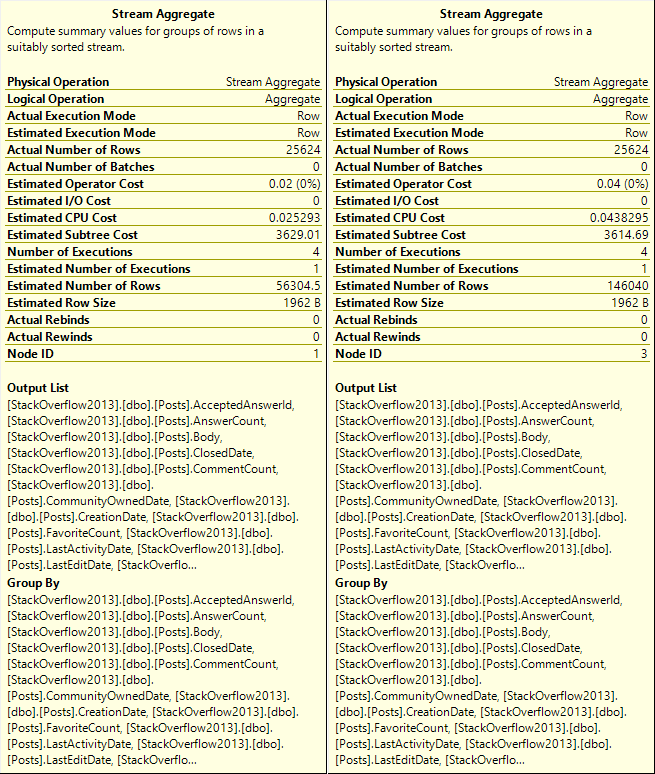
After we Scan the Posts table, we sort about 47k rows.

After the join to Votes, we aggregate data twice. There are two Stream Aggregate operators.

What do we sort?

SQL Server Query Plan
Boogers.

We Sort every column in the table by every column in the table.

In other words, we order by every column we’ve selected.

What do we aggregate?

SQL Server Query Plan

Everything. Twice.

What Does It All Mean?


When selecting distinct rows, it can be beneficial to include a column that the optimizer can guarantee is unique in the set of selected columns. Think of a primary key, or another column with a uniqueness constraint on it.

Without that, you can end up doing a lot of extra work to create a distinct result set.

Of course, there are times when that changes the logic of the query.

Thanks for reading!

Going Further


If this is the kind of SQL Server stuff you love learning about, you’ll love my training. Blog readers get 25% off the Everything Bundle — over 100 hours of performance tuning content. Need hands-on help? I offer consulting engagements from targeted investigations to ongoing retainers. Want a quick sanity check before committing to a full engagement? Schedule a call — no commitment required.
SQL Server Index Fragmentation And Broken Demos

Egg Meet Face


The other night I was presenting for a user group, and I had a demo break on me.
Not the first time, not the last time. But this was weird because I had rehearsed things that morning.

I skipped over it at the time, but afterwards I started thinking about what had happened, and walking back through other stuff I had done that day.

Turns out, I had fragmented my indexes, and that broke a trivial plan demo.

Just Too Trivial


The working demo looks like this.

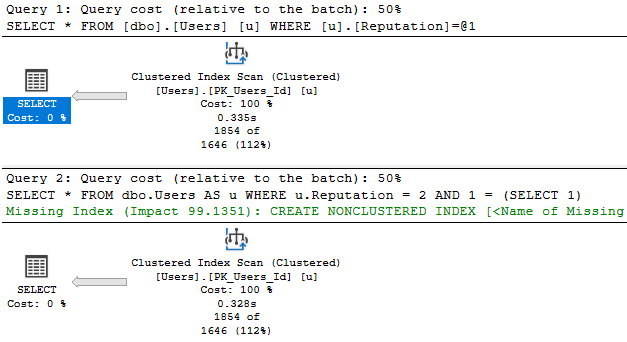
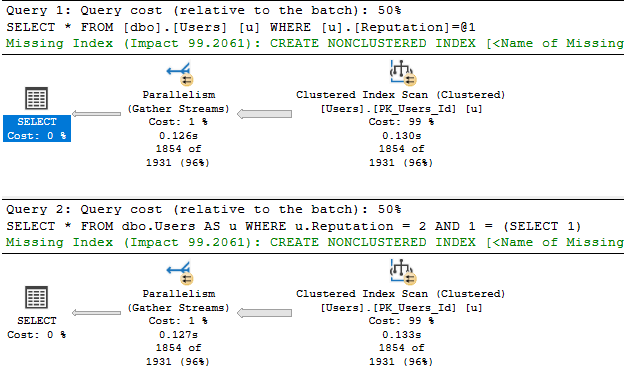
I run these queries. The top one receives a trivial plan, and doesn’t have a missing index request.

The bottom one gets full optimization, and one shows up.

	/*Nothing for you*/
	SELECT *
	FROM dbo.Users AS u
	WHERE u.Reputation = 2;

	/*Missing index requests*/
	SELECT *
	FROM dbo.Users AS u
	WHERE u.Reputation = 2
	AND 1 = (SELECT 1);
SQL Server Query Plan
Picture perfect.

Snap Your Shot


How I had broken this demo was by playing with Snapshot Isolation.

At some point earlier in the day, I had done something like this:

ALTER DATABASE StackOverflow2013 
    SET ALLOW_SNAPSHOT_ISOLATION ON;

BEGIN TRAN
UPDATE dbo.Users SET Reputation += 1
ROLLBACK

When you use optimistic isolation levels, a 14 byte pointer gets added to every row to keep track of its version.

If I had run the update without it, it wouldn’t have been a big deal. But, you know.

I’m not that lucky. Or smart.

See, after updating every row in the table, my table got uh… bigger.

SQL Server Query Results
Looter in a riot

Now, if I rebuild the table with snapshot still on, the problem goes away.

The problem is that I didn’t do that before or after my little experiment.

With a heavily fragmented index, both queries not only get fully optimized, but also go parallel.

SQL Server Query Results
Faster/Stronger

They’re both a bit faster. They both use a little more resources.

Why? Because SQL Server looked at the size of the table and decided it would be expensive to scan this big chonker.

Egg Wipes


Moral of the story: Index fragmentation makes your queries better.

Don’t @ me.

Going Further


If this is the kind of SQL Server stuff you love learning about, you’ll love my training. Blog readers get 25% off the Everything Bundle — over 100 hours of performance tuning content. Need hands-on help? I offer consulting engagements from targeted investigations to ongoing retainers. Want a quick sanity check before committing to a full engagement? Schedule a call — no commitment required.