How SQL Server’s Missing Index Requests Can Hurt Performance

DON’T THROW EGGS


Thanks for watching!

Video Summary

In this video, I delve into a peculiar performance issue that arose from a stored procedure and a missing index request. The scenario began when a user passed an unusual negative value to the stored procedure, causing significant performance degradation. To mitigate the problem, developers implemented a catch to convert any negative values to zero, ensuring the execution plan remained stable. However, this fix led to further complications as another query against the same table exhibited poor performance due to a missing index request. The video explores how adding an index suggested by SQL Server’s missing index feature improved one query but significantly slowed down another, highlighting the importance of carefully testing database changes in development environments before deployment.

Full Transcript

Hello, Erik Darling here with Erik Darling Data. And I wanted to talk about sort of a funny situation that I was recently asked to remedy. And that funny situation, well, the funny situation started with a stored procedure, sort of was escalated by a missing index request. And all came tumbling down on top of that stored procedure. So the stored procedure, it didn’t look like this because it was not, it was not, it was not an issue with Stack Overflow. I’m going to level with you. To be very honest, Stack Overflow has never asked me to fix a performance problem. I just keep having to find these random performance problems in the, when I do demos in the database. It’s the damnedest thing, isn’t it? Anyway. In real life, it was a slightly different scenario, but it was a stored procedure. And at some point, at some point, some user, we should call them a loser probably, had passed in a bad piece of data to the stored procedure. In fact, it was someone had passed a negative value into the stored procedure once. And that caused everything to fly off the rails.

Everything went really, really, really badly with this stored procedure. So the developers in charge of it put this catch in to fix things. Where if someone passed in a negative value for their stored procedure, they would, they would revert the value to zero to a positive number so that they did not get their big, golly gosh, awful plan. So this is what the stored procedure looks like. And, you know, there’s a pretty simple select top one query after that. Not a big deal. And in fact, if we go and we look, we can see that ever since we converted this database from access to SQL Server 2000, we have had this index in place, the single key column index in place. And with that index in place, this stored procedure runs relatively quickly. And by relatively quickly, I mean, instantly. If we look at the execution plan, this thing finishes in 87 milliseconds.

There’s a missing index request. But if I have a query that’s ending, that’s finishing in 87 milliseconds, I’m not like jumping up and down and saying, hey, we really, really need to add this missing index request for reasons. Right. Like I can run this a million times every time I run this. It’s quick. And I’m not running this for like a small value. I’m running this for John Skeet and John Skeet’s got all the values. John Skeet has a lot of the most posts in the posts table. So you can, this is not like just like some wimpy value that we’re searching for. Every time we run this, it is reliably under the 90 millisecond mark.

Right. So that’s a very fast stored procedure. At least I think it’s fast. You might, you might not. You, you might be a much better query tuner than I am and have a much faster, have a much different view of what’s a fast stored procedure. Now where things got kind of weird is, and this is even with this like funny catch in place, everyone would, normally you’d see this and chop someone’s head off for declaring a variable inside a stored procedure and then feeding it into a where clause. But, but, but everything’s okay here. Where things got bad was, there was this other query. And this other query was also against the post table, but it had a different where clause.

Now what I’m going to do is I’m going to run this store, I’m going to, not store procedure, this piece of code. And this piece of code is sort of going to look at, look, is going to look a lot like what the other query was doing. And this one takes about two seconds to finish, to get a top one. And it happened because we didn’t have another useful index for this, for this query to use. So we scanned the whole clustered index and the whole thing. Well, I mean, I guess that’s closer to about two and a half seconds there. 2.381 by 120 milliseconds.

We’re under. Now there’s a missing index request for this. I’m going to show you the missing index. Missing index details. Now if we zoom in here, zoom in and look at, look at what SQL Server thinks a helpful index is. It’s, I mean, it’s, it’s on the post table, obviously, because that’s where we’re selecting data from. And it’s on parent ID and then creation date and then last activity date. And we’re including post type ID.

Now, what you might notice at this point is that there’s some overlap between this missing index request and the query we have that’s fast. So A, they’re both on the post table. And B, the where clause for our query inside the store procedure also has parent ID and post type ID in the where clause on top of owner user ID. Right now, we have a single column index on owner user ID. When we seek to that and do a key lookup for everything else, we’re cool. We’re in great shape.

But we have this missing index request. And this missing index request was, was super, was everywhere. It was endemic. It was, I mean, it’s a big missing index request. I’m probably using all sorts of wrong words here. Let me turn off execution plans. And let’s run SP Blitz index and look at the post table. So over on the post table, the second thing we’re going to have down here is missing index requests.

Now, this one up top is the one that’s on the table for that query that we ran. And over in this window, I have run, I have run that query, as they say in the south, a whole mess of times. So this is printed out this phrase every time this, this has been running for doing a lot of stuff. But we have this missing index request. And this missing index request was showing, well, I mean, quite a bit of use, 14, almost 1,500 uses.

It would bring the query cost to zero. Impact is 100%. And the average query cost is absolutely astronomical. It is 3,474.1810 query box on that thing. So when we look at the estimated benefit of adding, I can hear my kids screaming in the background maybe.

If we look at the estimated benefit of adding this, it’s 515 million query box that we would have created or saved by adding this index to our workload. All right. You’ve talked me into its SQL Server. You have shown me that if I add this index, it would have been used 1,500 times by this very expensive query. Now, if I run that very expensive query, oh, wait, I did that. Two and a half seconds. Cool. We got that.

We have a benchmark there, right? This is two and a half seconds to do this. All right. Two and a half. Cool. Now, this is the index that someone came along and added. Someone charged a lot of money to add this index on parent ID, creation date and last activity date, and include post type ID.

Because that’s what SQL Server asked for. SP Blitz Index didn’t make this up. It didn’t conjure this out of nowhere. It showed us what SQL Server’s own DMVs have told us.

What they don’t tell us, though, is what if this index goes and screws up some other query? So let’s create this index. And this will take a moment. This will take a moment here. Create this index. This great index on parent ID and creation date and last activity date, including post type ID. Get that whole post table in there.

That took 12 seconds. But let’s look. Because now I want to make sure that this helped this query. And by God, it does. This thing finishes instantly. Now, if we turn query plans back on and look at this query, holy smokes, that is zeros.

Look it. Zeros. All zeros. We didn’t spend anything doing this. What an amazing index. What a fantastic index. That’s the best index that’s ever been created. Except now, this query slows down. This query is not as fast as it used to be.

This query has taken some extra time. This query now takes 14 seconds to run. Remember, this one was running reliably in under 90 milliseconds. And now, it just took 14 seconds to run. If we go look at the execution plan, we can see that was the entire time this thing ran.

We spent a second here. And we spent 9 seconds here. So that’s 10 seconds. Then we spent 4 seconds doing a nutty loops join. And then we spent, well, we spent to spend any time doing this sort. But, whew.

I mean, that’s bad enough. Imagine if you were tuning queries and indexes and you added that index. It was like, yeah, this is going to make everything much better. And then it made a vital query go much slower. Well, this happened for a pretty funny reason.

And a pretty funny reason is that when we declare a local variable for, what do you call it up there? Where is it going? For a parent ID.

We get a very, very bad guess in here for what’s equal, how many rows this equals several thinks are going to happen. Things are going to evaluate to true for any given predicate on parent ID. In fact, if we go look at the query plan, we go look at this seek, we can see that the estimated number of rows is 1.87.

But the actual number of rows is 6, 0, 0, 0, 2, 2, 3. 6, 0, 0, 0, 2, 2, 3. Yeah, that’s a seven finger number.

That’s a big number. We were off by a lot there. We made a pretty big mistake. If we look at the key lookup, this thing will have executed once for every row that came out of there. And that’s no good either. So we had kind of a funny, perfect storm of things go wrong here.

And if there’s a lesson, it’s that, you know, while SQL Server’s missing index requests are a lot better than nothing, they’re a good sign that we need to do some work. They are like a crying baby.

On your tables and DMBs. Whereas SQL Server says, hey, we could be doing something better over here. We have to be very careful how those indexes change other queries in the workload. And this is why, you know, we must, as responsible data peoples, tell people to test things carefully in a development environment before just releasing these changes into prod. Because you can introduce all sorts of funny regressions here where you might make one query much better.

But you can make another query much worse. Now, granted, this is not the best thing to do here. This is not a good practice. I’m not condoning doing this. But this is what made sort of the perfect storm of weird stuff happen. We’re adding that other index made this query much, much worse.

Anyway, that’s it for me. Thanks for watching. I hope you learned something. I hope you were shocked and horrified by what I showed you. And I will see you in some other video. Goodbye.

Going Further


If this is the kind of SQL Server stuff you love learning about, you’ll love my training. Blog readers get 25% off the Everything Bundle — over 100 hours of performance tuning content. Need hands-on help? I offer consulting engagements from targeted investigations to ongoing retainers. Want a quick sanity check before committing to a full engagement? Schedule a call — no commitment required.

The Difference Between Statistics Time And Plan Operator Times In SQL Server Query Plans

Goal Posts


When you’re measuring query changes to see if your performance changes have made a difference, a common way to do that is to use STATISTICS TIME and IO.

They’re not perfect, but the barrier to entry is super low, and you can get a good enough feel for if you’re on the right track.

In a perfect world, people would only select the rows and columns they need.

Also in a perfect world: that really embarrassing thing you did in 3rd grade wouldn’t pop into your head every time you’re about to do something really important.

Durex


What can make judging differences tough is if you’re returning a lot of rows to SSMS.

Sometimes it feels like you can reduce reads and CPU time, but your overall query time hasn’t changed.

Now with query operator times, that becomes easier to see.

And Earl


Let’s take this query, which returns ~271k rows.

SET STATISTICS TIME, IO ON;

SELECT c.Score, c.UserId, c.Text 
FROM dbo.Comments AS c
WHERE c.Score BETWEEN 5 AND 30
ORDER BY c.Score DESC

In the Stack Overflow 2013 database, this runs for about 3 wall clock seconds.

It says so in the bottom corner of SSMS.

Since we turned on stats time, we can look in the messages window to see that information.

Here are the relevant details:

 SQL Server Execution Times:
   CPU time = 3516 ms,  elapsed time = 3273 ms.

What looks odd here is that CPU and elapsed time are near-equal, but the plan shows parallelism.

SQL Server Query Plan
Tired of roaches

Thankfully, with operator times, the actual plan helps us out.

SQL Server Query Plan
Tired of rats

The query itself ran for <900ms.

The situation isn’t so dire.

More Ales


In stats time, elapsed time measures until results are done getting to SSMS.

It might look like this query “ran” for ~3 seconds, but it didn’t. The query finished processing data in under a second, but it took another couple seconds for SSMS to render the results.

You can do a mock test by doing something like this:

DECLARE @blob_eater VARCHAR(8000);

SELECT @blob_eater = c.Score, 
       @blob_eater = c.UserId, 
	   @blob_eater = c.Text 
FROM dbo.Comments AS c
WHERE c.Score BETWEEN 5 AND 30
ORDER BY c.Score DESC

Now when we run the query, stats time is much closer to the operator finish time:

 SQL Server Execution Times:
   CPU time = 2954 ms,  elapsed time = 897 ms.

Thanks for reading!

Going Further


If this is the kind of SQL Server stuff you love learning about, you’ll love my training. Blog readers get 25% off the Everything Bundle — over 100 hours of performance tuning content. Need hands-on help? I offer consulting engagements from targeted investigations to ongoing retainers. Want a quick sanity check before committing to a full engagement? Schedule a call — no commitment required.

Why Not Just Go For The Big Plan To Improve SQL Server Query Performance?

M’ocean


Video Summary

In this video, I delve into the intricacies of parameter sniffing in SQL Server and address a question posed by Bradley Jamrozik on Twitter regarding optimizing for large values to ensure always getting powerful execution plans. I explain why simply opting for a big value might not be the best approach due to resource constraints, particularly focusing on concurrency limits such as worker threads and memory grants. By examining these limitations through practical examples on my laptop’s hardware setup, I illustrate how different execution plans can impact the number of concurrent queries that SQL Server can handle efficiently.

Full Transcript

Howdy folks, Erik Darling here with Erik Darling Data. You should be used to that by now. If you’re not, I’m sorry. You just have trouble accepting change in your life. Change and then stability, I guess. Anyway, I’m recording this video because I got asked a, not good, but a great question not too long ago on Twitter by Bradley Jamrozik, or Rozeker, Rozeker. I don’t know how to pronounce that, Bradley. I apologize. You can correct me somewhere. I hear that correcting people on the internet is sometimes, sometimes happens. It’s a bit of a national pastime at this point. Anyway, the question was, when you’re dealing with a parameter sniffing situation, in a situation where SQL Server comes up with two or even more different execution plans based on which parameter it was compiled with the first time around, why not always just optimize for a big, why not just optimize for a big, crazy value so that you always get a big, powerful plan, probably parallel, probably ask for a decent chunk of memory, all that other stuff. Well, there are, I think, for me, some pretty fair reasons not to always do that. And those fair reasons come down to, of course, resources.

Now, if I look at the hardware that I have in my laptop, I have a processor in there with four cores that are hyper-threaded, unfortunately. I apologize to everyone out there who hates hyper-threading. And I also have 64 gigs of memory in my laptop, of which about 50 is dedicated to SQL Server. When I run these two queries, I can see how many worker threads I have available for SQL Server, which is 576. And I can see how much memory I have available to give out to queries. If I go down here and I zoom in a little bit, I can see that my total and my available memory are about the same. And this is how much memory in gigs I can give out to queries for memory grants.

Memory grants is, of course, memory that queries ask for outside of the usual. I have to run stuff to do other things like sort or hash or, you know, do some columnstore stuff that, excuse me, that consumes additional memory. And these are limits. When you start up SQL Server, depending on how many cores you have assigned to your server, and depending on how much memory you have in your server and your max server memory, SQL Server sets limits for how much it’ll allow itself to give out for different things.

Whenever a query runs, it has to take a little piece from those things. The more pieces that these queries are asking for, the fewer queries in total you can have running. For example, with a serial query, with 576 worker threads, I can run 576 copies of that query. If I have a query that goes parallel and it reserves more worker threads, well, whatever DOP is, is going to tell SQL Server how many parallel threads it can use in a branch.

And if I have multiple concurrent branches, SQL Server, just for example, on my laptop, I have max DOP set to 4. So if I have two concurrent branches, that’s 8 threads. And if I have three concurrent branches, that’s 12 threads. So the more parallel queries, the more parallel branches in those queries, the more threads they can just reserve and run with.

Ditto memory. If a query comes along and asks for a large memory grant, and SQL Server is able to grant the entire thing, well, if I have a query that asks for one gig of memory, and currently I can run just about 37 of them, or let’s just say 36 to be safe.

If I have a query that asks for 10 gigs of memory, I can run far fewer of them concurrently. So if we go over to this tab, and we look at a store procedure where I’ve recompiled before executing for two different parameters, 9 and 0, I get two different execution plans.

This top plan is a serial plan, and if I look at how much memory it asks for, it’s about 17 megs. 1, 7, 1, 1, 2. And if I look at how many threads it asks for, an F4 over here, it’s just one, because it’s a serial query.

This will come in handy in a minute. If I look at the second query, look at the select operator, this thing has asked for, let’s see, 7794944. That’s a seven-digit number.

So since it’s 779, I’m going to say that’s 7.8 gigs of memory, as opposed to 17 for the serial query. If you remember what’s on that other tab, about 37, I can’t run as many of these at once as I can of the other one at once. Far fewer, in fact.

If I look at how many threads this thing asks for, if I… Sorry, we’re going to have a dance party for a moment. Oh, alright.

You know, I’m always worried about playing music while a video, while I’m recording a video. But you know what? It’s alright with me. Anyway, if we look at how many threads this query reserved, we can see that we had one branch that was available to execute concurrently.

And we reserved four threads. So that’s not a ton. Granted, there are queries where you can have a lot more than this going on.

But for this query, in four threads, we can run far fewer of these copies concurrently than we can of the single-threaded version. So for me, when I think about why not just optimize for a big value, right? Why not just have every query run as forcefully as possible?

It’s a concurrency thing. And I know that when a lot of people think about concurrency, they think of locking and blocking and deadlocks and other things that kind of hold other queries up. But concurrency goes beyond that.

Concurrency also goes into, you know, from a resource perspective, right? So like not a logical resource like a lock, but a physical resource like how many threads you have or how much memory you have to give out to queries. These are hard limits.

The more queries you have that take up more of those resources, the fewer of those queries you can run. On a larger server, like on a big, big server, that might shut up windows. That might make less of a difference.

On a smaller server, say that’s maybe already a little bit underpowered for your workload, you might end up with a pretty bad situation. If you run out of worker threads, you hit a weight called thread pool. If you run out of memory to give out to queries, you hit a weight called resource semaphore.

So when asked why not just go with the big plan, well, it’s because of that. Because you have hard limits inside of your SQL Server for how much you can give out to queries. Of course, if you don’t care about concurrency, then the problem is solved for you.

Anyway, my name’s Erik Darling with Erik Darling Data. And thank you for watching. Bye.

Video Summary

In this video, I delve into the intricacies of parameter sniffing in SQL Server and address a question posed by Bradley Jamrozik on Twitter regarding optimizing for large values to ensure always getting powerful execution plans. I explain why simply opting for a big value might not be the best approach due to resource constraints, particularly focusing on concurrency limits such as worker threads and memory grants. By examining these limitations through practical examples on my laptop’s hardware setup, I illustrate how different execution plans can impact the number of concurrent queries that SQL Server can handle efficiently.

Full Transcript

Howdy folks, Erik Darling here with Erik Darling Data. You should be used to that by now. If you’re not, I’m sorry. You just have trouble accepting change in your life. Change and then stability, I guess. Anyway, I’m recording this video because I got asked a, not good, but a great question not too long ago on Twitter by Bradley Jamrozik, or Rozeker, Rozeker. I don’t know how to pronounce that, Bradley. I apologize. You can correct me somewhere. I hear that correcting people on the internet is sometimes, sometimes happens. It’s a bit of a national pastime at this point. Anyway, the question was, when you’re dealing with a parameter sniffing situation, in a situation where SQL Server comes up with two or even more different execution plans based on which parameter it was compiled with the first time around, why not always just optimize for a big, why not just optimize for a big, crazy value so that you always get a big, powerful plan, probably parallel, probably ask for a decent chunk of memory, all that other stuff. Well, there are, I think, for me, some pretty fair reasons not to always do that. And those fair reasons come down to, of course, resources.

Now, if I look at the hardware that I have in my laptop, I have a processor in there with four cores that are hyper-threaded, unfortunately. I apologize to everyone out there who hates hyper-threading. And I also have 64 gigs of memory in my laptop, of which about 50 is dedicated to SQL Server. When I run these two queries, I can see how many worker threads I have available for SQL Server, which is 576. And I can see how much memory I have available to give out to queries. If I go down here and I zoom in a little bit, I can see that my total and my available memory are about the same. And this is how much memory in gigs I can give out to queries for memory grants.

Memory grants is, of course, memory that queries ask for outside of the usual. I have to run stuff to do other things like sort or hash or, you know, do some columnstore stuff that, excuse me, that consumes additional memory. And these are limits. When you start up SQL Server, depending on how many cores you have assigned to your server, and depending on how much memory you have in your server and your max server memory, SQL Server sets limits for how much it’ll allow itself to give out for different things.

Whenever a query runs, it has to take a little piece from those things. The more pieces that these queries are asking for, the fewer queries in total you can have running. For example, with a serial query, with 576 worker threads, I can run 576 copies of that query. If I have a query that goes parallel and it reserves more worker threads, well, whatever DOP is, is going to tell SQL Server how many parallel threads it can use in a branch.

And if I have multiple concurrent branches, SQL Server, just for example, on my laptop, I have max DOP set to 4. So if I have two concurrent branches, that’s 8 threads. And if I have three concurrent branches, that’s 12 threads. So the more parallel queries, the more parallel branches in those queries, the more threads they can just reserve and run with.

Ditto memory. If a query comes along and asks for a large memory grant, and SQL Server is able to grant the entire thing, well, if I have a query that asks for one gig of memory, and currently I can run just about 37 of them, or let’s just say 36 to be safe.

If I have a query that asks for 10 gigs of memory, I can run far fewer of them concurrently. So if we go over to this tab, and we look at a store procedure where I’ve recompiled before executing for two different parameters, 9 and 0, I get two different execution plans.

This top plan is a serial plan, and if I look at how much memory it asks for, it’s about 17 megs. 1, 7, 1, 1, 2. And if I look at how many threads it asks for, an F4 over here, it’s just one, because it’s a serial query.

This will come in handy in a minute. If I look at the second query, look at the select operator, this thing has asked for, let’s see, 7794944. That’s a seven-digit number.

So since it’s 779, I’m going to say that’s 7.8 gigs of memory, as opposed to 17 for the serial query. If you remember what’s on that other tab, about 37, I can’t run as many of these at once as I can of the other one at once. Far fewer, in fact.

If I look at how many threads this thing asks for, if I… Sorry, we’re going to have a dance party for a moment. Oh, alright.

You know, I’m always worried about playing music while a video, while I’m recording a video. But you know what? It’s alright with me. Anyway, if we look at how many threads this query reserved, we can see that we had one branch that was available to execute concurrently.

And we reserved four threads. So that’s not a ton. Granted, there are queries where you can have a lot more than this going on.

But for this query, in four threads, we can run far fewer of these copies concurrently than we can of the single-threaded version. So for me, when I think about why not just optimize for a big value, right? Why not just have every query run as forcefully as possible?

It’s a concurrency thing. And I know that when a lot of people think about concurrency, they think of locking and blocking and deadlocks and other things that kind of hold other queries up. But concurrency goes beyond that.

Concurrency also goes into, you know, from a resource perspective, right? So like not a logical resource like a lock, but a physical resource like how many threads you have or how much memory you have to give out to queries. These are hard limits.

The more queries you have that take up more of those resources, the fewer of those queries you can run. On a larger server, like on a big, big server, that might shut up windows. That might make less of a difference.

On a smaller server, say that’s maybe already a little bit underpowered for your workload, you might end up with a pretty bad situation. If you run out of worker threads, you hit a weight called thread pool. If you run out of memory to give out to queries, you hit a weight called resource semaphore.

So when asked why not just go with the big plan, well, it’s because of that. Because you have hard limits inside of your SQL Server for how much you can give out to queries. Of course, if you don’t care about concurrency, then the problem is solved for you.

Anyway, my name’s Erik Darling with Erik Darling Data. And thank you for watching. Bye.

Going Further


If this is the kind of SQL Server stuff you love learning about, you’ll love my training. Blog readers get 25% off the Everything Bundle — over 100 hours of performance tuning content. Need hands-on help? I offer consulting engagements from targeted investigations to ongoing retainers. Want a quick sanity check before committing to a full engagement? Schedule a call — no commitment required.

A Trick For Working Around Scalar UDF Performance Issues In SQL Server

Mr. Duster


Thanks for watching!

Video Summary

In this video, I share a performance tuning shortcut that came in handy during a recent client project. When working with complex queries involving scalar-valued functions, sometimes the best approach is not to rewrite everything from scratch but to take a “band-aid” route. By temporarily removing these functions and dumping the data into a temporary table, we can significantly improve query performance without losing functionality. This method allows us to run our big, complex queries faster while still applying necessary formatting later on, ensuring that scalar-valued functions don’t hinder overall performance. It’s a practical solution for those of us who need quick wins in SQL Server tuning until more comprehensive optimizations can be implemented.

Full Transcript

Howdy folks, Erik Darling here with the old Erik Darling data. And I want to show you a kind of a funny little performance tuning shortcut that actually came in handy earlier this week. Now, when I’m working with clients, my job is to get them the fastest possible solution to their problem that, you know, that it’s like possible, right? So it’s like, some times I can touch more stuff than others. Other times I can touch less stuff than others. Either way, my job is to get people moving faster in a hurry. Sometimes, like, you know, in a perfect world, we can all take a lot of time to perfectly tune this, that, and the other thing to change, you know, functions and indexes and queries all over the place to get the perfect code. Other times, it’s, we can take what I like to call the band-aid route and we can put a band-aid on it. That gets us to a much, much better place for now until we can get to that wonderful Arcadian pasture that is perfect performance. I know, right? So what I’m going to show you is something that came in handy earlier this week. When I was tuning, it was a much bigger query than the one you’re looking at on the screen. It was a big tangle with, like, a 500-line where clause and all this other stuff.

And there’s a lot of complex stuff going on, even in the select case expressions and whatnot. But what it came down to was that there were a bunch of functions. Now, in the query that I’m looking at, I only have one function, and it’s called initial cap. And it does exactly what it sounds like. It’ll take a string, and it’ll make the first letter a capital, and it’ll make any letter after a space a capital. It’s a scalar valued function. And while we’re all breathlessly awaiting these things not sucking in SQL Server 2019, there are a whole heck of a lot of us who have to deal with versions of SQL Server that do not have the magic of Freud. Now, the real query that I dealt with had a bunch of formatting functions in it.

So, like, there were a whole bunch of things that formatted, like, phone numbers and postal codes and dates and all this other crazy stuff. And I know what you’re thinking. You can’t just, like, use convert to formatted date? No, apparently not. Apparently, you need to scale our valued function to do that. So, rather than sit there and rewrite every single function and mess with logic and results, here’s what I did. Now, I’m going to show you exactly how this reproduces with this query. I’m going to turn on query plans, and I’m going to fire this thing off. And this thing is going to run for around about 11 or 12 seconds.

And part of the problem with the way this query runs is that because of this scalar value function in there, it’s forced to run serially. Now, another problem that scalar valued functions have is that they run once per row, not once per query. We can kind of see that if we look in the query plan and we look at this compute scalar operator.

If we hit F4 here, we can see that this is where that init cap function gets called. All right? So, that’s where we do it. But we do it at the very end. And we only do this over 500 rows. So, this function running 500 times isn’t going to be a big deal.

What’s a much, much bigger deal for this query is that it’s forced to run serially. If we look at the properties of the select operator, we have this non-parallel plan reason could not generate valid parallel plan. This started in the SQL Server 2012 plan XML. This would start showing up in there.

So, if you’re on 2008 or 2008 R2, you’re not going to see this. If you’re on 2012 plus, you will see that if you have some construct in your query plan forcing things to run serially. Now, since there were a bunch of functions in the actual code that I was tuning, what I decided to do was, rather than spend my time and waste someone’s money rewriting a bunch of functions and trying to toggle with indexes and this, that, and the other thing, I just wanted to see how the query ran if I took the functions out.

And that’s what I did in this query right here below it. Is rather than have a reference to the formatted display name, I just have the display name. So, I quoted out the functions and I kept the columns in that the functions were formatting.

And, oops, I hit F5, but I highlighted the whole thing as a professional query performance tuner. I cannot impress upon you enough the importance of highlighting the entire query. So, I highlighted the entire, in real life, I highlighted the entire query.

And I hit F5, and it ran much faster. That finished in 2 seconds, rather than, what, 12 seconds or something? Yeah, it took 12 seconds.

So, we improved this query by 10 seconds, just by not having the scalar function in there. Of course, the reason this query runs much faster isn’t because that function did anything so heinous. It’s because this query was allowed to go parallel.

So, now that we have all this parallelism going on in here, the root query finishes much faster. Now, there are a lot of caveats, and I’m not saying that a query going parallel is always a good thing, or that you should have as many queries going parallel at once as possible, because that has effects on concurrency, how many threads get used by queries, how many threads get used by overall workload.

But, in this case, it didn’t hurt too much. So, what I did is I took that query, and I said, well, you know what? This query gets us close to what we need. We just need to format that data at some point.

And I’m going to tell you something about scalar valued functions. In small doses, they’re not that bad. In small doses, they’re okay.

They’re not too terrible, which I know is not a great thing to say. Everyone’s just going to come up with torches and pitforks and tell me that scalar valued functions are the devil. And a lot of the times, I’ll agree with them.

But in this case, where we’re just formatting data, the scalar valued functions aren’t going out to other tables and doing all sorts of other crazy things. We’re just formatting some data in place.

Well, that still will suck, but we can make it suck a whole lot less if we don’t let it impact our big queries and if we only do it on a limited number of rows later. So, what we can do, and this is a trick that you can try out, is if you have your big queries and lots of scalar valued functions in them, you don’t want to rewrite a bunch of scalar valued functions and have a whole bunch of awful things.

I get it. It’s hard. It’s daunting. But what you can do is you can take your big, mean, nasty, awful queries, and you can dump them into a temp table.

And the dump into a temp table will still take about two seconds to finish. All right. So, that still takes, you know, a couple seconds to get the data into the temp table, but it’s a lot faster than the 12 seconds that we waited for when we just needed to select all the data.

And then after we have data in a temp table, well, now we can just call our functions on what’s remaining. So, now if I hit F5 here, well, that finishes just about as quick as you could want it to finish. So, we still have, like, the old, like, we still have a big query that we have to run and do stuff with, but that query isn’t impacted by the side effects of scalar valued functions.

So, that’s one way to kind of skirt around the issue and then get the data that, get whatever the scalar valued functions need to do at a later point. Anyway, I thought that I would share that with you in video form because I care about you and I care about the health and well-being.

No, I’m kidding. Yeah. No. No. Good luck. Good luck. I wish you luck out there. Anyway, I’m Erik Darling.

Thanks for watching. I hope you learned something. I hope you enjoyed yourselves. And I will see you in some other video some other time. Goodbye. Bye. Bye.

Video Summary

In this video, I share a performance tuning shortcut that came in handy during a recent client project. When working with complex queries involving scalar-valued functions, sometimes the best approach is not to rewrite everything from scratch but to take a “band-aid” route. By temporarily removing these functions and dumping the data into a temporary table, we can significantly improve query performance without losing functionality. This method allows us to run our big, complex queries faster while still applying necessary formatting later on, ensuring that scalar-valued functions don’t hinder overall performance. It’s a practical solution for those of us who need quick wins in SQL Server tuning until more comprehensive optimizations can be implemented.

Full Transcript

Howdy folks, Erik Darling here with the old Erik Darling data. And I want to show you a kind of a funny little performance tuning shortcut that actually came in handy earlier this week. Now, when I’m working with clients, my job is to get them the fastest possible solution to their problem that, you know, that it’s like possible, right? So it’s like, some times I can touch more stuff than others. Other times I can touch less stuff than others. Either way, my job is to get people moving faster in a hurry. Sometimes, like, you know, in a perfect world, we can all take a lot of time to perfectly tune this, that, and the other thing to change, you know, functions and indexes and queries all over the place to get the perfect code. Other times, it’s, we can take what I like to call the band-aid route and we can put a band-aid on it. That gets us to a much, much better place for now until we can get to that wonderful Arcadian pasture that is perfect performance. I know, right? So what I’m going to show you is something that came in handy earlier this week. When I was tuning, it was a much bigger query than the one you’re looking at on the screen. It was a big tangle with, like, a 500-line where clause and all this other stuff.

And there’s a lot of complex stuff going on, even in the select case expressions and whatnot. But what it came down to was that there were a bunch of functions. Now, in the query that I’m looking at, I only have one function, and it’s called initial cap. And it does exactly what it sounds like. It’ll take a string, and it’ll make the first letter a capital, and it’ll make any letter after a space a capital. It’s a scalar valued function. And while we’re all breathlessly awaiting these things not sucking in SQL Server 2019, there are a whole heck of a lot of us who have to deal with versions of SQL Server that do not have the magic of Freud. Now, the real query that I dealt with had a bunch of formatting functions in it.

So, like, there were a whole bunch of things that formatted, like, phone numbers and postal codes and dates and all this other crazy stuff. And I know what you’re thinking. You can’t just, like, use convert to formatted date? No, apparently not. Apparently, you need to scale our valued function to do that. So, rather than sit there and rewrite every single function and mess with logic and results, here’s what I did. Now, I’m going to show you exactly how this reproduces with this query. I’m going to turn on query plans, and I’m going to fire this thing off. And this thing is going to run for around about 11 or 12 seconds.

And part of the problem with the way this query runs is that because of this scalar value function in there, it’s forced to run serially. Now, another problem that scalar valued functions have is that they run once per row, not once per query. We can kind of see that if we look in the query plan and we look at this compute scalar operator.

If we hit F4 here, we can see that this is where that init cap function gets called. All right? So, that’s where we do it. But we do it at the very end. And we only do this over 500 rows. So, this function running 500 times isn’t going to be a big deal.

What’s a much, much bigger deal for this query is that it’s forced to run serially. If we look at the properties of the select operator, we have this non-parallel plan reason could not generate valid parallel plan. This started in the SQL Server 2012 plan XML. This would start showing up in there.

So, if you’re on 2008 or 2008 R2, you’re not going to see this. If you’re on 2012 plus, you will see that if you have some construct in your query plan forcing things to run serially. Now, since there were a bunch of functions in the actual code that I was tuning, what I decided to do was, rather than spend my time and waste someone’s money rewriting a bunch of functions and trying to toggle with indexes and this, that, and the other thing, I just wanted to see how the query ran if I took the functions out.

And that’s what I did in this query right here below it. Is rather than have a reference to the formatted display name, I just have the display name. So, I quoted out the functions and I kept the columns in that the functions were formatting.

And, oops, I hit F5, but I highlighted the whole thing as a professional query performance tuner. I cannot impress upon you enough the importance of highlighting the entire query. So, I highlighted the entire, in real life, I highlighted the entire query.

And I hit F5, and it ran much faster. That finished in 2 seconds, rather than, what, 12 seconds or something? Yeah, it took 12 seconds.

So, we improved this query by 10 seconds, just by not having the scalar function in there. Of course, the reason this query runs much faster isn’t because that function did anything so heinous. It’s because this query was allowed to go parallel.

So, now that we have all this parallelism going on in here, the root query finishes much faster. Now, there are a lot of caveats, and I’m not saying that a query going parallel is always a good thing, or that you should have as many queries going parallel at once as possible, because that has effects on concurrency, how many threads get used by queries, how many threads get used by overall workload.

But, in this case, it didn’t hurt too much. So, what I did is I took that query, and I said, well, you know what? This query gets us close to what we need. We just need to format that data at some point.

And I’m going to tell you something about scalar valued functions. In small doses, they’re not that bad. In small doses, they’re okay.

They’re not too terrible, which I know is not a great thing to say. Everyone’s just going to come up with torches and pitforks and tell me that scalar valued functions are the devil. And a lot of the times, I’ll agree with them.

But in this case, where we’re just formatting data, the scalar valued functions aren’t going out to other tables and doing all sorts of other crazy things. We’re just formatting some data in place.

Well, that still will suck, but we can make it suck a whole lot less if we don’t let it impact our big queries and if we only do it on a limited number of rows later. So, what we can do, and this is a trick that you can try out, is if you have your big queries and lots of scalar valued functions in them, you don’t want to rewrite a bunch of scalar valued functions and have a whole bunch of awful things.

I get it. It’s hard. It’s daunting. But what you can do is you can take your big, mean, nasty, awful queries, and you can dump them into a temp table.

And the dump into a temp table will still take about two seconds to finish. All right. So, that still takes, you know, a couple seconds to get the data into the temp table, but it’s a lot faster than the 12 seconds that we waited for when we just needed to select all the data.

And then after we have data in a temp table, well, now we can just call our functions on what’s remaining. So, now if I hit F5 here, well, that finishes just about as quick as you could want it to finish. So, we still have, like, the old, like, we still have a big query that we have to run and do stuff with, but that query isn’t impacted by the side effects of scalar valued functions.

So, that’s one way to kind of skirt around the issue and then get the data that, get whatever the scalar valued functions need to do at a later point. Anyway, I thought that I would share that with you in video form because I care about you and I care about the health and well-being.

No, I’m kidding. Yeah. No. No. Good luck. Good luck. I wish you luck out there. Anyway, I’m Erik Darling.

Thanks for watching. I hope you learned something. I hope you enjoyed yourselves. And I will see you in some other video some other time. Goodbye. Bye. Bye.

Going Further


If this is the kind of SQL Server stuff you love learning about, you’ll love my training. Blog readers get 25% off the Everything Bundle — over 100 hours of performance tuning content. Need hands-on help? I offer consulting engagements from targeted investigations to ongoing retainers. Want a quick sanity check before committing to a full engagement? Schedule a call — no commitment required.

CMEMTHREAD Waits Generated By Query Store In SQL Server

Memethread


Thanks for watching!

Video Summary

In this video, I delve into a critical issue related to QueryStore and its impact on CmemThread weights in SQL Server. Initially, my investigation led me to incorrectly attribute the problem to the plan cache, but further analysis revealed that it was actually due to QueryStore being enabled. I walk through setting up various configurations, including turning QueryStore on and off, optimizing for ad hoc workloads, and forcing parameterization, to demonstrate how these settings affect CmemThread weights and query store size. The video highlights the potential pitfalls of relying solely on QueryStore without proper management, emphasizing that optimized for ad hoc workloads does not address this specific issue. I also provide practical solutions and insights into managing query store effectively to avoid excessive memory grants and plan cache bloat.

Full Transcript

Hello! Erik Darling here with Erik Darling Data and I am here to apologize and make right on a video that I recorded yesterday about CmemThread and the plan cache. I was devastatingly, horribly, horribly wrong. And I didn’t realize it until later that I had a setting on on my server, on my laptop, on my database called QueryStore turned on. And the CmemThreadWeights were not the fault of the plan cache, they were the fault of QueryStore. And I’m going to show you exactly what happened. So right now, I’ve got some queries up on the screen. This query here will tell me if I have optimized for ad hoc workloads turned on, if I have parameterization set to forced or not, and the state of my QueryStore thing for the Stack Overflow 2013 database. I’ve also got some queries here to turn QueryStore on and off and to clear it out. So my capture mode is going to be read-write, my max storage size is going to be 100 megs, my capture mode is going to be auto, meaning I don’t capture absolutely everything. I only capture stuff that SQL Server thinks is important. And I’ve got size based cleanup mode turned on, meaning when QueryStore hits 100 megs, size based cleanup should kick in and clear everything right out. I’ve also got some queries here to look at how many cached plans I have, and to look at if I’m hitting CmemThreadWeights, and to look at the current size of QueryStore for the Stack Overflow 2013 database. I’ve got some other utility queries down here. This is to clear out the plan cache and to clear out weight stats on my server so that I can refresh things and between runs to show you differences. I’ve got my O stress command here set to run 20 copies of my randomizer store procedure, which I’ll talk to you about in a minute. And that does some stuff over there. And then I’ve also got queries to turn optimized for ad hoc workloads on and off and just set parameterization to simple and forced. My randomizer query looks like this. It grabs some weird values from the sys.messages table, six minute cursor, six minute cursor, and basically iterates over that cursor. And depending on what seed value this thing has, let me stick a semicolon there to make sure that I have everything correct. I would hate to not terminate a statement properly.

But depending on what number comes up here, I’m going to select from a different table in the Stack Overflow database, depending on that. So if it’s one, badges, two comments, three posts, four users, five votes. And I’m going to pass the two little funny values that I get from sys.messages up here, which looks something like this, into the end clause down here. So that’s what that randomizer store procedure does. It’s pretty simple. Pretty simple stuff, right? Good stuff there.

If we come back over here, what I’m going to do is I’m going to look at what I currently have going on. And in my data’s, various data’s, I have 169 plans in the cache. I have no seam emptied weights. And query store, because it’s off right now, has a size of zero megs. Now what I’m going to do with query store off, and this is to set up a baseline, clear that out.

And what I’m going to do is I’m going to kick off that O stress command, and I’m going to look at what happens. Now we’re running that query across 20 threads, just to simulate like, you know, sort of a heavy ad hoc workload. And as we hit F5 on these, the plans in the cache will start going up, and Cmem thread weights will stay relatively low.

Right now we have 10,000 plans in the cache and no Cmem thread. So if I keep running this and looking at things, I don’t know why that changed context, Tommy. That was a little bit weird. But if I keep running these, now I have 51,000 plans in the cache.

21 things have waited on Cmem thread, and that’s not a lot. I go over here and I keep running these. 80, about 73,000 plans in the cache. Still relatively low Cmem thread.

Only 70 things have waited. I’m not worried about this kind of Cmem thread weight. If I just keep doing this, Cmem thread is not going to go up a whole lot. That’s the baseline. That’s to show you that it’s not the plan cache’s fault that our ad hoc workload is generating a bunch of Cmem thread.

It’s not the plan cache. Whoever says it’s not the plan cache out there, I agree with you 100%. It’s not the plan cache’s fault. Now, I want to show you what happens that’s different when I turn query store on.

So I’m going to hit this, and I’m going to set query store to on for this database. And so we are now capturing data. If we go back up here and rerun this query, we will see that query store is set to read write.

And so the desired and the actual state are both in read write mode. So cool, we have query store turned on. We should be rocking and rolling at this point.

Let’s go rerun our workload again. F5 there. Not F5. Hit enter there. Sometimes I get confused.

But now when I start running this, Cmem thread weights are going to start jumping up really, really quickly. So I hit this, and we’re at 12,000 plans. And as we go up, Cmem thread weights are going to go up and up much faster than they do without query store turned on.

So you can see that I’m hitting some weights here. I’m already up to 1,000 Cmem thread weights. And you can see the size of query store steadily increasing.

We’re up to 63 megs. We’re up to 69 megs. And as we keep going up here, Cmem thread is going to keep increasing. Cmem thread is going to keep going up and up and up.

So this was not happening with the plan cache. This is only happening with query store turned on. So now I’m running all this stuff. Now we’re up to 4,200 Cmem thread weights. And now the query store size is bigger than the max size that I set it to.

If I keep hitting this, query store is going to keep getting bigger and bigger and bigger. And our Cmem thread weights are going to keep going up and up and up. Right now the current size of query store is 166, 173.

This is just going to keep going up. And Cmem thread weights are going to keep going up with it. Query store is now at about twice the max size that I set it to.

Size-based cleanup should be kicking in and clearing stuff out. I just don’t think it can keep up right now. So I’m sticking all these queries in.

I’m hitting this. And you can just see everything piling up. Query store is now nearly 250 megs. And Cmem thread weights keep on going up and up and up and up and up and up.

Now, this can be a real problem for a lot of people. If you have an ad hoc workload like this, you might be very concerned that, you know, the query store is going to overfill, that, you know, cleanup is never going to quite catch up.

And now you’re going to have all these funky Cmem thread weights going on in your server. At this point now, query store is nearly three times the size of the max size that I set it to. And cleanup doesn’t really seem to be doing its thing.

We’re getting up really close to 300 megs there. So what I’m going to do is I’m going to kill off of this. And I’m going to talk about a couple options that I thought I would walk through to try and fix this.

Now, the first one that I tried was optimized for ad hoc workloads. Now, if we look at, to turn optimized for ad hoc workloads on, if you’re in Azure SQL DB, you can do this with a database scope configuration.

If you’re on regular SQL Server, you can. It would be nice if that made it there. I tried it last night and I just kept getting errors. And then I looked more closely at the documentation. It was like, oh, yeah, only for Azure SQL DB.

So right now we can only turn this on at the server level for SQL Server 2017. So I’m going to do that. I’m going to turn on optimized for ad hoc workloads. And I’m going to give one more check-in up here to see what things look like.

And you’ll see that now that our query store size is nearly 400 megs, size-based cleanup is not doing its thing. So we’re going to do its job for it.

And hopefully this will work. Hopefully. We might be sitting here for a while. Oh, there we go.

That only took 13 seconds. Good for us. Okay. So let’s see how big query store is currently. All right. Zero megs. Good. We cleared all that stuff out. And let’s go check our stuff over here. So now we have optimized for ad hoc workloads turned on.

That is at 1. Sweet. Now, with that at 1, let’s go clear out all that stuff that we had before. And let’s check back in.

Let’s make sure our queries are returning close to zero. All right. So four plans in cache. I can live with that. That’s some system stuff going on in the background. See memthreads at zeros across the board. And query store is off.

So we’re at zero there. Because we have a baseline with the ad hoc, with the workload running without any special settings and see memthread being low, I’m not going to repeat it with query store off and ad hoc turned on.

There’s no point. That’s not helping us here. That’s not helping the effect that we’re having. The effect that we’re specifically having is that with query store turned on, we hit a lot of cmemthread weights.

So I’m going to turn query store back on. So now if we go check in on this, we should see query store set to read write. And we should see the value in use set to 1 for ad hoc workloads.

Okay. With that in place, let’s go back over here. Let’s hit F5. Let’s see. We have 10 plans in the cache now. Good heavens. We still have no cmemthread.

And, of course, query store size is zero. Because why would it be anything else? We just turned it back on. Let’s hit F5 there. Or enter or up arrow, enter or whatever you want to call it. Whatever.

O stress. And then I’m going to start running these. And when I run these, plans in the cache are going to start piling up. And so is cmemthread.

And so is the size of query store. And if I keep doing this and we keep looking at stuff. And, again, this just keeps bizarrely changing context on me. We’ll see kind of the same pattern start to happen.

Where my mouse refuses to click and work in the right way. I don’t know what it is. I’m going to stop spending $100 on mice that stop working after a few months. It’s pretty ridiculous.

But if I keep running these queries, we’re going to keep seeing. We’re going to see the number of plans in the cache pile up. We’re going to see the cmemthread weights pile up. And we’re going to see the size of query store just keep going up and getting bigger and bigger. The two important things to take away from here is that optimized for ad hoc workloads is not fixing this specific problem.

Where we’re hitting cmemthread weights. And the size of query store is going up way above the max that we set it at. Size-based cleanup is also not doing its job in cleaning this thing up fast enough.

So we’re actually facing the exact same problem. Optimize for ad hoc workloads isn’t helping us here. I’m not going to let that run for as long because we already know kind of what’s happening.

So let’s get rid of query store. We already killed our workload. Going to get that off. Okay, cool. Now let’s turn off optimized for ad hoc workloads. I want to make sure that I have a fresh start here.

And let’s turn on forced parameterization. So forced parameterization is turned on. And let’s clear out all of this stuff. And let’s see what we have here.

Oh, wrong button. It’s a morning of wrong buttons. All right. So four plans in the cache. No cmemthread weights. Query store is, of course, at zero megs because we have it turned off right now. So I’m going to go turn query store on.

Bada bing, bada boom. Let’s go make sure that we have all the stuff we want here. Perfect. So read, write, read, write. Parameterization is set to forced.

All right. Let’s check in on these numbers. Make sure we don’t have anything too weird. We don’t. Nine plans in the cache. No cmemthread. Query store is at zero because we just turned it on. And we’re going to go hit whatever damn, whatever you want to call that button, we’re going to hit it.

I’m going to run this thing. Run it. Come over here. Highlight you. And let’s start running this thing.

All right. So what we’re going to notice with forced parameterization turned on, at least if this demo works as it has worked all morning, which it very well may not. Who knows?

As soon as you’re recording, every bad thing happens. Everything goes wrong when you start recording. Anyway. So what we see here is the number of plans in the cache is skyrocketing. We’re up to 100 and something thousand, 157,000, but very low cmemthread.

The other thing I want you to notice is that the size of query store is zero megs. It’s not that we’re not collecting anything. It’s just that when SQL Server is doing a pretty good job of only putting one copy of the parameterized plan in there.

So as we go through and we look at this, we can see that query store size is not ballooning. Cmemthread weights are staying relatively low compared to other times when we ran this. But the number of plans in the cache is sort of astoundingly high.

Now, I’m going to keep running this. And basically what we’re going to see here is that forced parameterization does help us avoid the majority of the cmemthread weights and the ballooning size of query store. For some reason, that’s not helping us with the plan cache.

With the plan cache, we’re still not getting very good plan reuse. So that’s an issue, but that’s an issue for another day. This video is pretty specifically aimed at cmemthread weights as they relate to the query store and how big the query store gets and how it doesn’t clean up and all the other kind of crazy stuff.

I had a much, much worse time with this last night when I was originally running through the demo trying to get it worked out. At one point, query store was 700 megs, and the only way I could get it to turn off and clear out was by restarting my entire laptop. And that was not pleasant because in my head I’m thinking, my God, if you’re doing this in production, you don’t want to have to restart production just to get query store to clean out.

Anyway, my name’s Erik Darling, that one, with Erik Darling Data. And thank you for watching. I hope you got some useful information out of this.

And I will see you, I don’t know, maybe in a week or so because it’s the weekend and I feel like doing other things. Goodbye.

Going Further


If this is the kind of SQL Server stuff you love learning about, you’ll love my training. Blog readers get 25% off the Everything Bundle — over 100 hours of performance tuning content. Need hands-on help? I offer consulting engagements from targeted investigations to ongoing retainers. Want a quick sanity check before committing to a full engagement? Schedule a call — no commitment required.

Does SQL Server 2019 Help With Multiple Scalar Function Calls?

Waybad Machine


In yesterday’s post, we looked at a clever way to reduce calls to a scalar UDF using APPLY.

Today, we’re going to see if 2019 changes anything, and if our old trick still tricks.

Because, you know, what else do you do when you need to write 5 blog posts a week?

LOVE YOU!

Don’t Be A Donkey


I’m going to abridge this a little bit, since all the code is referenced at the link up there.

I’m also going to show you some stuff using Plan Explorer.

Why?

Because SSMS kept opening the plan XML as XML, and that makes for crap screenshots.

Here’s the results for the plan with two function references. It runs for ~2.2 seconds.

SQL Server Query Plan
Honesty, at last.

If you remember yesterday’s post (and why wouldn’t you, hm?) the query plans didn’t show us touching other tables at all.

Just seeking into the Users table and then magically computing scalars and filtering.

One of the nice things about scalar UDF inlining: honesty.

But, you know, the two where clause references end up expanding. We’re hitting pretty big tables, here, too.

Apply-ish-ness


Using APPLY has a similar *ffect here. The function is only referenced and filtered once, and the duration is cut roughly in half.

Now, I know you’re probably thinking, because YOU REMEMBER YESTERDAY’S POST!

SQL Server Query Plan
Ming the Merciless

How come these queries are so much slower with the functions inlined?

Well, they’re not. With query plans turned off, the first one runs in ~900ms, and the second one runs in ~500ms.

Yesterday’s plans run for 1.6s and 600ms respectively with plans turns off.

Apparently observation has overhead. If only there were a clever phrase for that.

Not All Functions


The idea behind FROID is that it removes some restrictions around scalar valued functions.

  1. They can be inlined into the query, not run per-row returned
  2. They don’t force serial execution, so you can get a parallel plan

If your functions already run pretty quickly over a small  number of rows, and the calling query doesn’t qualify for parallelism, you may not see a remarkable speedup.

That’s fine, though, because inlining has other benefits:

  • Query plans are honest about the work they do
  • Measuring the query will show you work that used to be hidden behind the function call(s)

Even if every query doesn’t magically finish before you run it, you’ll see pretty good gains.

Thanks for reading!

Going Further


If this is the kind of SQL Server stuff you love learning about, you’ll love my training. Blog readers get 25% off the Everything Bundle — over 100 hours of performance tuning content. Need hands-on help? I offer consulting engagements from targeted investigations to ongoing retainers. Want a quick sanity check before committing to a full engagement? Schedule a call — no commitment required.

A Hidden Value Of Apply With SQL Server Scalar UDFs

Look, Functions Suck


That’s why smart people have been working on making them suck less.

The things I see people doing with them range from “you know there’s a system function that does that” to “oh wow, you wrote an entire program in here”.

I’m not kidding. I once saw a function that was a wrapper for ISNULL that returned the results of ISNULL. I have no idea why.

If I had to think of a DBA prank, writing scalar UDFs that are just wrappers for system functions would be pretty high up there.

Especially if they had the same names as the system functions.

Turning Down The Suck


A while back, Jonathan Kehayias blogged about a way to speed up UDFs that might see NULL input.

Which is great, if your functions see NULL inputs.

But what if… What if they don’t?

And what if they’re in your WHERE clause?

And what if they’re in your WHERE clause multiple times?

Oh my.

Tick, Tick, Tick


Here’s our function.

CREATE FUNCTION dbo.TotalScore(@UserId INT)  
RETURNS BIGINT  
WITH RETURNS NULL ON NULL INPUT, SCHEMABINDING  
AS   
BEGIN    
    DECLARE @TotalScore BIGINT;        
    SELECT @TotalScore =   
    (  
        SELECT ISNULL(SUM(p.Score), 0)  
        FROM dbo.Posts AS p  
        WHERE p.OwnerUserId = @UserId  
    ) +  
    (  
        SELECT ISNULL(SUM(c.Score), 0)  
        FROM dbo.Comments AS c  
        WHERE c.UserId = @UserId  
    )        
    RETURN @TotalScore;    
END
GO

What it does is go out to the Posts and Comments tables and sums up the Score columns for a user.

We’ll use it in our query like this:

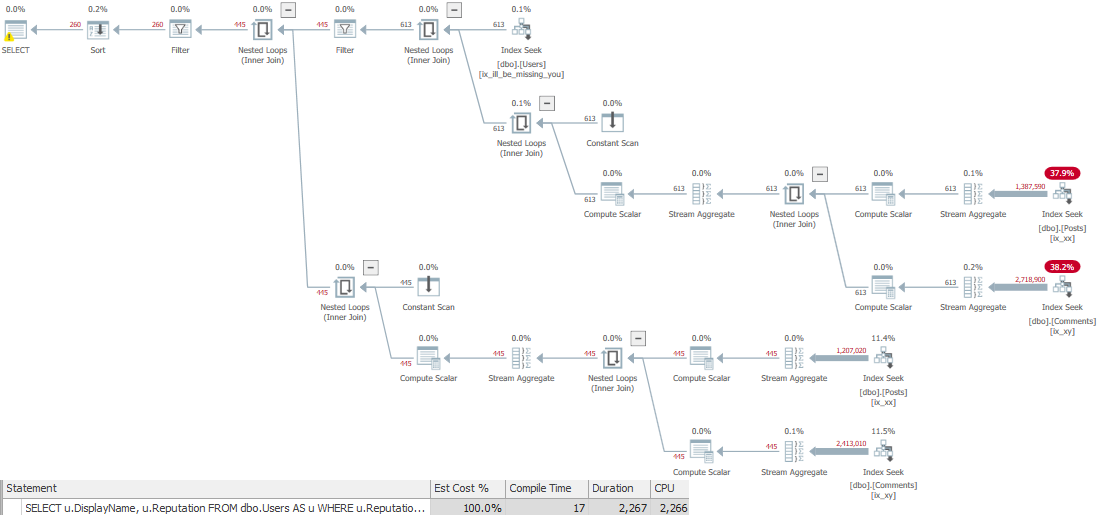
SELECT u.DisplayName, 
       u.Reputation
FROM dbo.Users AS u
WHERE u.Reputation >= 100000
AND dbo.TotalScore(u.Id) >= 10000
AND dbo.TotalScore(u.Id) < 20000
ORDER BY u.Id;

We want to find people with a total score between 10 and 20 thousand.

Right on.

When we run the query, the plan looks like this, showing 2 seconds of runtime.

SQL Server Query Plan
Two seconds for 260 rows is kinda wack tho

Tock, Tock, Tock


I know, I know. Get to the point. Make it faster, bouncer-man.

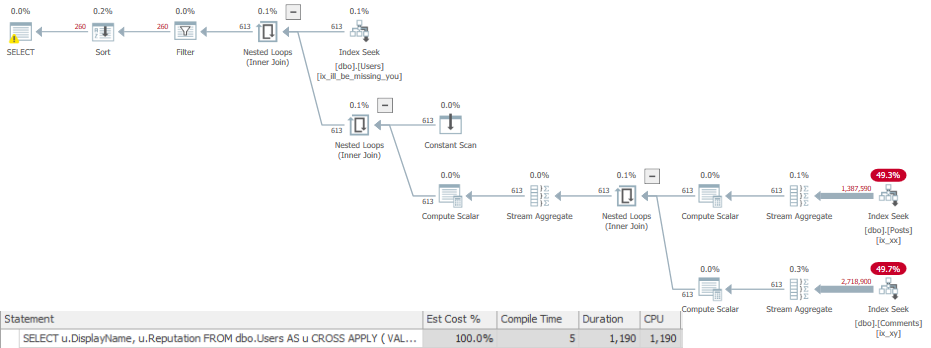
Our goal is to get the function to run fewer times, so we’ll replace multiple calls to it with one call.

SELECT u.DisplayName,
       u.Reputation
FROM dbo.Users AS u
CROSS APPLY
    (
        VALUES (dbo.TotalScore(u.Id))
    ) AS t (Score)
WHERE u.Reputation >= 100000
AND   t.Score >= 10000
AND   t.Score < 20000
ORDER BY u.Id;

Using this technique, the query runs for about 780ms.

SQL Server Query Plan
Check you out.

Tale of the XE


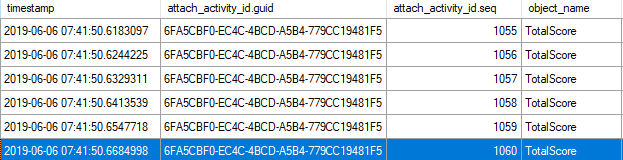
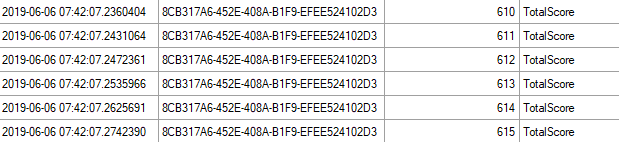
What happens that makes this faster is more evident if we use the XE session from Jonathan’s post for similar reasons, and look at how many times the function was called.

If we look at the activity sequence, it goes up to 1060 for the first query:

SQL Server Extended Events
Moved Out The Hood

And only 615 for the second query:

SQL Server Extended Events
Thinner~

Exeunt


Right now, if we want scalar UDFs to run faster, we can:

  • Tune the underlying query (if there is one)
  • Have them run fewer times
  • Wait for SQL Server 2019

In tomorrow’s post, I’ll look at the same scenario using CTP 3 of SQL Server 2019.

Thanks for reading!

Going Further


If this is the kind of SQL Server stuff you love learning about, you’ll love my training. Blog readers get 25% off the Everything Bundle — over 100 hours of performance tuning content. Need hands-on help? I offer consulting engagements from targeted investigations to ongoing retainers. Want a quick sanity check before committing to a full engagement? Schedule a call — no commitment required.

The Coming Froidpocalypse In SQL Server 2019

Legal Notice


I’ve trademarked: Froidrage, Froidulent, and Froidpocalypse.

If you want to use them, you have to pay me $10,000.

Alright, I’m being told by my lawyer that writing them on cocktail napkins and showing them to confused bartenders doesn’t actually register a trademark.

Nevermind.

Here’s What’s Gonna Happen


And it’s not a problem that you need SQL Server 2019 to see. All you have to do is try to rewrite a function.

Here’s our Villain, a scalar UDF.

CREATE FUNCTION dbo.Villain (@UserId INT)
RETURNS INT
WITH SCHEMABINDING, RETURNS NULL ON NULL INPUT
AS	
BEGIN

    DECLARE @Score INT
	SELECT TOP (1)
	         @Score = p.Score
	FROM dbo.Posts AS p
	WHERE p.OwnerUserId = @UserId
	AND   p.PostTypeId = 1
	ORDER BY p.Score DESC;
    
	RETURN @Score;

END
GO

Here’s the query that’s gonna call it:

SELECT      TOP ( 10 )
              u.DisplayName, 
			  u.Reputation, 
			  dbo.Villain(u.Id)
FROM        dbo.Users AS u
ORDER BY    u.Reputation DESC;
GO

I’m Going To Show You Two Things


The estimated plan, and the actual plan.

I need to show you the estimated plan so you can see what the function does, because that’s not included in the actual plan.

Yes, the estimated plan is more accurate than the actual plan.

Marinate on that.

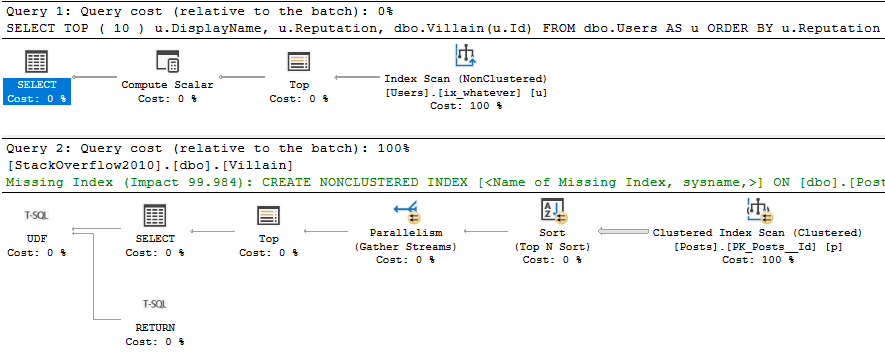
SQL Server Query Plan
On The Dancefloor

The important thing is the second plan, which is the function’s execution plan. Notice that it generated a missing index request, and doesn’t spool anything at all.

It handles the query logic with a Top N Sort.

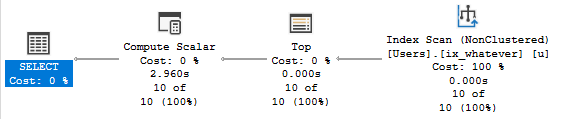
Here’s the actual plan:

SQL Server Query Plan
A NONCLUSTERED INDEX SCAN!!!

Let’s talk about a couple things:

  • A nonclustered index scan that costs 100% and runs for 0.000s
  • A compute scalar that costs 0% and runs for ~3s

The compute scalar thing is well documented by… Well, not by official Microsoft documentation.

But they’ve been blogged about by Cookies Cunningham, and Paul White.

Thanks, you two.

Any Reasonable Person


Would say “I can rewrite that function and make things better”.

Because of course an inline function is always better than a scalar function.

Enter our Hero.

CREATE FUNCTION dbo.Hero (@UserId INT)
RETURNS TABLE
WITH SCHEMABINDING
AS	
RETURN

	SELECT TOP (1)
	         p.Score
	FROM dbo.Posts AS p
	WHERE p.OwnerUserId = @UserId
	AND   p.PostTypeId = 1
	ORDER BY p.Score DESC;

GO

Here’s the query that’s gonna call it:

SELECT      TOP ( 10 )
              u.DisplayName, 
			  u.Reputation, 
			  h.*
FROM        dbo.Users AS u
CROSS APPLY dbo.Hero(u.Id) AS h
ORDER BY    u.Reputation DESC;

I Only Need To Show You One Thing


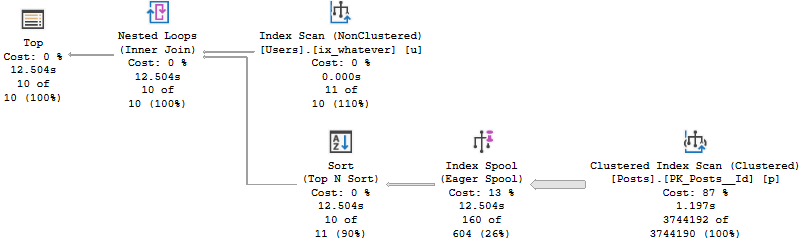
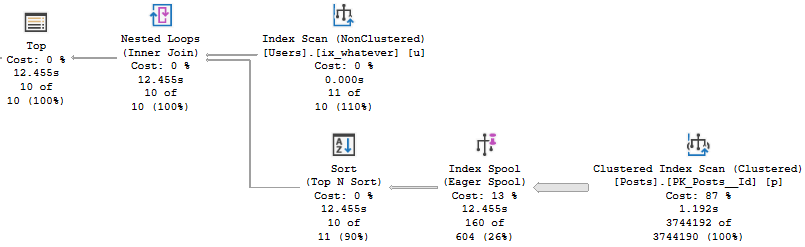
Since the function is an inline type, the query processor is honest with us about the full query plan.

SQL Server Query Plan
Spiced Ham

Two things happened here:

  • The “function body” no longer goes parallel
  • The TOP (1) is run against an eager index spool rather than the clustered index

What’s The Point?


This is what FROID does for you without a rewrite. It’ll inline the scalar UDF.

The plan may be better, or it may be worse.

The scalar UDF plan ran for 3 seconds, and the inline version ran for almost 13 seconds.

Stay tuned for tomorrow’s post. I have a couple suggestions for how The SQL Server team can help end users stay on top of these problems in SQL Server 2019.

Thanks for reading!

Going Further


If this is the kind of SQL Server stuff you love learning about, you’ll love my training. Blog readers get 25% off the Everything Bundle — over 100 hours of performance tuning content. Need hands-on help? I offer consulting engagements from targeted investigations to ongoing retainers. Want a quick sanity check before committing to a full engagement? Schedule a call — no commitment required.

Hey SQL Server Query, What Were You Waiting On?

Surreal Plans


In a parallel plan with an eager index spool, we can observe EXECSYNC waits for the duration of the spool being built.

In a serial plan, we’re not so lucky. There’s no obvious wait that indicates we built an index.

Let’s run a familiar query:

SELECT      TOP ( 10 )
            u.DisplayName, 
			u.Reputation, 
			ca.*
FROM        dbo.Users AS u
CROSS APPLY 
(   
    SELECT   TOP ( 1 )
			   p.Score
    FROM     dbo.Posts AS p
    WHERE    p.OwnerUserId = u.Id
    AND      p.PostTypeId = 1
    ORDER BY p.Score DESC 
) AS ca
ORDER BY    u.Reputation DESC;

The plan is fully serial:

SQL Server Query Plan
Meat Lovers

It’s obvious looking at the actual plan in SSMS 18 what took a long time.

If we’re not so lucky, and we have a cached plan, it would be less obvious:

SQL Server Query Plan
Back Like That

Look how bad scans are! Ha ha ha!

?

What’s A Wait?


If you wanna figure out the runtime, you have to do some math.

SQL Server Wait Stats
What times what?

If you take the SOS_SCHEDULER_YIELD waits and multiply them by 4ms, you can get about accurate runtime (12,444).

We’re lucky on my laptop that our query isn’t competing with other queries for processor time, so there’s not a long queue to get back on a CPU on each yield.

It’s nice to be able to see this while we’re watching a query, but if we come across it in the plan cache, or if we were looking at wait stats, what would we make of the problem?

Surely an operator that’s only 13% of the plan cost couldn’t be responsible for all that.

??

But There We Have It


A query that runs for a non-trivial amount of time, emits common wait stats, and doesn’t ask for an index when it’s creating one.

And that index creation is what makes up for 99% of the execution time.

Thanks for reading!

Going Further


If this is the kind of SQL Server stuff you love learning about, you’ll love my training. Blog readers get 25% off the Everything Bundle — over 100 hours of performance tuning content. Need hands-on help? I offer consulting engagements from targeted investigations to ongoing retainers. Want a quick sanity check before committing to a full engagement? Schedule a call — no commitment required.

How Select List Column Sizes Change How Big Spool Operators Are In SQL Server Query Plans

I’ll Use Those Columns Later, Maybe


This is a short post, since we’re on the subject of index spools this week, to show you that the columns that go into the spool will impact spool size and build time.

I know, that sounds obvious, but once in a while I care about “completeness”.

We’re going to look at two queries that build eager index spools, along with the time the spool takes to build and how many writes we do.

Query 1


On the side of the query where a spool gets built (inside the apply), we’re only selecting one column.

SELECT      TOP ( 10 )
            u.DisplayName, 
			u.Reputation, 
			ca.*
FROM        dbo.Users AS u
CROSS APPLY 
(   
    SELECT   TOP ( 1 )
			   p.Score
    FROM     dbo.Posts AS p
    WHERE    p.OwnerUserId = u.Id
    AND      p.PostTypeId = 1
    ORDER BY p.Score DESC 
) AS ca
ORDER BY    u.Reputation DESC;

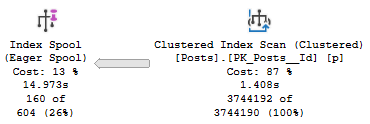
In the query plan, we spend 1.4 seconds reading from the Posts table, and 13.5 seconds building the index spool.

SQL Server Query Plan
Work it

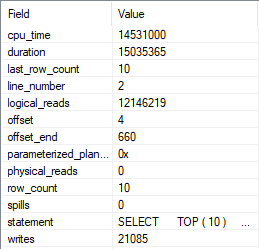
We also do 21,085 writes while building it.

SQL Server Extended Events
Insert comma

Query 2


Now we’re going to select every column in the Posts table, except Body.

If I select Body, SQL Server outsmarts me and doesn’t use a spool. Apparently even spools have morals.

SELECT      TOP ( 10 )
              u.DisplayName, 
			  u.Reputation, 
			ca.*
FROM        dbo.Users AS u
CROSS APPLY 
(   
    SELECT   TOP ( 1 )
               p.Id, p.AcceptedAnswerId, p.AnswerCount, p.ClosedDate, 
               p.CommentCount, p.CommunityOwnedDate, p.CreationDate,
               p.FavoriteCount, p.LastActivityDate, p.LastEditDate,
               p.LastEditorDisplayName, p.LastEditorUserId, p.OwnerUserId, 
               p.ParentId, p.PostTypeId, p.Score, p.Tags, p.Title, p.ViewCount
    FROM     dbo.Posts AS p
    WHERE    p.OwnerUserId = u.Id
    AND      p.PostTypeId = 1
    ORDER BY p.Score DESC 
) AS ca
ORDER BY    u.Reputation DESC;
GO

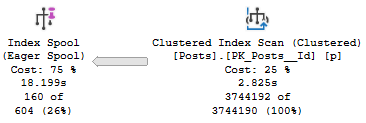
In the query plan, we spend 2.8 seconds reading from the Posts table, and 15.3 seconds building the index spool.

SQL Server Query Plan
Longer

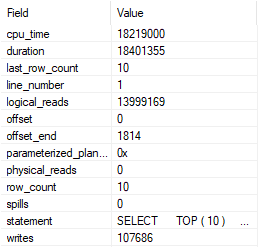
We also do more writes, at 107,686.

SQL Server Extended Events
And more!

This Is Not A Complaint


I just wanted to write this down, because I haven’t seen it written down anywhere else.

Thanks for reading!

Going Further


If this is the kind of SQL Server stuff you love learning about, you’ll love my training. Blog readers get 25% off the Everything Bundle — over 100 hours of performance tuning content. Need hands-on help? I offer consulting engagements from targeted investigations to ongoing retainers. Want a quick sanity check before committing to a full engagement? Schedule a call — no commitment required.