I use it often in my demo queries because I try to make the base query to show some behavior as simple as possible. That doesn’t always work out, but, whatever. I’m just a bouncer, after all.
The problem with very simple queries is that they may not trigger the parts of the optimizer that display the behavior I’m after. This is the result of them only reaching trivial optimization. For example, trivial plans will not go parallel.
If there’s one downside to making the query as simple as possible and using 1 = (SELECT 1), is that people get very distracted by it. Sometimes I think it would be less distracting to make the query complicated and make a joke about it instead.
The Trouble With Trivial
I already mentioned that trivial plans will never go parallel. That’s because they never reach that stage of optimization.
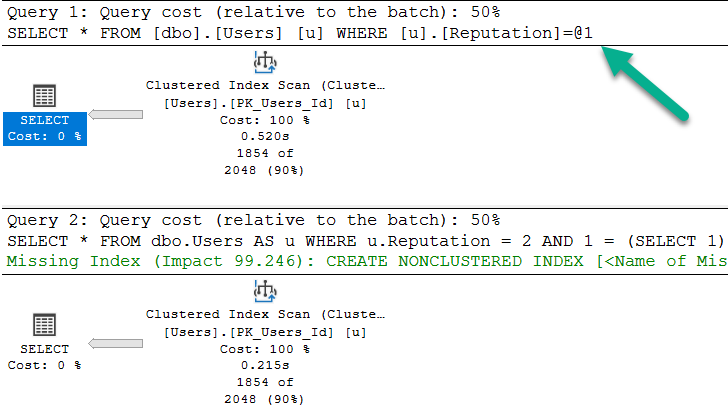
They also don’t reach the “index matching” portion of query optimization, which may trigger missing index requests, with all their fault and frailty.
	/*Nothing for you*/
	SELECT *
	FROM dbo.Users AS u
	WHERE u.Reputation = 2;

	/*Missing index requests*/
	SELECT *
	FROM dbo.Users AS u
	WHERE u.Reputation = 2
	AND 1 = (SELECT 1);
>greentext
Note that the bottom query gets a missing index request, and is not simple parameterized. The only reason the first query takes ~2x as long as the second query is because the cache was cold. In subsequent runs, they’re equal enough.
What Gets Fully Optimized?
Generally, things that introduce cost based decisions, and/or inflate the cost of a query > Cost Threshold for Parallelism.
Joins
Subqueries
Aggregations
Ordering without a supporting index
As a quick example, these two queries are fairly similar, but…
	/*Unique column*/
	SELECT TOP 1000 u.Id --Not this!
	FROM dbo.Users AS u
	GROUP BY u.Id;

	/*Non-unique column*/
	SELECT TOP 1000 u.Reputation --But this will!
	FROM dbo.Users AS u
	GROUP BY u.Reputation;
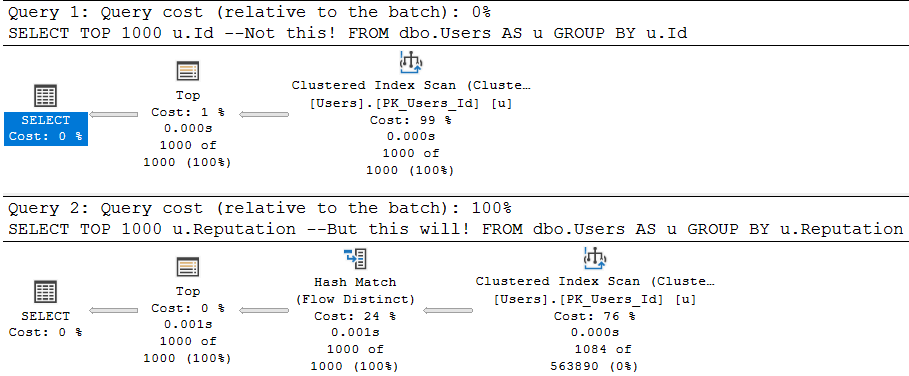
One attempts to aggregate a unique column (the pk of the Users table), and the other aggregates a non-unique column.
The optimizer is smart about this:
Flowy
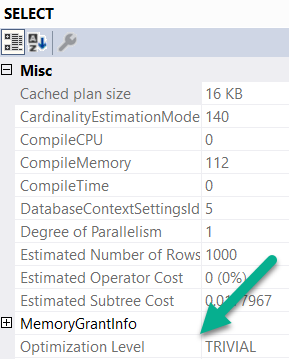
The first query is trivially optimized. If you want to see this, hit F4 when you’re looking at a query plan. Highlight the root operator (select, insert, update, delete — whatever), and look at the optimization level.
wouldacouldashoulda
Since aggregations have no effect on unique columns, the optimizer throws the group by away. Keep in mind, the optimizer has to know a column is unique for that to happen. It has to be guaranteed by a uniqueness constraint of some kind: primary key, unique index, unique constraint.
The second query introduces a choice, though! What’s the cheapest way to aggregate the Reputation column? Hash Match Aggregate? Stream Aggregate? Sort Distinct? The optimizer had to make a choice, so the optimization level is full.
What About Indexes?
Another component of trivial plan choice is when the choice of index is completely obvious. I typically see it when there’s either a) only a clustered index or b) when there’s a covering nonclustered index.
If there’s a non-covering nonclustered index, the choice of a key lookup vs. clustered index scan introduces that cost based decision, so trivial plans go out the window.
Here’s an example:
	CREATE INDEX ix_creationdate
	    ON dbo.Users(CreationDate);

	SELECT u.CreationDate, u.Id
	FROM dbo.Users AS u
	WHERE u.CreationDate >= '20131229';

	SELECT u.Reputation, u.Id
	FROM dbo.Users AS u
	WHERE u.Reputation = 2;

	SELECT u.Reputation, u.Id
	FROM dbo.Users AS u WITH(INDEX = ix_creationdate)
	WHERE u.Reputation = 2;
With an index only on CreationDate, the first query gets a trivial plan. There’s no cost based decision, and the index we created covers the query fully.
For the next two queries, the optimization level is full. The optimizer had a choice, illustrated by the third query. Thankfully it isn’t one that gets chosen unless we force the issue with a hint. It’s a very bad choice, but it exists.
When It’s Wack
Let’s say you create a constraint, because u loev ur datea.
	ALTER TABLE dbo.Users
        ADD CONSTRAINT cx_rep CHECK
			( Reputation >= 1 AND Reputation <= 2000000 );
When we run this query, our newly created and trusted constraint should let it bail out without doing any work.
	SELECT u.DisplayName, u.Age, u.Reputation
    FROM dbo.Users AS u
    WHERE u.Reputation = 0;
But two things happen:
my name is bogus
The plan is trivial, and it’s auto-parameterized.
The auto-parameterization means a plan is chosen where the literal value 0 is replaced with a parameter by SQL Server. This is normally “okay”, because it promotes plan reuse. However, in this case, the auto-parameterized plan has to be safe for any value we pass in. Sure, it was 0 this time, but next time it could be one within the range of valid reputations.
Since we don’t have an index on Reputation, we have to read the entire table. If we had an index on Reputation, it would still result in a lot of extra reads, but I’m using the clustered index here for ~dramatic effect~
Table 'Users'. Scan count 1, logical reads 44440
Of course, adding the 1 = (SELECT 1) thing to the end introduces full optimization, and prevents this.
The query plan without it is just a constant scan, and it does 0 reads.
Rounding Down
So there you have it. When you see me (or anyone else) use 1 = (SELECT 1), this is why. Sometimes when you write demos, a trivial plan or auto-parameterization can mess things up. The easiest way to get around it is to add that to the end of a query.
Thanks for reading!
Going Further
If this is the kind of SQL Server stuff you love learning about, you’ll love my training. Blog readers get 25% off the Everything Bundle — over 100 hours of performance tuning content. Need hands-on help? I offer consulting engagements from targeted investigations to ongoing retainers. Want a quick sanity check before committing to a full engagement? Schedule a call — no commitment required.
I always try to impart on people that SQL injection isn’t necessarily about vandalizing or trashing data in some way.
Often it’s about getting data. One great way to figure out how difficult it might be to get that data is to figure out who you’re logged in as.
There’s a somewhat easy way to figure out if you’re logged in as sa.
Wanna see it?
Still Ill
	SELECT SUSER_SID();
	SELECT CONVERT(INT, SUSER_SID());
	SELECT SUSER_NAME(1);

    DECLARE @Top INT = 1000 + (SELECT CONVERT(INT, SUSER_SID()));

	SELECT TOP (@Top)
    		u.Id, u.DisplayName, u.Reputation, u.CreationDate
    FROM dbo.Users AS u
    ORDER BY u.Reputation DESC;
    GO
It doesn’t even require dynamic SQL.
All you need is a user entry field to do something like pass in how many records you want returned.
The results of the first three selects looks like this:
Full Size
This is always the case for the sa login.
If your app is logged in using it, the results of the TOP will return 1001 rows rather than 1000 rows.
If it’s a different login, the number could end up being positive or negative, and so a little bit more difficult to work with.
But hey! Things.
Validation
Be mindful of those input fields.
Lots of times, I’ll see people have what should be integer fields accept string values so users can use shortcut codes.
For example, let’s say we wanted someone to be able to select all available rows without making them memorize the integer maximum.
We might use a text field so someone could say “all” instead of 2147483647.
If this is the kind of SQL Server stuff you love learning about, you’ll love my training. Blog readers get 25% off the Everything Bundle — over 100 hours of performance tuning content. Need hands-on help? I offer consulting engagements from targeted investigations to ongoing retainers. Want a quick sanity check before committing to a full engagement? Schedule a call — no commitment required.
Clustered columnstore indexes can be a great solution for data warehouse workloads, but there’s not a lot of advanced training or detailed documentation out there. It’s easy to feel all alone when you want a second opinion or run into a problem with query performance or data loading that you don’t know how to solve.
In this full day session, I’ll teach you the most important things I know about clustered columnstore indexes. Specifically, I’ll teach you how to make the right choices with your schema, data loads, query tuning, and columnstore maintenance. All of these lessons have been learned the hard way with 4 TB of production data on large, 96+ core servers. Material is applicable from SQL Server 2016 through 2019.
Here’s what I’ll be talking about:
– How columnstore compression works and tips for picking the right data types
– Loading columnstore data quickly, especially on large servers
– Improving query performance on columnstore tables
– Maintaining your columnstore tables
This is an advanced level session. To get the most out of the material, attendees should have some practical experience with columnstore and query tuning, and a solid understanding of internals such as wait stats analysis. You don’t need to bring a laptop to follow along.
Wanna save 25%? Use coupon code “actionjoe” at checkout — it’s good for the first 10 seats, so hurry up and get yours today.
Thanks for reading!
Going Further
If this is the kind of SQL Server stuff you love learning about, you’ll love my training. Blog readers get 25% off the Everything Bundle — over 100 hours of performance tuning content. Need hands-on help? I offer consulting engagements from targeted investigations to ongoing retainers. Want a quick sanity check before committing to a full engagement? Schedule a call — no commitment required.
In this video, I tested my SneakyTops demo in SQL Server 2019 Community Technology Preview 3.1 to see if it was still susceptible to the same issues as before. As you’ll see, I had a bit of an accident with a bottle of water during the recording, but that’s all part of the fun! The main focus was on parameter sniffing and how SQL Server’s optimizer handles top expressions with dynamic parameters. Even though I updated the parameter value to 1000 and tried recompiling the query, SQL Server still guessed 100 rows—just as it did in previous versions. This test didn’t reveal any improvements in SQL Server 2019 regarding this particular issue, which is a bit disappointing but not entirely surprising given the complexity of parameter sniffing scenarios.
Full Transcript
Yeah. So I finished recording the last video on SneakyTops. And what I realized is that I should test my SneakyTops demo in SQL Server 2019 to see if it was still susceptible to SneakyTops. So here we go. On SQL Server 2019, this is CTP 3.1. You can see down there in the corner, maybe, probably. I don’t know. If you stare hard enough, if you squint, I’ll zoom in, I guess. I suppose I’m a nice person. Oh, there we go. Wow. So that, I don’t know really how that worked out, but I’m never zooming again in this thing. So I don’t know what you saw on the screen. Could have been anything, but we’re gonna, we’re gonna leave that as is. You may have seen my Twitter mentions. You may have seen another SSMS window. I don’t care. Anyway. Point is here, I almost knocked over a bottle of water, that no matter what we do, so this expression up here, right, let’s say, right now it’s at 100, right? So if we run this query, this will run for, I don’t know, two and a half seconds. And we get back 100 rows. And if we look at what SQL Server guessed was going to come out of there, it is still 100. Okay, so we have 100 row guess. But if we update, that setting to be 1000, that setting to be 1000, and we run this again, SQL Server’s guess is going to remain at 100, right there. And even if we tag in recompile, and run this, well, SQL Server is still going to guess 100. So, this is not Freud’s fault. So what I wanted to test was the Freud inlining of functions, and see SQL Server would take this and say, hey, we can inline this function. Maybe we can guess at the outcome of it with a recompile hands or without or really just anything. Is there any change here? And there isn’t. So don’t look forward to SQL Server 2019 fixing that problem.
Again, this isn’t like the fault of Freud. This is kind of a weird thing to be doing anyway. And I didn’t, I don’t expect the optimizer to cover every single bizarre scenario that I might encounter. But I did want to, for the sake of completeness with my sneaky top, I did want to see if SQL Server 2019 helped. And it doesn’t look like the guess for a top with an expression is different here. So, and that’s fine. I again, I don’t expect that to, you know, get improved, or change even. I don’t see what the point is. Anyway, thanks for watching. I’m going to open my door and get some air conditioning now. Goodbye. Bye.
Video Summary
In this video, I tested my SneakyTops demo in SQL Server 2019 Community Technology Preview 3.1 to see if it was still susceptible to the same issues as before. As you’ll see, I had a bit of an accident with a bottle of water during the recording, but that’s all part of the fun! The main focus was on parameter sniffing and how SQL Server’s optimizer handles top expressions with dynamic parameters. Even though I updated the parameter value to 1000 and tried recompiling the query, SQL Server still guessed 100 rows—just as it did in previous versions. This test didn’t reveal any improvements in SQL Server 2019 regarding this particular issue, which is a bit disappointing but not entirely surprising given the complexity of parameter sniffing scenarios.
Full Transcript
Yeah. So I finished recording the last video on SneakyTops. And what I realized is that I should test my SneakyTops demo in SQL Server 2019 to see if it was still susceptible to SneakyTops. So here we go. On SQL Server 2019, this is CTP 3.1. You can see down there in the corner, maybe, probably. I don’t know. If you stare hard enough, if you squint, I’ll zoom in, I guess. I suppose I’m a nice person. Oh, there we go. Wow. So that, I don’t know really how that worked out, but I’m never zooming again in this thing. So I don’t know what you saw on the screen. Could have been anything, but we’re gonna, we’re gonna leave that as is. You may have seen my Twitter mentions. You may have seen another SSMS window. I don’t care. Anyway. Point is here, I almost knocked over a bottle of water, that no matter what we do, so this expression up here, right, let’s say, right now it’s at 100, right? So if we run this query, this will run for, I don’t know, two and a half seconds. And we get back 100 rows. And if we look at what SQL Server guessed was going to come out of there, it is still 100. Okay, so we have 100 row guess. But if we update, that setting to be 1000, that setting to be 1000, and we run this again, SQL Server’s guess is going to remain at 100, right there. And even if we tag in recompile, and run this, well, SQL Server is still going to guess 100. So, this is not Freud’s fault. So what I wanted to test was the Freud inlining of functions, and see SQL Server would take this and say, hey, we can inline this function. Maybe we can guess at the outcome of it with a recompile hands or without or really just anything. Is there any change here? And there isn’t. So don’t look forward to SQL Server 2019 fixing that problem.
Again, this isn’t like the fault of Freud. This is kind of a weird thing to be doing anyway. And I didn’t, I don’t expect the optimizer to cover every single bizarre scenario that I might encounter. But I did want to, for the sake of completeness with my sneaky top, I did want to see if SQL Server 2019 helped. And it doesn’t look like the guess for a top with an expression is different here. So, and that’s fine. I again, I don’t expect that to, you know, get improved, or change even. I don’t see what the point is. Anyway, thanks for watching. I’m going to open my door and get some air conditioning now. Goodbye. Bye.
Going Further
If this is the kind of SQL Server stuff you love learning about, you’ll love my training. Blog readers get 25% off the Everything Bundle — over 100 hours of performance tuning content. Need hands-on help? I offer consulting engagements from targeted investigations to ongoing retainers. Want a quick sanity check before committing to a full engagement? Schedule a call — no commitment required.
In this video, I delve into a clever but sneaky use of user functions within SQL queries that can lead to unexpected behavior and potential security issues. Specifically, I explore how a seemingly innocuous function call can disrupt query parallelism and how different workarounds like using variables or dynamic SQL might seem like solutions but come with their own set of challenges, such as plan caching and performance variability. I also touch on the security implications of these techniques, particularly when it comes to dynamically constructing queries based on user inputs, and offer some practical advice on mitigating risks while still achieving desired functionality.
Full Transcript
Hello, Erik Darling here with Erik Darling Data in the midst of a heat crisis. It’s terrible. I was recently advised that what I thought was fluid in my ears was actually just pressure escaping my sinuses via my most, apparently, the narrowest ear canals that have ever been designed by God or man and put inside someone’s head. So anyway, I wanted to talk about a very sneaky place that I saw a function today. And it was just so stupendously clever of a place to see a function end up. And it looked exactly, the query, I mean, didn’t look like this because it’s not Stack Overflow, but it looked close enough to this to, you know, to give you a good idea of what happened. Where there was a user function, which took a, I mean, it didn’t just take a, this thing, there was like a whole thing that like, you know, figured out what the user was and other stuff and whatever. This is just simpler for me to write. I’m not that smart. So anyway, what happens is if we run this and we just look at what happens when we run this function, we get back to number 100. So the purpose of this function inside this expression right here was to return whatever a particular user setting was for how many rows they wanted to get back at once. So you could run this query, and I bet you thought that would throw an error, but it doesn’t. We can run this query, and we can get back our 100 rows, and we have, you know, whatever, we have an execution plan. And when we dug a little bit deeper into what was going on, the function looked something a little bit like this, where you would go look at a table called user settings or something, and you would return some values and, you know, kind of like stuff that a regular function does. And there was a table that backed it up with a row in it that looked like that. Okay, pretty simple. Not bad.
So, but, you know, when we run it, you know, we go do this, and we run our query with our function in it. This, even though we’re only setting a value for the top expression up here, we still hit the same exact problem that functions cause just about anywhere else in the known SQL universe where they prevent our query from running in parallel. We cannot generate a valid parallel plan with that function even up in the top here. So, that’s kind of a downer, right? So, one way around that, potentially, is to set top equal to a variable, and when we do that, we will get back a slightly faster version of our query that went parallel, right? So, we see a parallel plan down here, and all the pain of, I mean, all the forced serialization associated with that scalar value function happen up here where we declare the variable, and not down here where we mess with anything.
So, that’s an okay solution, and I think I’ve blogged about this before. I might even have another video on it. I’m not sure at this point. I’ve written a lot and videoed a lot. I lose track, and my brain is full of mush and wet newspapers and hairballs, so, and apparently, a lot of pressure that just escapes and feels like there’s fluid in my head, so that’s nice, too. So, yeah, one way around it is to potentially, I mean, like, I messed that up. The problem, we just showed a potential workaround.
The problem with that workaround, there we go, is that no matter what number we declare up here, because this is a declared variable, it has the same-ish local variable effect with being in a top expression, is when you put it in, like, a where clause or something, where SQL Server just has a, like, a solid, a steady guess for what it’s going to use for a number, it doesn’t actually change that. So, we could put 10,000 up there. I’m going to free the proc cache, so we know that we’re not reusing that plan at all, right?
So, we can just be pretty sure that the plan that SQL Server is coming up with is a new one. I can’t use recompile here, and I’ll show you why in a second. So, if we free the proc cache, and I select 10,000 rows, and I look at how many SQL Server is estimating up here, it’ll be 100 rows right there. So, that’s not very good, and it doesn’t matter if I put in 1,000, 5,000, 50,000, if I go and run that and return some rows.
SQL Server’s guess is always going to be 100 right here. So, that’s not ideal, because if you are selecting way more than 100 rows in your top, SQL Server might choose different plans based on different row goals, right?
So, that’s not great. So, your options are, of course, a recompile hint. If we stick a recompile hint in there, then SQL Server will all of a sudden magically understand that we wanted 1,000 rows, and not just 100 rows. So, there’s that, which is okay.
But with anything, when I’m saying recompile, I’m not worried about burning down the house with CPU. I’m more worried about the forensic aspect of things. So, like, you know, you have this query in there with recompile, and it might be a very important query, and now all of a sudden you’ve got no history of it in your plan cache, right?
So, like, every time this runs, SQL Server’s going to not cache a plan, say, we don’t need to bother with this. And if we wanted to troubleshoot performance with this query, we wouldn’t have a really good way to do it, right? We would have, like, no history of this query at all in there. So, one thing, well, a couple things you can do that can help.
Well, one of them is dynamic SQL. And this is safer or more safe or even more safer or more safer or more safer. But this is ultimately sniffable.
When we use totally safe dynamic SQL, it gets treated like a stored procedure in that this variable gets sniffed, or this parameter gets sniffed because we’re passing it in as a parameter down here. So, if we put 100 in the first time and we use 1,000 the second time, SQL Server will reuse the plan for 100 unless something happened where it needed to come up with a new plan.
Anyway, this is less safe but also less sniffable. Cool. All right. So, you can use a variable like this. And you can use, like, rtrim or you can say convert top barcar whatever 11, 52, 78, 25 hike. Whatever you want to do in here to make this a concatenatable from an integer to a concatenatable string value in here.
And you can execute that. And this will have a lower chance of reusing a plan. I’m not going to say it’s 100% never going to reuse a plan, but it’s a lower chance. A lower chance.
But this kind of comes back to, well, not the same problem as recompile where you would have no plans in the cache, but sort of the opposite problem of recompile where you could, depending on how popular this query is, you could have a bunch of plans in the cache. You could have a whole mess of stuff that’s coming in with all these top however many row queries. And, you know, again, you know, whenever we talk about dynamic SQL like this, you know, everyone has to talk about SQL injection and, you know, the potential security risk and how that can be a pretty big downfall with this stuff.
And I agree it is. You know, I will say that, you know, the chance is, the chance of someone coming in and, like, you know, dropping tables or doing anything crazy is lessened a bit because this is an integer value up here. Right?
So, I mean, to my mind, it’s, like, hard to figure out a way to pass in something as an integer that would be validated here that could then be transformed down here in a way that would, you know, execute an extra command. Right?
Like, it’s hard for me to figure that out. I’m sure someone out there is smart enough to do it. It’s just not me. But one thing you can do, even with totally safe dynamic SQL, is something like this. Now, you can explore a little bit of user function stuff with these functions up here and these built-in functions. And, granted, you can restrict access to these via the appropriate permissions.
But that’s hard. And a lot of times, the app login needs elevated permissions to do weird stuff, create tables, create databases. Oftentimes, applications, like, at minimum, kind of want DB owner.
And so that makes it a little bit harder to, like, you know, revoke or deny sort of basic privileges. But one thing I want to point out here is that if I run these queries, right? So if I run select suzer sid, I get OXO1 back. And I can convert that to an integer, which is 1.
And then if I run suzer name with 1, I get back SA. So SA is always 1. SA always has this OXO1. And so what I can do that’s kind of sneaky, even with totally safe dynamic SQL, is say I want my top to be 1000 plus converting suzer sid to an int. And when I run this, instead of getting 1,000 rows back, I get back, oops, there we go, 1,001 rows, which isn’t, again, a performance issue, but it is one way that someone perhaps a bit on the clever side could mess up or could get some extra information without doing anything too crazy.
They could figure out which, well, I mean, at least which login was coming. I mean, if they were logged in as SA, if they get one back, if they get back a number higher than one, then, you know, they maybe do something else to figure that out.
Anyway, that’s with the safe version of dynamic SQL. Even with that, you can play some tricks. So it would be up to, like, you know, someone on the front end to validate, you know, that there’s nothing weird coming in for, like, wherever someone enters in 1,000. Like, use a drop-down menu with static numbers in it or validate your inputs.
Again, everyone should validate their inputs. Anyway, that’s all I wanted to talk about. We’re a little over 10 minutes, which is longer than I wanted, but I messed up a time or two. Sorry about that.
I blame it on the pressure leaking out of my skull. Anyway, thanks for watching, and I will see you in another video, perhaps. Goodbye. Goodbye.
Video Summary
In this video, I delve into a clever but sneaky use of user functions within SQL queries that can lead to unexpected behavior and potential security issues. Specifically, I explore how a seemingly innocuous function call can disrupt query parallelism and how different workarounds like using variables or dynamic SQL might seem like solutions but come with their own set of challenges, such as plan caching and performance variability. I also touch on the security implications of these techniques, particularly when it comes to dynamically constructing queries based on user inputs, and offer some practical advice on mitigating risks while still achieving desired functionality.
Full Transcript
Hello, Erik Darling here with Erik Darling Data in the midst of a heat crisis. It’s terrible. I was recently advised that what I thought was fluid in my ears was actually just pressure escaping my sinuses via my most, apparently, the narrowest ear canals that have ever been designed by God or man and put inside someone’s head. So anyway, I wanted to talk about a very sneaky place that I saw a function today. And it was just so stupendously clever of a place to see a function end up. And it looked exactly, the query, I mean, didn’t look like this because it’s not Stack Overflow, but it looked close enough to this to, you know, to give you a good idea of what happened. Where there was a user function, which took a, I mean, it didn’t just take a, this thing, there was like a whole thing that like, you know, figured out what the user was and other stuff and whatever. This is just simpler for me to write. I’m not that smart. So anyway, what happens is if we run this and we just look at what happens when we run this function, we get back to number 100. So the purpose of this function inside this expression right here was to return whatever a particular user setting was for how many rows they wanted to get back at once. So you could run this query, and I bet you thought that would throw an error, but it doesn’t. We can run this query, and we can get back our 100 rows, and we have, you know, whatever, we have an execution plan. And when we dug a little bit deeper into what was going on, the function looked something a little bit like this, where you would go look at a table called user settings or something, and you would return some values and, you know, kind of like stuff that a regular function does. And there was a table that backed it up with a row in it that looked like that. Okay, pretty simple. Not bad.
So, but, you know, when we run it, you know, we go do this, and we run our query with our function in it. This, even though we’re only setting a value for the top expression up here, we still hit the same exact problem that functions cause just about anywhere else in the known SQL universe where they prevent our query from running in parallel. We cannot generate a valid parallel plan with that function even up in the top here. So, that’s kind of a downer, right? So, one way around that, potentially, is to set top equal to a variable, and when we do that, we will get back a slightly faster version of our query that went parallel, right? So, we see a parallel plan down here, and all the pain of, I mean, all the forced serialization associated with that scalar value function happen up here where we declare the variable, and not down here where we mess with anything.
So, that’s an okay solution, and I think I’ve blogged about this before. I might even have another video on it. I’m not sure at this point. I’ve written a lot and videoed a lot. I lose track, and my brain is full of mush and wet newspapers and hairballs, so, and apparently, a lot of pressure that just escapes and feels like there’s fluid in my head, so that’s nice, too. So, yeah, one way around it is to potentially, I mean, like, I messed that up. The problem, we just showed a potential workaround.
The problem with that workaround, there we go, is that no matter what number we declare up here, because this is a declared variable, it has the same-ish local variable effect with being in a top expression, is when you put it in, like, a where clause or something, where SQL Server just has a, like, a solid, a steady guess for what it’s going to use for a number, it doesn’t actually change that. So, we could put 10,000 up there. I’m going to free the proc cache, so we know that we’re not reusing that plan at all, right?
So, we can just be pretty sure that the plan that SQL Server is coming up with is a new one. I can’t use recompile here, and I’ll show you why in a second. So, if we free the proc cache, and I select 10,000 rows, and I look at how many SQL Server is estimating up here, it’ll be 100 rows right there.
So, that’s not very good, and it doesn’t matter if I put in 1,000, 5,000, 50,000, if I go and run that and return some rows. SQL Server’s guess is always going to be 100 right here. So, that’s not ideal, because if you are selecting way more than 100 rows in your top, SQL Server might choose different plans based on different row goals, right?
So, that’s not great. So, your options are, of course, a recompile hint. If we stick a recompile hint in there, then SQL Server will all of a sudden magically understand that we wanted 1,000 rows, and not just 100 rows. So, there’s that, which is okay.
But with anything, when I’m saying recompile, I’m not worried about burning down the house with CPU. I’m more worried about the forensic aspect of things. So, like, you know, you have this query in there with recompile, and it might be a very important query, and now all of a sudden you’ve got no history of it in your plan cache, right?
So, like, every time this runs, SQL Server’s going to not cache a plan, say, we don’t need to bother with this. And if we wanted to troubleshoot performance with this query, we wouldn’t have a really good way to do it, right? We would have, like, no history of this query at all in there.
So, one thing, well, a couple things you can do that can help. Well, one of them is dynamic SQL. And this is safer or more safe or even more safer or more safer or more safer.
But this is ultimately sniffable. When we use totally safe dynamic SQL, it gets treated like a stored procedure in that this variable gets sniffed, or this parameter gets sniffed because we’re passing it in as a parameter down here.
So, if we put 100 in the first time and we use 1,000 the second time, SQL Server will reuse the plan for 100 unless something happened where it needed to come up with a new plan. Anyway, this is less safe but also less sniffable.
Cool. All right. So, you can use a variable like this. And you can use, like, rtrim or you can say convert top barcar whatever 11, 52, 78, 25 hike. Whatever you want to do in here to make this a concatenatable from an integer to a concatenatable string value in here.
And you can execute that. And this will have a lower chance of reusing a plan. I’m not going to say it’s 100% never going to reuse a plan, but it’s a lower chance.
A lower chance. But this kind of comes back to, well, not the same problem as recompile where you would have no plans in the cache, but sort of the opposite problem of recompile where you could, depending on how popular this query is, you could have a bunch of plans in the cache.
You could have a whole mess of stuff that’s coming in with all these top however many row queries. And, you know, again, you know, whenever we talk about dynamic SQL like this, you know, everyone has to talk about SQL injection and, you know, the potential security risk and how that can be a pretty big downfall with this stuff.
And I agree it is. You know, I will say that, you know, the chance is, the chance of someone coming in and, like, you know, dropping tables or doing anything crazy is lessened a bit because this is an integer value up here.
Right? So, I mean, to my mind, it’s, like, hard to figure out a way to pass in something as an integer that would be validated here that could then be transformed down here in a way that would, you know, execute an extra command.
Right? Like, it’s hard for me to figure that out. I’m sure someone out there is smart enough to do it.
It’s just not me. But one thing you can do, even with totally safe dynamic SQL, is something like this. Now, you can explore a little bit of user function stuff with these functions up here and these built-in functions.
And, granted, you can restrict access to these via the appropriate permissions. But that’s hard. And a lot of times, the app login needs elevated permissions to do weird stuff, create tables, create databases.
Oftentimes, applications, like, at minimum, kind of want DB owner. And so that makes it a little bit harder to, like, you know, revoke or deny sort of basic privileges. But one thing I want to point out here is that if I run these queries, right?
So if I run select suzer sid, I get OXO1 back. And I can convert that to an integer, which is 1. And then if I run suzer name with 1, I get back SA.
So SA is always 1. SA always has this OXO1. And so what I can do that’s kind of sneaky, even with totally safe dynamic SQL, is say I want my top to be 1000 plus converting suzer sid to an int.
And when I run this, instead of getting 1,000 rows back, I get back, oops, there we go, 1,001 rows, which isn’t, again, a performance issue, but it is one way that someone perhaps a bit on the clever side could mess up or could get some extra information without doing anything too crazy.
They could figure out which, well, I mean, at least which login was coming. I mean, if they were logged in as SA, if they get one back, if they get back a number higher than one, then, you know, they maybe do something else to figure that out.
Anyway, that’s with the safe version of dynamic SQL. Even with that, you can play some tricks. So it would be up to, like, you know, someone on the front end to validate, you know, that there’s nothing weird coming in for, like, wherever someone enters in 1,000.
Like, use a drop-down menu with static numbers in it or validate your inputs. Again, everyone should validate their inputs. Anyway, that’s all I wanted to talk about.
We’re a little over 10 minutes, which is longer than I wanted, but I messed up a time or two. Sorry about that. I blame it on the pressure leaking out of my skull. Anyway, thanks for watching, and I will see you in another video, perhaps.
Goodbye. Goodbye.
Going Further
If this is the kind of SQL Server stuff you love learning about, you’ll love my training. Blog readers get 25% off the Everything Bundle — over 100 hours of performance tuning content. Need hands-on help? I offer consulting engagements from targeted investigations to ongoing retainers. Want a quick sanity check before committing to a full engagement? Schedule a call — no commitment required.
Make sure you’re looking at the latest and greatest.
Cloudness
The Cloud is basically an AirBnB for your server. Again, that’s cool.
They’re still VMs.
But the point is: pay close attention to how cloud VMs are set up for SQL server.
They’re not doing any of the stuff I listed up there.
Sure, storage and networking still kinda sucks, even if you pay for the good stuff.
But no one puts out the nice linens for strangers.
The point here is that they want you to complain as little as possible for the price.
Part of that is not goofing up the obvious stuff.
Thanks for reading!
Going Further
If this is the kind of SQL Server stuff you love learning about, you’ll love my training. Blog readers get 25% off the Everything Bundle — over 100 hours of performance tuning content. Need hands-on help? I offer consulting engagements from targeted investigations to ongoing retainers. Want a quick sanity check before committing to a full engagement? Schedule a call — no commitment required.
After a while tuning a query, sometimes it’s fun to mess with the DOP it’s run at to see how things change.
I wouldn’t consider this a query tuning technique, more like a point of interest.
For a long time, when I’d look at a serial plan, and then a parallel plan for a query, the shape would be the same.
But that’s not always true.
DOP 1
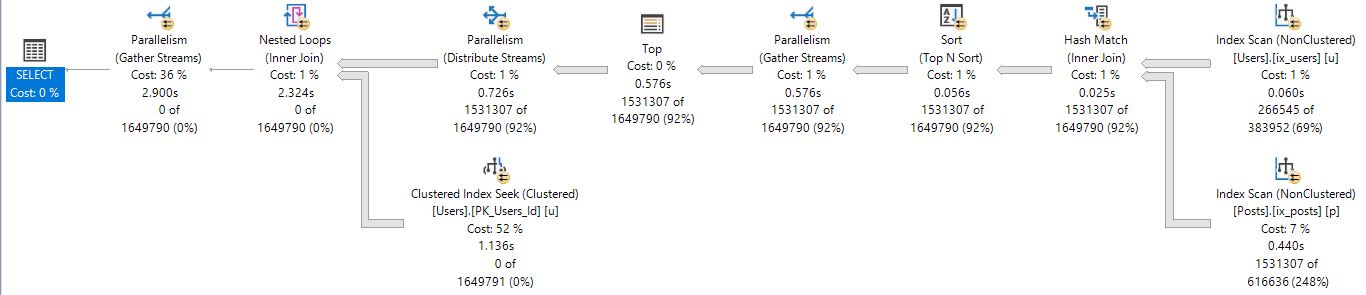
At DOP 1, the plan looks like this:
Mergey-Toppy
DOP 2
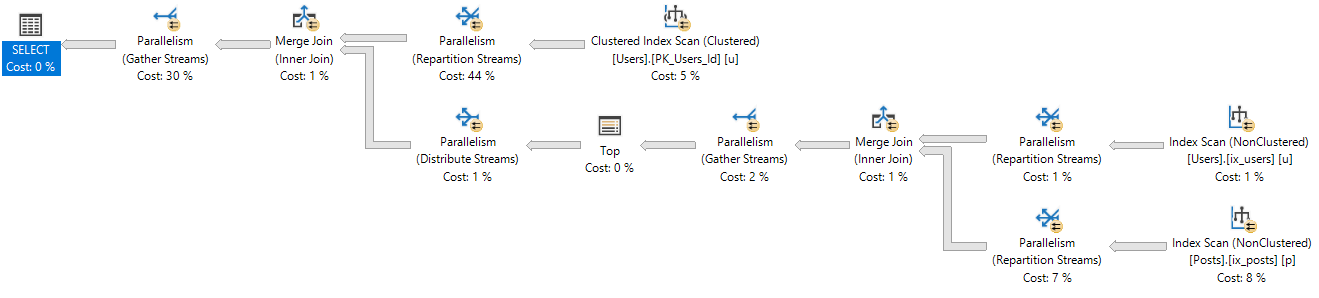
At DOP 2, the plan looks like this:
Tutu
Mo’ DOP
At DOP 3-8, the plan looks like this:
Shapewear
No DOP
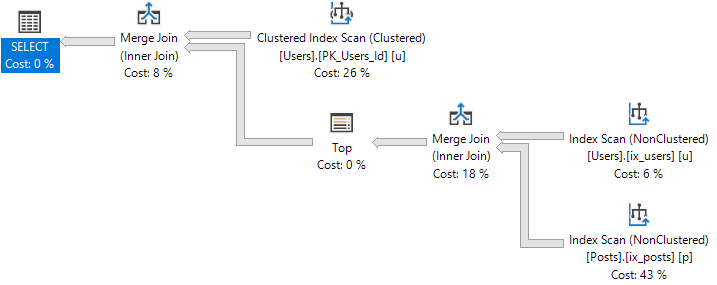
The DOP 2 plan has a significantly different shape than the serial, or more parallel plans.
It also chooses different types of joins.
Of course, we can use a merge join hint to have it pick the same plan as higher DOPs, but where’s the fun in that?
Anyway, the reason I found this interesting is because I always thought the general optimization process was:
Come up with a serial plan
If the plan cost is > CTFP, look at the parallel version of the serial plan
If the parallel version is cheaper, go with it
Though it appears like there’s an extra step where the optimizer considers multiple parallel alternatives to the serial plan, and not just the parallel version of the serial plan.
The process is closer to:
Come up with a serial plan
If the plan cost is > CTFP, create a *NEW* plan using parallelism
If the parallel version is cheaper, go with it
In many cases, the *NEW* plan will be the “same” as the serial plan, just using parallelism. The optimizer is a creature of habit, and applies the same rules and transformations.
Thanks for reading!
Going Further
If this is the kind of SQL Server stuff you love learning about, you’ll love my training. Blog readers get 25% off the Everything Bundle — over 100 hours of performance tuning content. Need hands-on help? I offer consulting engagements from targeted investigations to ongoing retainers. Want a quick sanity check before committing to a full engagement? Schedule a call — no commitment required.
Parameter sniffing gets blamed for a lot of things, and, well, sometimes it is parameter sniffing.
It’s probably not parameter sniffing if:
You use local variables
You use optimize for unknown
You’re recompiling anyway
ButWhatAbout
While working with a client recently, they were absolutely sure they had a parameter sniffing issue.
The general proof given was that as the day went on, queries got slower and slower.
The next day, they’d magically be fast again, and then the same slowdown would happen.
When we looked at the stored procedures in question, it looked like they might be right.
So I set up a test.
Pile and Recompile
We stuck a recompile hint on a stored procedure that people are always complaining about, and watched the runtime throughout the day.
Sure enough, it got slower and slower, but not because it got a bad plan. The server just got busier and busier.
6am: 2 seconds
7am: 6 seconds
8am: 15 seconds
9am: 20 seconds
10am: 30 seconds
I left out some details, and I’m sorry about that. You probably want the last 2 minutes of your life back.
Get in line.
Missing Persons
This poor server had hundreds of database totaling almost 4TB.
With 96 GB of RAM, and 4 cores, there was no good way for it to support many user requests.
When things got slow, two wait stats would tick up: PAGEIOLATCH_SH, and SOS_SCHEDULER_YIELD.
SQL Server had a hard time keeping the data people needed in memory, and it got really busy trying to make sure every query got a fair amount of CPU time.
In this case, it wasn’t parameter sniffing, it was server exhaustion.
Last Farewell
Wait stats aren’t always helpful, but they can help you with investigations.
This kind of resource contention won’t always be the issue, of course.
But when you’re investigating performance issues, it’s important to know what things look like when the server is running well, and what things look like when the’re not.
That includes
Wait stats
Query plans
Overall workload
Blocking
Thanks for reading!
Going Further
If this is the kind of SQL Server stuff you love learning about, you’ll love my training. Blog readers get 25% off the Everything Bundle — over 100 hours of performance tuning content. Need hands-on help? I offer consulting engagements from targeted investigations to ongoing retainers. Want a quick sanity check before committing to a full engagement? Schedule a call — no commitment required.
Back when I first wrote sp_BlitzQueryStore, I was totally enamored with Query Store.
Like the plan cache, but better. History. Different plans for the same query. Not disturbed by memory pressure or restarts.
Then I waited patiently to find a client on 2016 using it.
And waited, and waited, and waited.
And finally, some came along.
Slow Pokes And No Pokes
When I ran it, it took forever. Not even the XML part. The XML part was fast.
Gathering the initial set of data was slow.
With some time to experiment and dig in, I found that the IN_MEM tables cause significant performance issues when:
Query Store is actively logging data
Query Store is > 25 MB or so
Yes, children, in memory tables can be slow, too.
The Problem
Let’s take a couple simple queries against Query Store tables:
SELECT TOP 10 *
FROM sys.query_store_runtime_stats AS qsrs
WHERE qsrs.avg_cpu_time >= 500000
AND   qsrs.last_execution_time >= DATEADD(DAY, -1, GETDATE())
ORDER BY qsrs.avg_cpu_time DESC;

SELECT TOP 10 *
FROM sys.query_store_plan AS qsp
WHERE qsp.query_plan IS NOT NULL
AND   qsp.last_execution_time >= DATEADD(DAY, -1, GETDATE())
ORDER BY qsp.last_execution_time DESC;
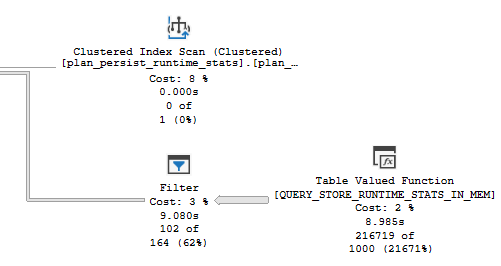
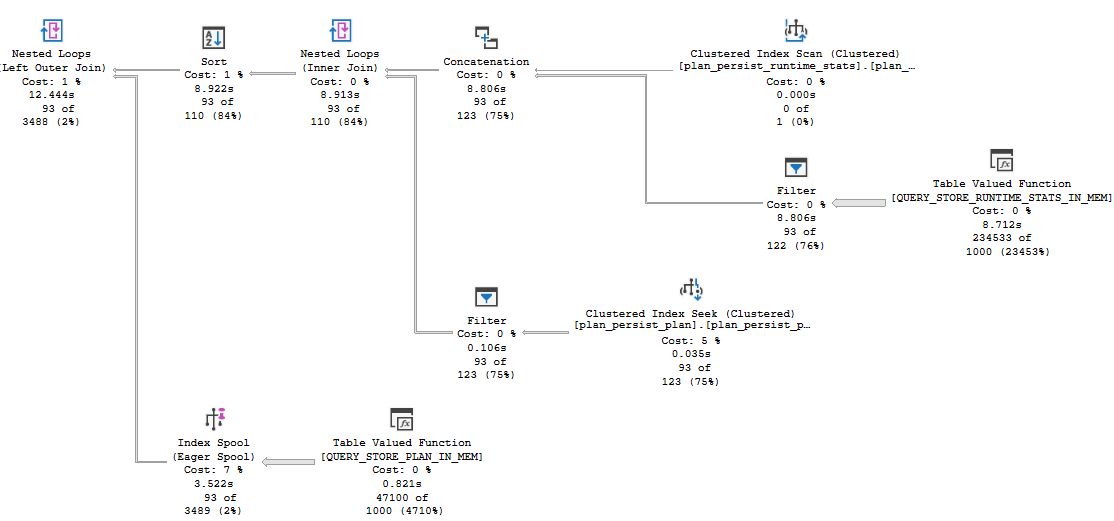
The first query runs for 10 seconds, with the entirety of the time spent filtering data out of the IN_MEM table:
Ho hum.
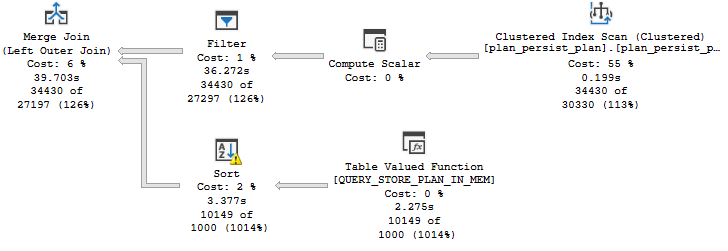
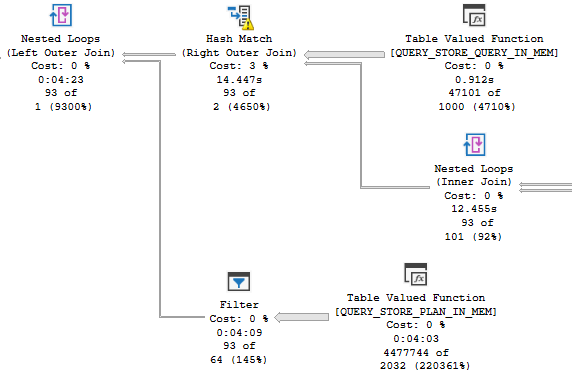
The second query is even worse, at nearly 2 minutes:
Filtering on the 1Fingerling on the floor
“Unrealistic”
I know, this configuration is probably unsupported because I used SELECT * or something.
I wrote this query hoping to quickly get the worst plans by a specific metric.
WITH the_pits
    AS
     (
         SELECT   TOP ( 101 )
                  qsrs.plan_id,
                  qsp.query_id,
                  qsrs.avg_duration / 100000. AS avg_duration_s,
                  qsrs.avg_cpu_time / 100000. AS avg_cpu_time_s,
                  qsrs.avg_query_max_used_memory,
                  qsrs.avg_logical_io_reads,
                  qsrs.avg_logical_io_writes,
                  qsrs.avg_tempdb_space_used,
                  qsrs.last_execution_time,
                  /*
                  You can stick any of the above metrics in here to
                  find offenders by different resource abuse
                  */
                  MAX(qsrs.avg_cpu_time) OVER
                  (
                      PARTITION BY
                          qsp.query_id
                      ORDER BY
                          qsp.query_id
                      ROWS UNBOUNDED PRECEDING
                  ) AS n
         FROM     sys.query_store_runtime_stats AS qsrs
         JOIN     sys.query_store_plan AS qsp
             ON qsp.plan_id = qsrs.plan_id
         WHERE    qsrs.avg_duration >= ( 5000. * 1000. )
         AND      qsrs.avg_cpu_time >= ( 1000. * 1000. )
         AND      qsrs.last_execution_time >= DATEADD(DAY, -7, GETDATE())
         AND      qsp.query_plan IS NOT NULL
         /*
         Don't forget to change this to same thing!
         */
         ORDER BY qsrs.avg_cpu_time DESC
     )
SELECT   p.plan_id,
         p.query_id,
         p.avg_duration_s,
         p.avg_cpu_time_s,
         p.avg_query_max_used_memory,
         p.avg_logical_io_reads,
         p.avg_logical_io_writes,
         p.avg_tempdb_space_used,
         p.last_execution_time,
         qsqt.query_sql_text,
         TRY_CONVERT(XML, qsp.query_plan) AS query_plan
FROM     sys.query_store_plan AS qsp
JOIN     the_pits AS p
    ON p.plan_id = qsp.plan_id
JOIN     sys.query_store_query AS qsq
    ON qsq.query_id = qsp.query_id
JOIN     sys.query_store_query_text AS qsqt
    ON qsq.query_text_id = qsqt.query_text_id
ORDER BY p.n DESC;
It works pretty well. Sometimes.
Other times, it runs for 4.5 minutes.
I know what you’re thinking: “Erik, you’re doing all sorts of crazy stuff in there. You’re making it slow.”
But none of the crazy stuff I’m doing is where the slowdown is.
It’s all in the same stuff I pointed out in the simpler queries.
12.5 seconds…FOUR MINUTES
Testing, testing
I can’t stress how much I want Query Store to be successful. I absolutely love the idea.
But it just wasn’t implemented very well. Simple filtering against the data takes forever.
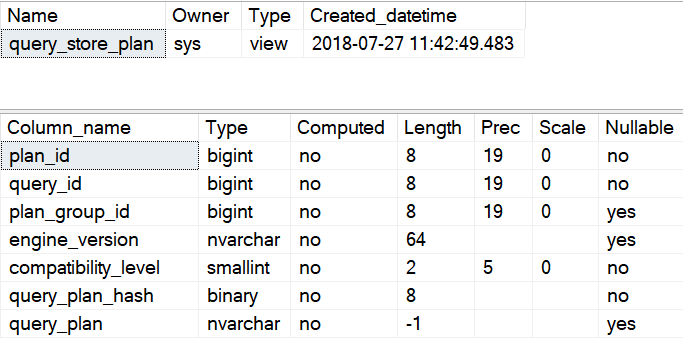
And yes, you can have NULL query plans for some reason. That’s rich.
The irony of needing to tune queries so you can find queries to tune is ironic.
I’m nearly sure of it.
Thanks for reading!
Going Further
If this is the kind of SQL Server stuff you love learning about, you’ll love my training. Blog readers get 25% off the Everything Bundle — over 100 hours of performance tuning content. Need hands-on help? I offer consulting engagements from targeted investigations to ongoing retainers. Want a quick sanity check before committing to a full engagement? Schedule a call — no commitment required.
I mean ever really wondered just how long a query of yours waited on stats to automatically update before running?
Have you ever been absolutely, positively sure that those gosh dang darn stats updates were putting your query on the trolley to Slowsville?
Your wishes will be 100% granted in SQL Server 2019.
Now, this wait doesn’t show up when stats are created the first time.
So if you run a query with a where clause on a column that doesn’t already have stats, the initial gather won’t show.
This is only for updates. Not creates.
Got it?
In Action
The following script will take the Votes table, and make a copy of it called Vetos.
Then it’ll create a PK/CX (for some reason?), and run a query against a couple columns that are mostly NULL.
Voting data gets cleaned out of the SO data dump.
SELECT ISNULL(Id, 0) AS Id,
       PostId,
       UserId,
       BountyAmount,
       VoteTypeId,
       CreationDate
INTO dbo.Vetos
FROM dbo.Votes;

ALTER TABLE dbo.Vetos
 ADD CONSTRAINT PK_Vetos_Id
    PRIMARY KEY CLUSTERED(Id);

SELECT TOP 10 *
FROM dbo.Vetos
WHERE UserId > 0
AND BountyAmount > 0;
The last query is important because it generates the initial stats on both of those columns.
Now let’s put some work into it!
UPDATE v
SET v.BountyAmount = 50000
FROM dbo.Vetos AS v
WHERE v.BountyAmount IS NULL;

UPDATE v
SET v.UserId = v.VoteTypeId
FROM dbo.Vetos AS v
WHERE v.UserId IS NULL;
This table has 52,928,720 rows in it. Not the biggest, but a decent size to maybe have to wait on stats to update.
Ready Steady
In separate windows, I’ll run these:
SELECT COUNT(*) AS records
FROM dbo.Vetos AS v
WHERE v.BountyAmount > 500;

SELECT COUNT(*) AS records
FROM dbo.Vetos AS v
WHERE v.UserId < 16;
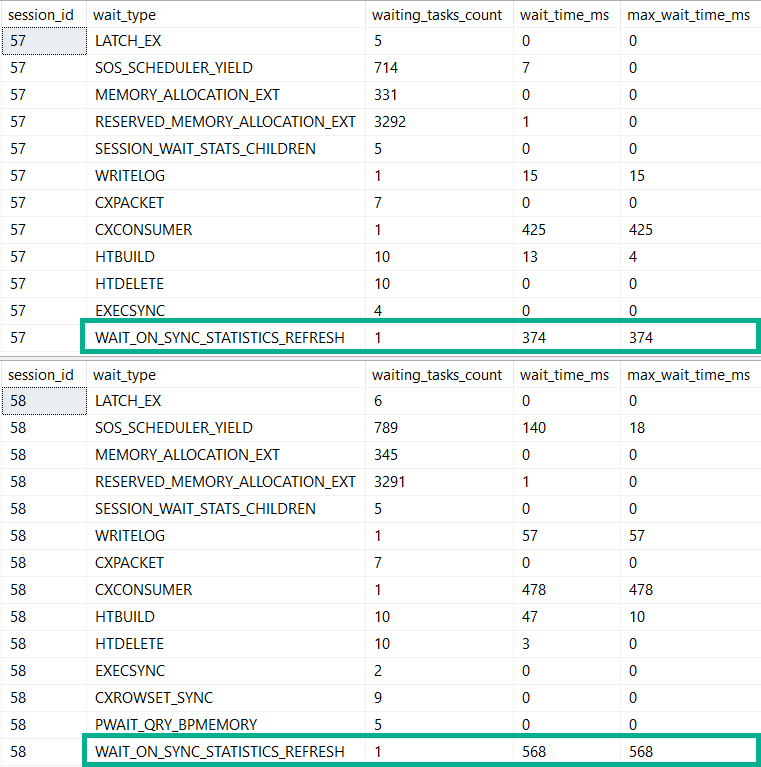
So there you have it. 52 million row stats refreshes take about half a second.
That wasn’t very exciting. Let’s try something else.
Tricks, Kids
If we start from scratch, but instead of letting SQL Server create stats automatically by running a query, let’s create statistics with some funny options, and then update the columns.
CREATE STATISTICS s_b ON dbo.Vetos(BountyAmount)
WITH FULLSCAN, PERSIST_SAMPLE_PERCENT = ON;

CREATE STATISTICS s_u ON dbo.Vetos(UserId)
WITH FULLSCAN, PERSIST_SAMPLE_PERCENT = ON;
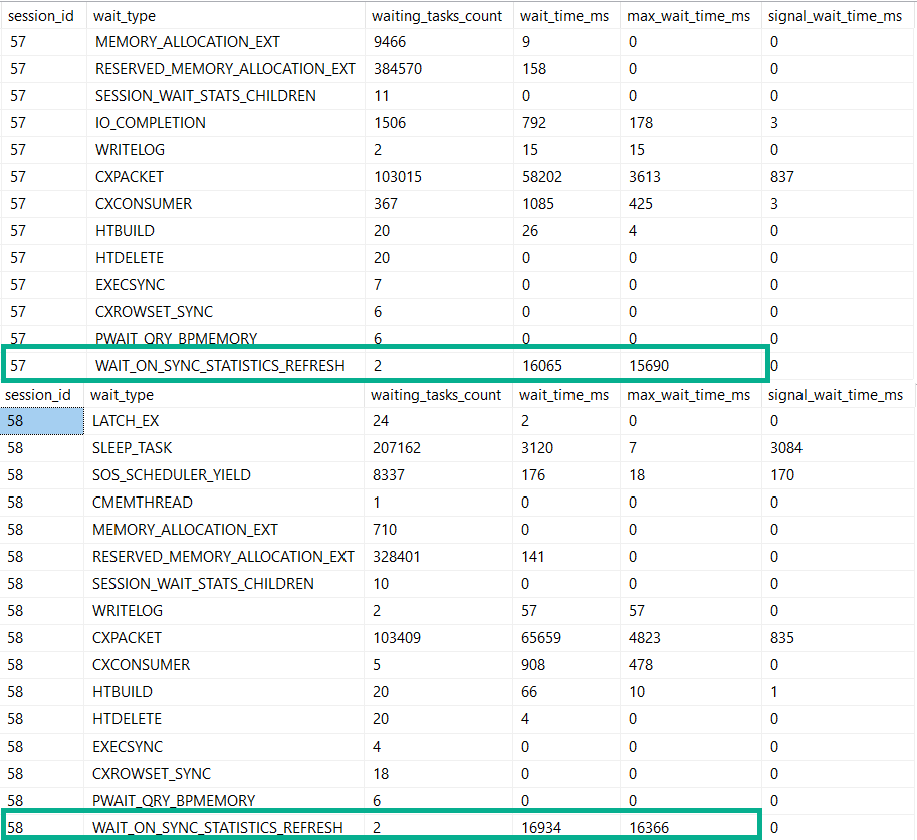
Now, when we run our select queries, things really slow down.
Sunny
Quite a bit longer on those.
Actionable?
What would one do if they encountered 15-16 waits on this in real life?
Well, you have some options.
Update stats asynchronously
Create stats with no recompute and handle stats updates yourself
Update statistics more often than you currently do, trying to stay ahead of automatic updates
It’s hard to see this being a really big issue outside of very large tables, and perhaps only on under-powered servers.
Or if someone created statistics with some rather impolite settings.
Thanks for reading!
Going Further
If this is the kind of SQL Server stuff you love learning about, you’ll love my training. Blog readers get 25% off the Everything Bundle — over 100 hours of performance tuning content. Need hands-on help? I offer consulting engagements from targeted investigations to ongoing retainers. Want a quick sanity check before committing to a full engagement? Schedule a call — no commitment required.