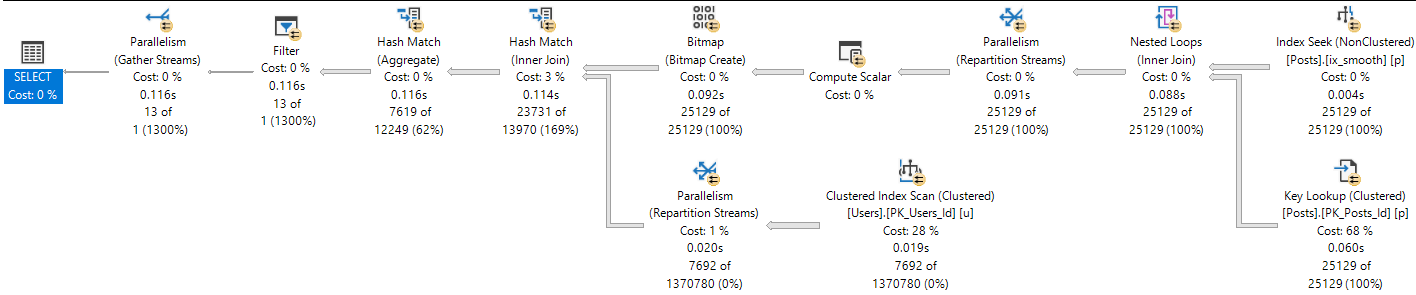
After a while tuning a query, sometimes it’s fun to mess with the DOP it’s run at to see how things change.
I wouldn’t consider this a query tuning technique, more like a point of interest.
For a long time, when I’d look at a serial plan, and then a parallel plan for a query, the shape would be the same.
But that’s not always true.
DOP 1
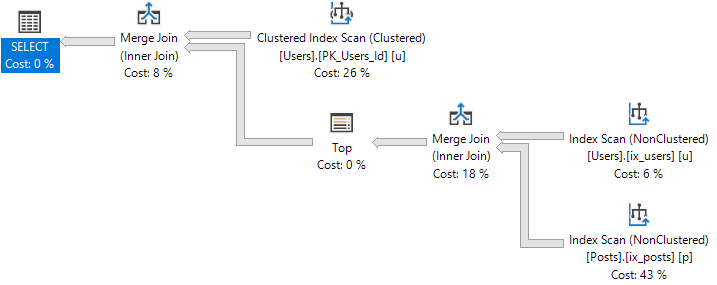
At DOP 1, the plan looks like this:
Mergey-Toppy
DOP 2
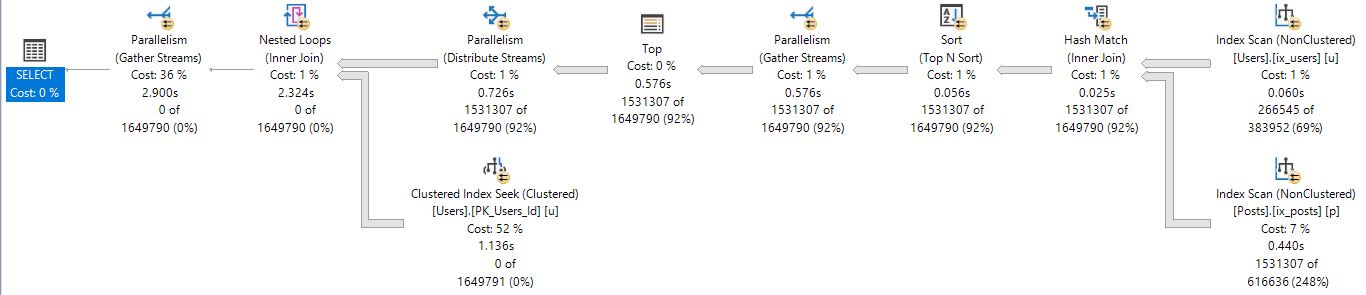
At DOP 2, the plan looks like this:
Tutu
Mo’ DOP
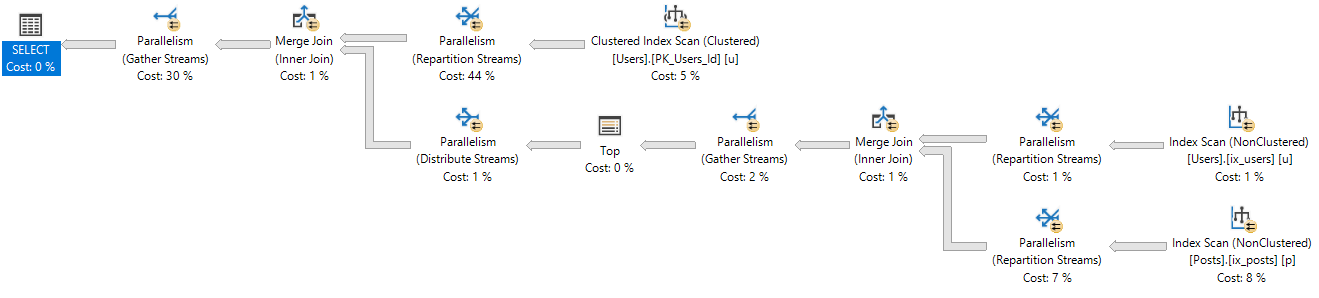
At DOP 3-8, the plan looks like this:
Shapewear
No DOP
The DOP 2 plan has a significantly different shape than the serial, or more parallel plans.
It also chooses different types of joins.
Of course, we can use a merge join hint to have it pick the same plan as higher DOPs, but where’s the fun in that?
Anyway, the reason I found this interesting is because I always thought the general optimization process was:
Come up with a serial plan
If the plan cost is > CTFP, look at the parallel version of the serial plan
If the parallel version is cheaper, go with it
Though it appears like there’s an extra step where the optimizer considers multiple parallel alternatives to the serial plan, and not just the parallel version of the serial plan.
The process is closer to:
Come up with a serial plan
If the plan cost is > CTFP, create a *NEW* plan using parallelism
If the parallel version is cheaper, go with it
In many cases, the *NEW* plan will be the “same” as the serial plan, just using parallelism. The optimizer is a creature of habit, and applies the same rules and transformations.
Thanks for reading!
Going Further
If this is the kind of SQL Server stuff you love learning about, you’ll love my training. Blog readers get 25% off the Everything Bundle — over 100 hours of performance tuning content. Need hands-on help? I offer consulting engagements from targeted investigations to ongoing retainers. Want a quick sanity check before committing to a full engagement? Schedule a call — no commitment required.
Back when I first wrote sp_BlitzQueryStore, I was totally enamored with Query Store.
Like the plan cache, but better. History. Different plans for the same query. Not disturbed by memory pressure or restarts.
Then I waited patiently to find a client on 2016 using it.
And waited, and waited, and waited.
And finally, some came along.
Slow Pokes And No Pokes
When I ran it, it took forever. Not even the XML part. The XML part was fast.
Gathering the initial set of data was slow.
With some time to experiment and dig in, I found that the IN_MEM tables cause significant performance issues when:
Query Store is actively logging data
Query Store is > 25 MB or so
Yes, children, in memory tables can be slow, too.
The Problem
Let’s take a couple simple queries against Query Store tables:
SELECT TOP 10 *
FROM sys.query_store_runtime_stats AS qsrs
WHERE qsrs.avg_cpu_time >= 500000
AND   qsrs.last_execution_time >= DATEADD(DAY, -1, GETDATE())
ORDER BY qsrs.avg_cpu_time DESC;

SELECT TOP 10 *
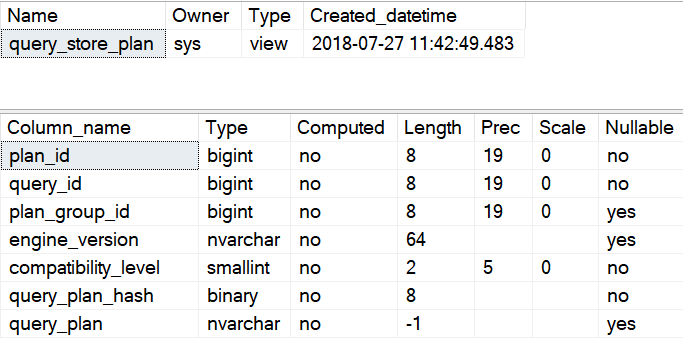
FROM sys.query_store_plan AS qsp
WHERE qsp.query_plan IS NOT NULL
AND   qsp.last_execution_time >= DATEADD(DAY, -1, GETDATE())
ORDER BY qsp.last_execution_time DESC;
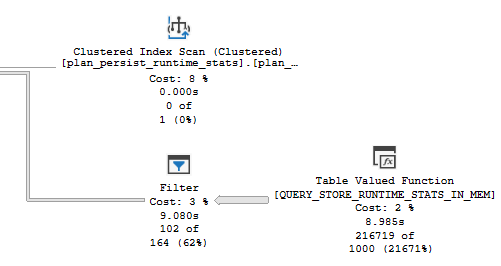
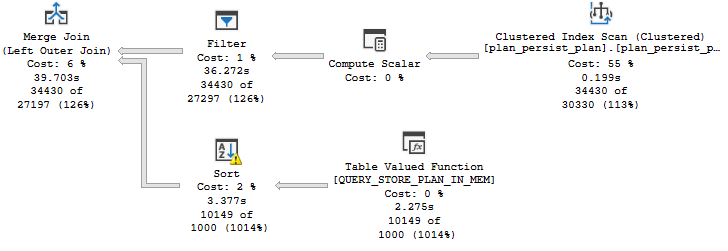
The first query runs for 10 seconds, with the entirety of the time spent filtering data out of the IN_MEM table:
Ho hum.
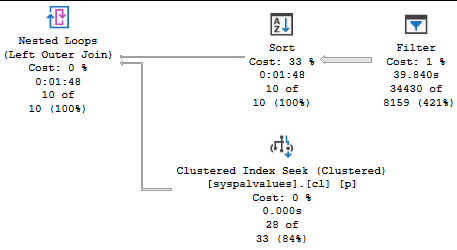
The second query is even worse, at nearly 2 minutes:
Filtering on the 1Fingerling on the floor
“Unrealistic”
I know, this configuration is probably unsupported because I used SELECT * or something.
I wrote this query hoping to quickly get the worst plans by a specific metric.
WITH the_pits
    AS
     (
         SELECT   TOP ( 101 )
                  qsrs.plan_id,
                  qsp.query_id,
                  qsrs.avg_duration / 100000. AS avg_duration_s,
                  qsrs.avg_cpu_time / 100000. AS avg_cpu_time_s,
                  qsrs.avg_query_max_used_memory,
                  qsrs.avg_logical_io_reads,
                  qsrs.avg_logical_io_writes,
                  qsrs.avg_tempdb_space_used,
                  qsrs.last_execution_time,
                  /*
                  You can stick any of the above metrics in here to
                  find offenders by different resource abuse
                  */
                  MAX(qsrs.avg_cpu_time) OVER
                  (
                      PARTITION BY
                          qsp.query_id
                      ORDER BY
                          qsp.query_id
                      ROWS UNBOUNDED PRECEDING
                  ) AS n
         FROM     sys.query_store_runtime_stats AS qsrs
         JOIN     sys.query_store_plan AS qsp
             ON qsp.plan_id = qsrs.plan_id
         WHERE    qsrs.avg_duration >= ( 5000. * 1000. )
         AND      qsrs.avg_cpu_time >= ( 1000. * 1000. )
         AND      qsrs.last_execution_time >= DATEADD(DAY, -7, GETDATE())
         AND      qsp.query_plan IS NOT NULL
         /*
         Don't forget to change this to same thing!
         */
         ORDER BY qsrs.avg_cpu_time DESC
     )
SELECT   p.plan_id,
         p.query_id,
         p.avg_duration_s,
         p.avg_cpu_time_s,
         p.avg_query_max_used_memory,
         p.avg_logical_io_reads,
         p.avg_logical_io_writes,
         p.avg_tempdb_space_used,
         p.last_execution_time,
         qsqt.query_sql_text,
         TRY_CONVERT(XML, qsp.query_plan) AS query_plan
FROM     sys.query_store_plan AS qsp
JOIN     the_pits AS p
    ON p.plan_id = qsp.plan_id
JOIN     sys.query_store_query AS qsq
    ON qsq.query_id = qsp.query_id
JOIN     sys.query_store_query_text AS qsqt
    ON qsq.query_text_id = qsqt.query_text_id
ORDER BY p.n DESC;
It works pretty well. Sometimes.
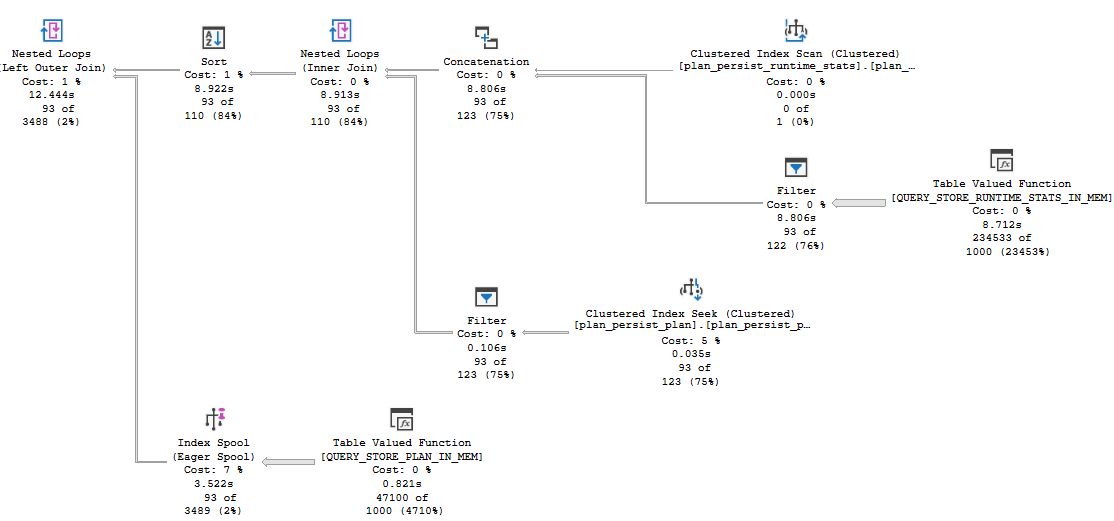
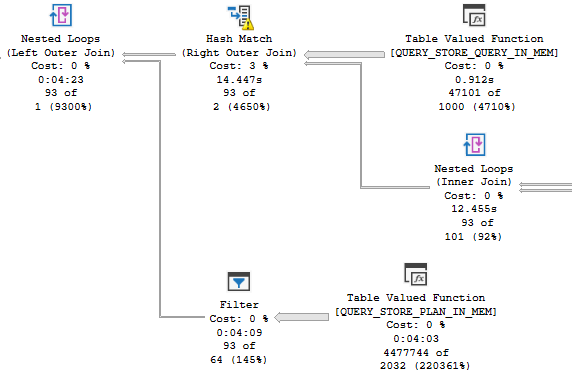
Other times, it runs for 4.5 minutes.
I know what you’re thinking: “Erik, you’re doing all sorts of crazy stuff in there. You’re making it slow.”
But none of the crazy stuff I’m doing is where the slowdown is.
It’s all in the same stuff I pointed out in the simpler queries.
12.5 seconds…FOUR MINUTES
Testing, testing
I can’t stress how much I want Query Store to be successful. I absolutely love the idea.
But it just wasn’t implemented very well. Simple filtering against the data takes forever.
And yes, you can have NULL query plans for some reason. That’s rich.
The irony of needing to tune queries so you can find queries to tune is ironic.
I’m nearly sure of it.
Thanks for reading!
Going Further
If this is the kind of SQL Server stuff you love learning about, you’ll love my training. Blog readers get 25% off the Everything Bundle — over 100 hours of performance tuning content. Need hands-on help? I offer consulting engagements from targeted investigations to ongoing retainers. Want a quick sanity check before committing to a full engagement? Schedule a call — no commitment required.
Often when query tuning, I’ll try a change that I think makes sense, only to have it backfire.
It’s not that the query got slower, it’s that the results that came back were wrong different.
Now, this can totally happen because of a bug in previously used logic, but that’s somewhat rare.
And wrong different results make testers nervous. Especially in production.
Here’s a Very Cheeky™ example.
Spread’em
This is my starting query. If I run it enough times, I’ll get a billion missing index requests.
WITH topusers AS
(
    SELECT   TOP (1)
             u.Id, u.DisplayName
    FROM     dbo.Users AS u
    ORDER BY u.Reputation DESC
)
SELECT   u.Id,
         u.DisplayName,
         SUM(p.Score * 1.0) AS PostScore,
         SUM(c.Score * 1.0) AS CommentScore,
         COUNT_BIG(*) AS CountForSomeReason
FROM     topusers AS u
JOIN     dbo.Posts AS p
    ON p.OwnerUserId = u.Id
JOIN     dbo.Comments AS c
    ON c.UserId = u.Id
WHERE    p.Score >= 5
AND      c.Score >= 1
GROUP BY u.Id, u.DisplayName;
For the sake of argument, I’ll add them all. Here they are:
CREATE INDEX ix_tabs
    ON dbo.Users ( Reputation DESC, Id )
    INCLUDE ( DisplayName );

CREATE INDEX ix_spaces
    ON dbo.Users ( Id, Reputation DESC )
    INCLUDE ( DisplayName );

CREATE INDEX ix_coke
    ON dbo.Comments ( Score) INCLUDE( UserId );

CREATE INDEX ix_pepsi
    ON dbo.Posts ( Score ) INCLUDE( OwnerUserId );

CREATE NONCLUSTERED INDEX ix_tastes_great
    ON dbo.Posts ( OwnerUserId, Score );

CREATE NONCLUSTERED INDEX ix_less_filling
    ON dbo.Comments ( UserId, Score );
With all those indexes, the query is still dog slow.
Maybe It’s Me
I’ll take my own advice. Let’s break the query up a little bit.
DROP TABLE IF EXISTS #topusers;

WITH topusers AS
(
    SELECT   TOP (1)
             u.Id, u.DisplayName
    FROM     dbo.Users AS u
    ORDER BY u.Reputation DESC
)
SELECT *
INTO #topusers
FROM topusers;

CREATE UNIQUE CLUSTERED INDEX ix_whatever
    ON #topusers(Id);

SELECT   u.Id,
         u.DisplayName,
         SUM(p.Score * 1.0) AS PostScore,
         SUM(c.Score * 1.0) AS CommentScore,
         COUNT_BIG(*) AS CountForSomeReason
FROM     #topusers AS u
JOIN     dbo.Posts AS p
    ON p.OwnerUserId = u.Id
JOIN     dbo.Comments AS c
    ON c.UserId = u.Id
WHERE    p.Score >= 5
AND      c.Score >= 1
GROUP BY u.Id, u.DisplayName;
Still dog slow.
Variability
Alright, I’m desperate now. Let’s try this.
DECLARE @Id INT,
        @DisplayName NVARCHAR(40);

SELECT   TOP (1)
            @Id = u.Id,
		    @DisplayName = u.DisplayName
FROM     dbo.Users AS u
ORDER BY u.Reputation DESC;


SELECT   @Id AS Id,
         @DisplayName AS DisplayName,
         SUM(p.Score * 1.0) AS PostScore,
         SUM(c.Score * 1.0) AS CommentScore,
         COUNT_BIG(*) AS CountForSomeReason
FROM dbo.Posts AS p
JOIN  dbo.Comments AS c
    ON c.UserId = p.OwnerUserId
WHERE    p.Score >= 5
AND      c.Score >= 1
AND      (c.UserId = @Id OR @Id IS NULL)
AND      (p.OwnerUserId = @Id OR @Id IS NULL);
Let’s get some worst practices involved. That always goes well.
Except here.
Getting the right results seemed like it was destined to be slow.
Differently Resulted
At this point, I tried several rewrites that were fast, but wrong.
What I had missed, and what Joe Obbish pointed out to me, is that I needed a cross join and some math to make it all work out.
WITH topusers AS
(
    SELECT   TOP (1)
             u.Id, u.DisplayName
    FROM     dbo.Users AS u
    ORDER BY u.Reputation DESC
)
SELECT     t.Id AS Id,
           t.DisplayName AS DisplayName,
           p_u.PostScoreSub * c_u.CountCSub AS PostScore,
           c_u.CommentScoreSub * p_u.CountPSub AS CommentScore,
           c_u.CountCSub * p_u.CountPSub AS CountForSomeReason
FROM       topusers AS t
JOIN       (   SELECT   p.OwnerUserId,
                        SUM(p.Score * 1.0) AS PostScoreSub,
						COUNT_BIG(*) AS CountPSub
               FROM     dbo.Posts AS p
               WHERE    p.Score >= 5
               GROUP BY p.OwnerUserId ) AS p_u
			   ON p_u.OwnerUserId = t.Id
CROSS JOIN (   SELECT   c.UserId, SUM(c.Score * 1.0) AS CommentScoreSub, COUNT_BIG(*) AS CountCSub
               FROM     dbo.Comments AS c
               WHERE    c.Score >= 1
               GROUP BY c.UserId ) AS c_u
               WHERE c_u.UserId = t.Id;
This finishes instantly, with the correct results.
The value of a college education!
Realizations and Slowness
After thinking about Joe’s rewrite, I had a terrible thought.
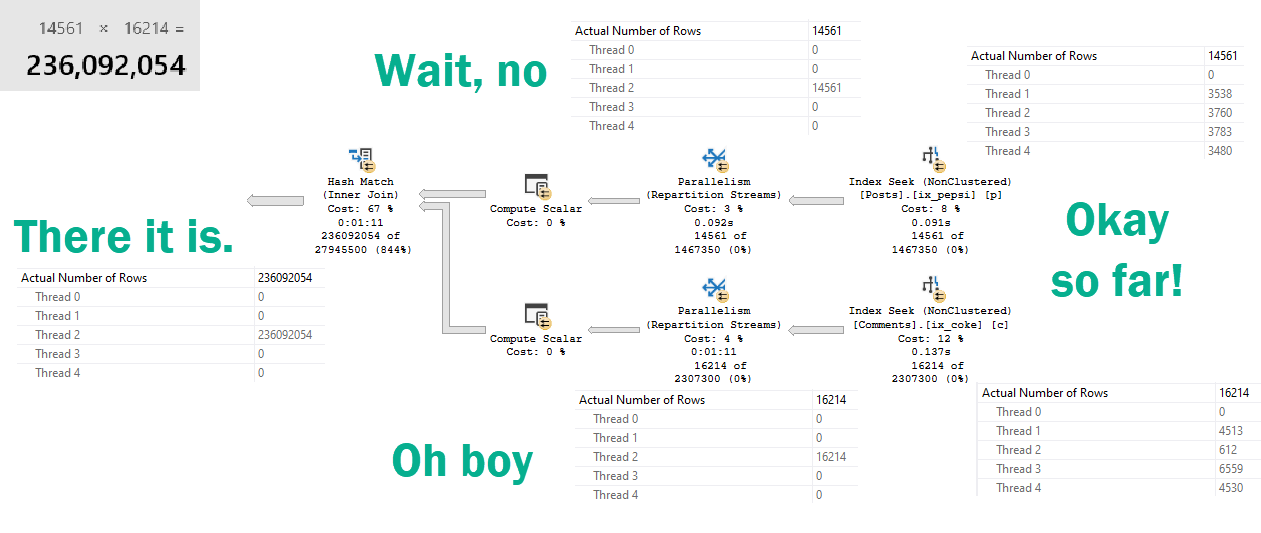
All the rewrites that were correct but slow had gone parallel.
“Parallel”
Allow me to illustrate.
In a row?
Repartition Streams usually does the opposite.
But here, it puts all the rows on a single thread.
“For correctness”
Which ends up in a 236 million row parallel-but-single-threaded-cross-hash-join.
SQL Server uses the correct join (inner or outer) and adds projections where necessary to honour all the semantics of the original query when performing internal translations between apply and join.
The differences in the plans can all be explained by the different semantics of aggregates with and without a group by clause in SQL Server.
What’s amazing and frustrating about the optimizer is that it considers all sorts of different ways to rewrite your query.
In milliseconds.
It may have even thought about a plan that would have been very fast.
But we ended up with this one, because it looked cheap.
Untuneable
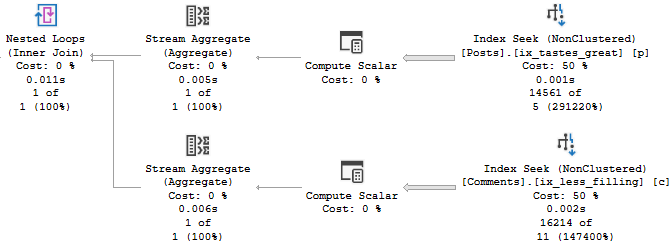
The plan for Joe’s version of the query is amazingly simple.
Bruddah.
Sometimes giving the optimizer a different query to work with helps, and sometimes it doesn’t.
Rewriting queries is tough business. When you change things and still get the same plan, it can be really frustrating.
Just know that behind the scenes the optimizer is working hard to rewrite your queries, too.
If you really want to change the execution plan you end up with, you need to present the logic to the optimizer in different ways, and often with different indexes to use.
Other times, you just gotta ask Joe.
Thanks for reading!
Going Further
If this is the kind of SQL Server stuff you love learning about, you’ll love my training. Blog readers get 25% off the Everything Bundle — over 100 hours of performance tuning content. Need hands-on help? I offer consulting engagements from targeted investigations to ongoing retainers. Want a quick sanity check before committing to a full engagement? Schedule a call — no commitment required.
In SQL Server 2019, a few cool performance features under the intelligent query processing umbrella depend on cardinality estimation.
Batch Mode For Row Store (which triggers the next two things)
Adaptive Joins
Memory Grant Feedback
If SQL Server doesn’t estimate > 130k(ish) rows are gonna hop on through your query, you don’t get the Batch Mode processing that allows for Adaptive Joins and Memory Grant feedback. If you were planning on those things helping with parameter sniffing, you now have something else to contend with.
Heft
Sometimes you might get a plan with all that stuff in it. Sometimes you might not.
The difference between a big plan and little plan just got even more confusing.
Let’s say you have a stored procedure that looks like this:
CREATE OR ALTER PROCEDURE dbo.lemons(@PostTypeId INT)
AS
BEGIN

    SELECT OwnerUserId,
	       PostTypeId,
		   SUM(Score * 1.0) AS TotalScore,
		   COUNT_BIG(*) AS TotalPosts
	FROM dbo.Posts AS p
	JOIN dbo.Users AS u
	    ON p.OwnerUserId = u.Id
	WHERE PostTypeId = @PostTypeId
	AND u.Reputation > 1
	GROUP BY OwnerUserId,
             PostTypeId
	HAVING COUNT_BIG(*) > 100;

END
GO
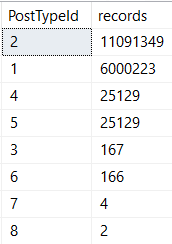
There’s quite a bit of skew between post types!
Working my way down
Which means different parameters will get different plans, depending on which one comes first.
At 12 seconds, one might accuse our query of sub-par performance.
One and Lonely
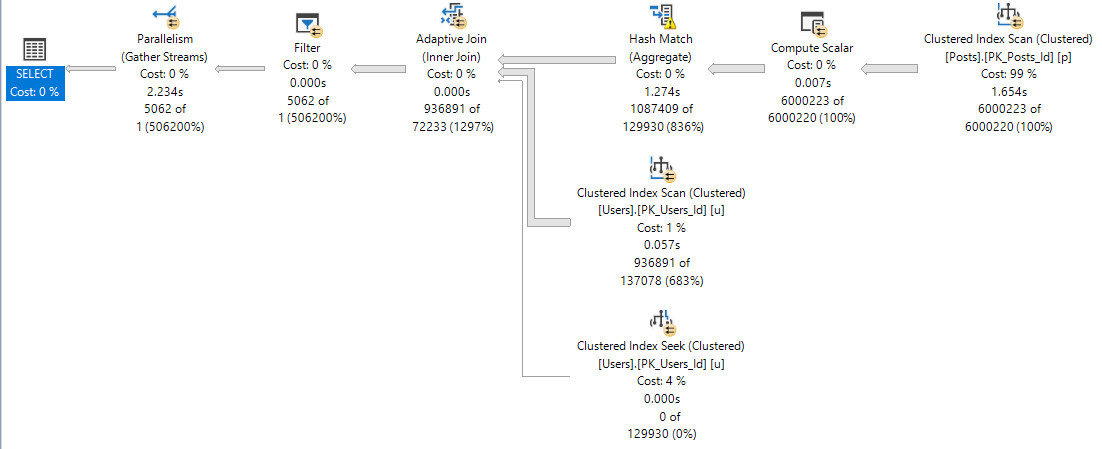
When one runs first, the plan is insanely different.
22 2s
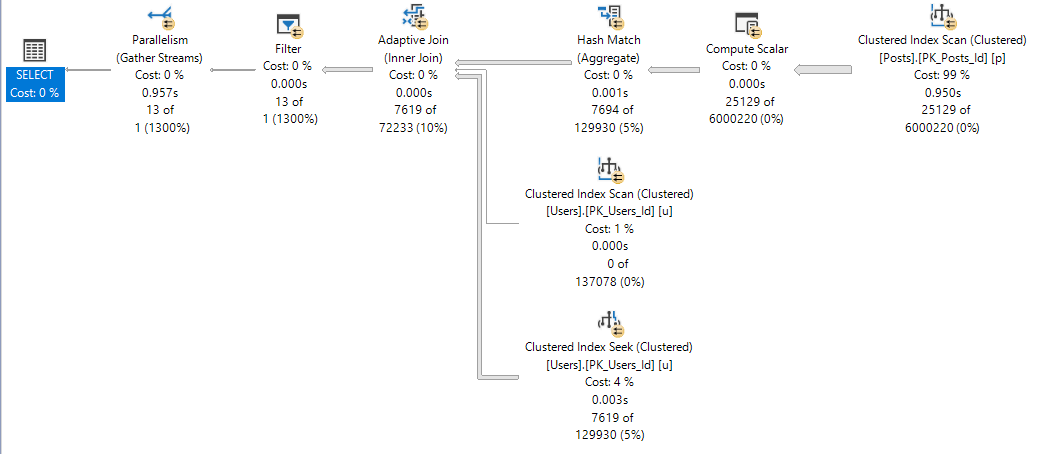
It’s about 10 seconds faster. And the four plan?
Not too shabby.
Four play
We notice the difference between 116ms and 957ms in SSMS.
Are application end users aware of ~800ms? Sometimes I wonder.
Alma Matters
The adaptive join plan with batch mode operators is likely a better plan for a wider range of values than the small plan.
Batch mode is generally more efficient with larger row counts. The adaptive join means no one who doesn’t belong in nested loops hell will get stuck there (probably), and SQL Server will take a look at the query in between runs to try to find a happy memory grant medium (this doesn’t always work splendidly, but I like the effort).
Getting to the point, if you’re going to SQL Server 2019, and you want to get all these new goodies to help you avoid parameter sniffing, you’re gonna have to start getting used to those OPTIMIZE FOR hints, and using a value that results in getting the adaptive plan.
I wish there was a query hint that pushed the optimizer towards picking this sort of plan, so we don’t have to rely on potentially changing values to optimize for.
Thanks for reading!
Going Further
If this is the kind of SQL Server stuff you love learning about, you’ll love my training. Blog readers get 25% off the Everything Bundle — over 100 hours of performance tuning content. Need hands-on help? I offer consulting engagements from targeted investigations to ongoing retainers. Want a quick sanity check before committing to a full engagement? Schedule a call — no commitment required.
Rounding out a few posts about SQL Server’s choice of one or more indexes depending on the cardinality estimates of literal values.
Today we’re going to look at how indexes can contribute to parameter sniffing issues.
It’s Friday and I try to save the real uplifting stuff for these posts.
Procedural
Here’s our stored procedure! A real beaut, as they say.
CREATE OR ALTER PROCEDURE dbo.lemons(@Score INT)
AS
BEGIN
    SELECT TOP (1000)
	       p.Id,
           p.AcceptedAnswerId,
           p.AnswerCount,
           p.CommentCount,
           p.CreationDate,
           p.LastActivityDate,
		   DATEDIFF( DAY,
		             p.CreationDate,
					 p.LastActivityDate
				   ) AS LastActivityDays,
           p.OwnerUserId,
           p.Score,
		   u.DisplayName,
		   u.Reputation
	FROM dbo.Posts AS p
	JOIN dbo.Users AS u
	    ON u.Id = p.OwnerUserId
	WHERE p.PostTypeId = 1
	AND   p.Score > @Score
	ORDER BY u.Reputation DESC;
END
GO
Here are the indexes we currently have.
CREATE INDEX smooth
    ON dbo.Posts(Score, OwnerUserId);

CREATE INDEX chunky
    ON dbo.Posts(OwnerUserId, Score)
	INCLUDE(AcceptedAnswerId, AnswerCount, CommentCount, CreationDate, LastActivityDate);
Looking at these, it’s pretty easy to imagine scenarios where one or the other might be chosen.
Heck, even a dullard like myself could figure it out.
Rare Score
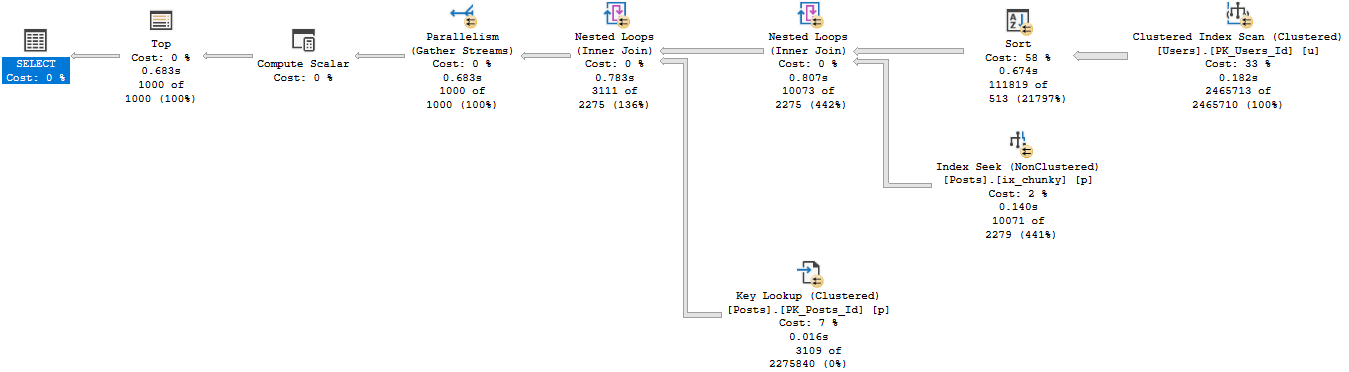
Running the procedure for an uncommon score, we get a tidy little loopy little plan.
EXEC dbo.lemons @Score = 385;
It’s hard to hate a plan that sinishes in 59ms
Of course, that plan applied to a less common score results in tomfoolery of the highest order.
Lowest order?
I’m not sure.
Except when it takes 14 seconds.
In both of these queries, we used our “smooth” index.
Who created that thing? We don’t know. It’s been there since the 90s.
Sloane Square
If we recompile, and start with 0 first, we get a uh…
Well darnit
We get an equally little loopy little plan.
The difference? Join order, and now we use our chunky index.
Running our procedure for the uncommon value…
Don’t make fun of me later.
Well, that doesn’t turn out so bad either.
Pound Sand
When you’re troubleshooting parameter sniffing, the plans might not be totally different.
Sometimes a subtle change of index usage can really throw gas on things.
It’s also a good example of how Key Lookups aren’t always a huge problem.
Both plans had them, just in different places.
Which one is bad?
It would be hard to figure out if one is good or bad in estimated or cached plans.
Especially because they only tell you compile time parameters, and not runtime parameters.
Neither one is a good time parameter.
Thanks for reading!
Going Further
If this is the kind of SQL Server stuff you love learning about, you’ll love my training. Blog readers get 25% off the Everything Bundle — over 100 hours of performance tuning content. Need hands-on help? I offer consulting engagements from targeted investigations to ongoing retainers. Want a quick sanity check before committing to a full engagement? Schedule a call — no commitment required.
If you recall yesterday’s post, we added a couple two column indexes to the Posts table.
Each one helped a slightly different query, but either index would likely be “good enough”.
This post will focus on another common scenario I see, where people added many single column indexes over the years.
In this scenario, performance is much more variable.
Singletonary
Here are our indexes:
CREATE INDEX ix_spaces
ON dbo.Posts(ParentId);

CREATE INDEX ix_tabs
ON dbo.Posts(Score);
Taking the same queries from yesterday:
SELECT COUNT_BIG(*) AS records
FROM   dbo.Posts AS p
WHERE  p.ParentId < 1
AND    p.Score > 19000
AND 1 = (SELECT 1);

SELECT COUNT_BIG(*) AS records
FROM   dbo.Posts AS p
WHERE  p.ParentId > 21100000
AND    p.Score < 1
AND 1 = (SELECT 1);
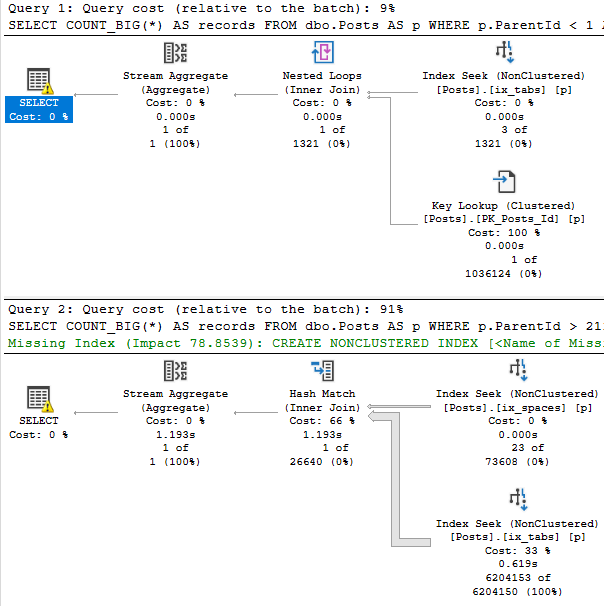
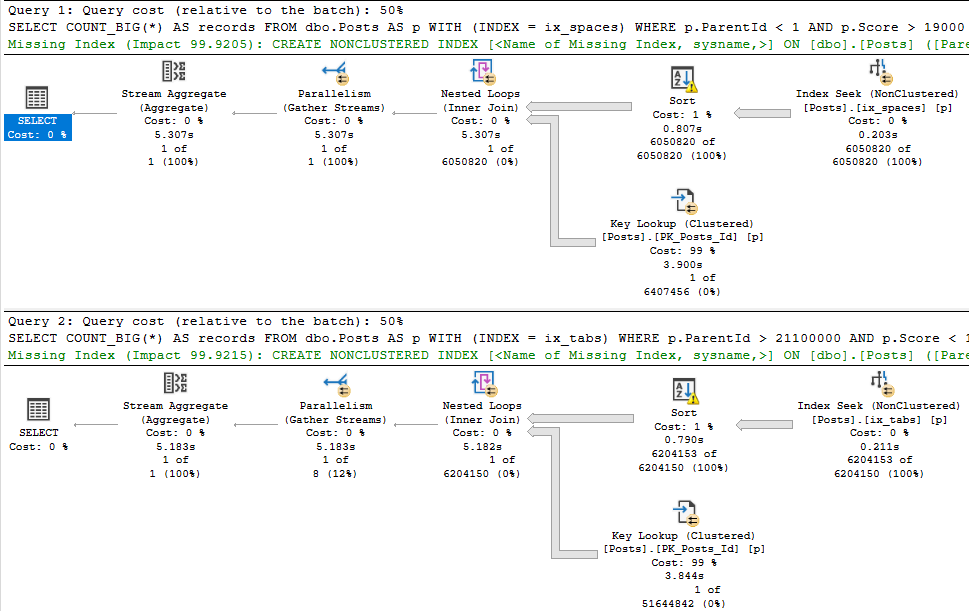
This is what the new plans look like:
Curious
The first thing you may notice is that the top plan performs a rather traditional key lookup, and the bottom plan performs a slightly more exotic index intersection.
Both concepts are similar. Since clustered index key columns are present in nonclustered indexes, they can be used to either join a nonclustered index to the clustered index on a table, or to join two nonclustered indexes together.
It’s a nice trick, and this post definitely isn’t to say that either is bad. Index intersection just happens to be worse here.
Wait, But…
You may have noticed that both queries get pretty bad estimates. You might even be thinking about leaving me a comment to update stats.
The thing is that I created these indexes, which means they get stats built with a full scan, and it’s a demo database where nothing changes.
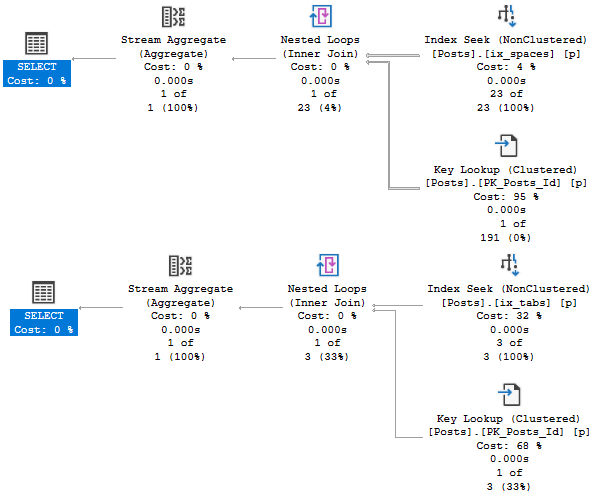
We just get unfortunate histograms, in this case. If I create very specific filtered statistics, both plans perform a key lookup.
CREATE STATISTICS s_orta ON dbo.Posts(ParentId) WHERE ParentId > 21100000 WITH FULLSCAN;
CREATE STATISTICS s_omewhat ON dbo.Posts(Score) WHERE Score < 1 WITH FULLSCAN;
CREATE STATISTICS s_emi ON dbo.Posts(ParentId) WHERE ParentId < 1 WITH FULLSCAN;
CREATE STATISTICS s_lightly ON dbo.Posts(Score) WHERE Score > 19000 WITH FULLSCAN;
This is necessary with the legacy cardinality estimator, too. Rain, sleet, shine.
Bad estimates happen.
When your tables are large enough, those 200 (plus one for NULLs, I know, I know) steps often can’t do the data justice.
Filtered stats and indexes can help with that.
Something I try to teach people is that SQL Server can use whatever statistics or methods it wants for cardinality estimation, even if they’re not directly related to the indexes that it uses to access data.
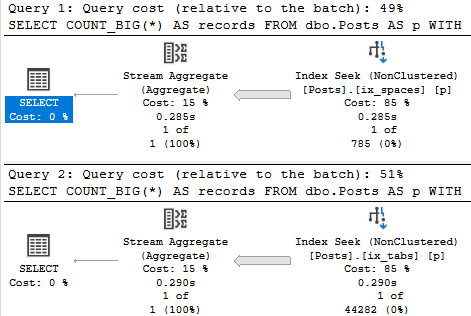
With filtered statistics, things go fine for both plans:
Sunshine
When Could This Cause Trouble?
Obviously, plans like this are quite sensitive to parameter sniffing. Imagine a scenario where a “bad” plan got cached.
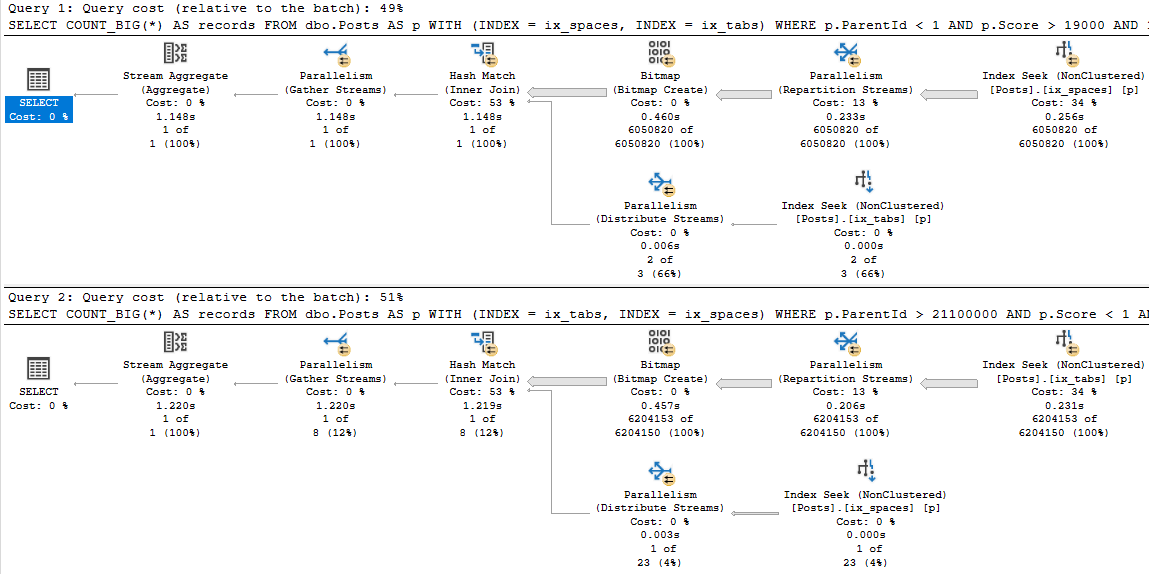
Multihint
Having one instance of this query running doesn’t cause much of a CPU uptick, but if user concurrency is high then you’d notice it pretty quickly.
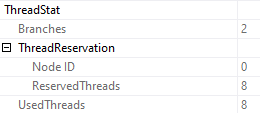
Parallel plans, by definition, use a lot more CPU, and more worker threads. These both reserve and use 8 threads.
Stretch
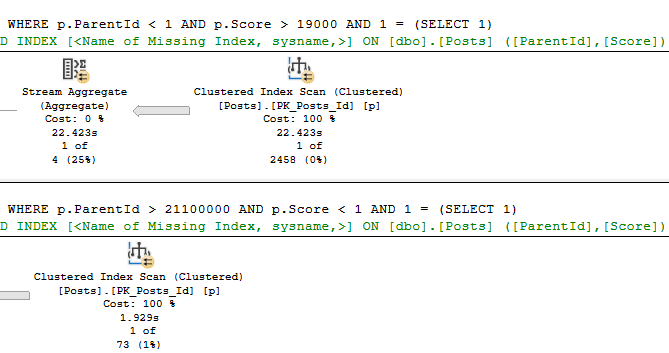
Those two plans aren’t even the worst possible case from a duration perspective. Check out these:
5-4-3-2-1
Doubledown
When talking index design, single column indexes are rarely a good idea.
Sometimes I’ll see entire tables with an index on every column, and just that column.
That can lead to some very confusing query plans, and some very poor performance.
Thanks for reading!
Going Further
If this is the kind of SQL Server stuff you love learning about, you’ll love my training. Blog readers get 25% off the Everything Bundle — over 100 hours of performance tuning content. Need hands-on help? I offer consulting engagements from targeted investigations to ongoing retainers. Want a quick sanity check before committing to a full engagement? Schedule a call — no commitment required.
When I’m working with clients, people who don’t spend a lot of time working with indexes have a lot of questions about indexes.
The general rule about leading column selectivity is an easy enough guideline to follow, but what happens if you’re not looking for equality predicates?
What if you’re looking for ranges, and those ranges might sometimes be selective, and other times not?
LET’S FIND OUT!
Chicken and Broccoli
Let’s take these queries against the Posts table. The number next to each indicates the number of rows that match the predicate.
SELECT COUNT_BIG(*) AS records /*6050820*/
FROM   dbo.Posts AS p
WHERE  p.ParentId < 1
AND 1 = (SELECT 1);

SELECT COUNT_BIG(*) AS records /*3*/
FROM   dbo.Posts AS p
WHERE  p.Score > 19000
AND 1 = (SELECT 1);

SELECT COUNT_BIG(*) AS records /*23*/
FROM   dbo.Posts AS p
WHERE  p.ParentId > 21100000
AND 1 = (SELECT 1);

SELECT COUNT_BIG(*) AS records /*6204153*/
FROM   dbo.Posts AS p
WHERE  p.Score < 1
AND 1 = (SELECT 1);
In other words, sometimes they’re selective, and sometimes they’re not.
If we run these without any indexes, SQL Server will ask for single column indexes on ParentId and Score.
But our queries don’t look like that. They look like this (sometimes):
SELECT COUNT_BIG(*) AS records
FROM   dbo.Posts AS p
WHERE  p.ParentId < 1
AND    p.Score > 19000
AND 1 = (SELECT 1);

SELECT COUNT_BIG(*) AS records
FROM   dbo.Posts AS p
WHERE  p.ParentId > 21100000
AND    p.Score < 1
AND 1 = (SELECT 1);
When we run that, SQL Server asks for… the… same index.
Huhhhhh
Missing index request column order is pretty basic.
Instead, we’re gonna add these:
CREATE INDEX ix_spaces
ON dbo.Posts(ParentId, Score);

CREATE INDEX ix_tabs
ON dbo.Posts(Score, ParentId);
Steak and Eggs
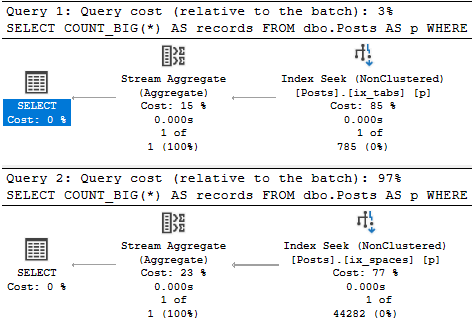
When we run those two queries again, each will use a different index.
If we force those queries to use the opposite index, we can see why SQL Server made the right choice:
SELECT COUNT_BIG(*) AS records
FROM   dbo.Posts AS p WITH (INDEX = ix_spaces)
WHERE  p.ParentId < 1
AND    p.Score > 19000
AND 1 = (SELECT 1);

SELECT COUNT_BIG(*) AS records
FROM   dbo.Posts AS p WITH (INDEX = ix_tabs)
WHERE  p.ParentId > 21100000
AND    p.Score < 1
AND 1 = (SELECT 1);
Having two indexes like that may not always be the best idea.
To make matters worse, you probably have things going on that make answers less obvious, like actually selecting columns instead of just getting a count.
This is where it pays to look at your indexes over time to see how they’re used, or knowing which query is most important.
There isn’t that much of a difference in time or resources here, after all.
Thanks for reading!
Going Further
If this is the kind of SQL Server stuff you love learning about, you’ll love my training. Blog readers get 25% off the Everything Bundle — over 100 hours of performance tuning content. Need hands-on help? I offer consulting engagements from targeted investigations to ongoing retainers. Want a quick sanity check before committing to a full engagement? Schedule a call — no commitment required.
In this video, I dive into the challenges of working with large and complex SQL queries, particularly those that are overly nested or contain numerous CTEs (Common Table Expressions). I share a specific example where I had to optimize a query that was running for about 30 seconds. By breaking down the query into smaller, more manageable parts and using temporary tables, we were able to significantly reduce execution time—from around 15 seconds to just under two seconds. This process not only improved performance but also made it easier to analyze and tune each component of the query independently. The video emphasizes the importance of avoiding overly complex queries and suggests that breaking down large queries into smaller, logically separated parts can lead to more efficient and maintainable code.
Full Transcript
Howdy folks, Erik Darling here with Erik Darling Data. Still, apparently, I guess. I guess we’re cool for the summer. And I realized that I had been writing and working with and talking a lot, and I even have a couple blog posts scheduled about how much I hate people who write big queries because they’re very misguided. People think, a lot of people who I’ve talked to, are like, well, you know, I have a CTEof this view or this drive table and SQL Server should cache that result and then do something else. And that’s just not what happens. And kind of like the more you just string together these, these little constructs, or nest them as deeply as your heart desires, or, you know, keep sort of tagging joins onto things. You know, it, it, it just doesn’t, just doesn’t scale well. I’ll say that. At some point, it makes sense both from a performance perspective and from an understandability and tunability perspective to break your query up at sort of logical stopping points to just not keep adding things on to your query to give you the results you want or give you some new piece of information. It’s not a good idea.
So I have this, this query in particular that I wrote from scratch. And while I was writing it and running it and everything, SQL Server came up with a number of missing index suggestions for me. It actually came up with six. And I’ve thoughtfully labeled them missing index one through six down here. And I’ve added all these already. I’m not going to sit here and make you watch me add these indexes. But they’re all stuff that SQL Server was like, hey, if you add this, it’ll make the query faster. And to some extent, they did. But this query still runs for about 30 seconds. So we have this question post thing up here that basically finds questions with some filters on them to make sure they have like a positive score and they’ve accepted an answer and they haven’t been closed or community owned. And sort of the same deal with answers down here. I just make sure they have a positive score and that they’re not community owned. And then what we do is join those two tables together on the parent ID of the answer equaling the ID of the question to make sure that we don’t have someone who’s self answered. Right? So that’s the only point of that.
And then we go and hit the votes table to see if there are any bounties assigned to those questions or answers. And then we come out of there and we do some sort of annoying, complicated stuff to join back to the users table, get some information about comment scores. But this is, you know, I know it’s not fun looking at code like this. You don’t have to understand it all. You just have to understand that this is the kind of code that I see when I work with people that I end up doing this exact same process that I’m going to show you. So let’s look at the query plan real quick. This inserts 2,000, 29,380 rows and it runs for 30 seconds right there. We zoom in on this. That’s 30 seconds of wall clock time that we spend running this query.
If we zoom out and we look at the query plan, zoom to fit, I want nothing to do with this. I will not sit there and try to troubleshoot this plan as it is. That is completely misguided. It’s not a way to, not a good way to do anything. What I do when I see a query like that is I think, well, that query is too big for me and it’s probably too big for the optimizer too. I bet the optimizer is not having a very good time with that. So what I do mentally is I start looking for breaking points in the query and scroll down a little bit. Let’s say we can take these first two CTE, right? These first two, the answer post thing and the question post thing.
And let’s just control, let’s highlight the right part first and hit control L and SQL Server thinks that about 184,000 rows are going to come out of there and that about 773,000 rows are going to come out of there. And if we go the whole nine with that and we look, SQL Server thinks that about 8,000 rows are going to come out of that. That might be a good guess. It might not be. We don’t, we’re only looking at the estimated plan, so we can’t figure that out. So if we wanted to, if we wanted to do something smart with this, we could take the results of that initial set of joins and just dump those into a table, ensuring that there is no collusion with, no self-collusion on here.
Whenever there’s self-collusion, I get worried that there are other perversions afoot. So let’s run this query. Let’s get query plans turned on. Let’s run this and see what happens. Okay. That takes about, let’s go to the execution plan, about three seconds.
Okay. That’s fair. Three seconds is totally fair because we’re, we’re hitting not, if we look at the, the estimates and the actuals over here, zoom in on that. Wait, no, sorry. Zoom in on, zoom in on this one. Here we go. SQL Server thought that 8,300 rows are going to come out of there, but we ended up with 2.05 million rows.
So let me ask you a question right from the get-go. If SQL Server is making a bad guess by that much here, how much do you think that bad guess hurts us downstream? How much do you think SQL Server being off by, oh, 2 million rows is hurting the other query?
I would guess a pretty good amount. I would also guess that it would be really, really tough to track down that poor estimate if you were just staring at that great big lump of query plan. Staring at this much smaller lump of query plan, it’s a lot easier to figure these things out.
I’m not going to dig in on why this takes two, three seconds and we get the estimate wrong by that much. I’m just going to say, okay, we have, we have that set of data in a temp table. This is a pretty self-contained issue.
We can come back to this later. All right. So now let’s look at bounties, right? So this is the second, well, this is technically the fourth CTE in there. We had the first two that joined to each other, right, and that third CT. So this is number four.
This is bounties. So let’s run this and let’s see how long bounties takes. Let’s see how we do with bounties. Bounties sure is dragging on for a long time, isn’t it? Bounties is, oh boy, bounties is chugging. Okay.
So that took a while, right? Let’s look at the query plan. And this is just about 16 seconds. Yowza. 15.7 seconds. What are we going to do about that? Well, this is a really strange looking execution plan to me. If it’s not strange looking to you, I don’t know.
Perhaps you’re from another planet. But we have these, if we look over here, let’s start with the right because everyone tells you to read from right to left. So let’s start with the right. We have these constant scans. And they concatenate together. And they compute a scalar apparently. And I think it’s very funny that we go from these thick arrows to these thin arrows to this thick arrow to this thin arrow to this thick arrow.
It’s just like thick, thin, thick, thick, thick, thick, thick, thick, thick, thick. A lot of thicks. A lot of switches from thick to thin in there. It’s worse than me. I’m balloon, yo-yo dieting. But where these constant scans come from is a little tough to track down, especially in older versions of SSMS, where you don’t have these row counts automatically by operators. But if you look at this arrow here, we have that 2.05 million number, right? And if we go look here, and that’s the same number. We look here, that’s the same number. So these two constant scans are actually emitted from here. And what they’re doing is they’re trying to make sense of this join on an or clause. Sometimes you’ll get that constant scan thing. Other times you’ll get a table spool. Depends on how SQL Server is feeling that day. But it does something really goofy.
It takes these 2 million rows and these 2 million rows, and it turns them into 410 million rows. And then it sorts 410 million rows, right? Oh, it’s top end sort, right? 410 million rows. Attempts to merge them together, but doesn’t because we still get 410 million rows on the other side.
So this entire thing was an exercise in futility. Then we seek into this index 410 million times. Okay. I’m starting to understand why this thing is slow. And if you’ve read my blog at any point in the past, I don’t know, week or so, week and a half, you’ve probably seen that I hate joins with or clauses.
So let’s not do this. Let’s get rid of this. Let’s do this differently. So what I’m going to show you is what happens when we just union all those two things together. Right? So exact same query, just we have one join here and one join here, and I union all them together. Right? Because if I use union, SQL Server is going to try to make a distinct result set. And if I try to make a distinct result set, that can slow things down.
So if we look at this execution plan, we are down to about two seconds just by splitting up that join with the or clause in it. Right? Did two separate queries, yet somehow it was way, way faster. Right? It was like 15 seconds down to 1.9 seconds. I’m pretty cool with that. So since I’m so cool with that, what I’m going to say is we’re going to take that and dump it into a temp table on its own.
All right? And that will still be pretty quick. That should be about two seconds. Yeah, 1.8 seconds there. Not bad. Not too shabby. Right? And so now all we have to do is look at how this last part of the query performs with those temp tables rather than with all those CTE chained together.
And this finishes very quickly too. This finishes in about 2.2, well, 2.3 seconds. Right? So that finishes quick. So now we have three queries essentially. Right? We have that first CTEthat we stick in a temp table. The second CTEthat we stick in a temp table.
And now this third query that just hits that last temp table. So we’ve broken the query down into three steps. And the sum of those three steps is much, much shorter than all of those steps put together into one big chained together CTEquery. All right? So now because I want to show you something cool, what I’m going to do is take all of these.
I’m going to take all of that and I’m going to do it all in one go. I’m going to drop out those temp tables that I created before. And I’m going to do the exact same thing. So have this here.
And that’s going to stick into a temp table. And then this is going to go and stick into a temp table. And then this is going to go and run from the final temp table. And then we’re just going to check to make sure that we have the same number of rows going. Now this should take, if I turn the query plans off, it takes around about five seconds. With the query plans turned on, it’s a little bit longer.
All right. Eight seconds. I’ll live with that. But now what we have, and I think this is really the whole point of this exercise, what we have is three queries that we can try to figure out that are all much, much smaller in size. We have, you know, I don’t know.
We already added six indexes for this thing. There’s another missing index request there and another one there and another one there. Maybe they’d help. Maybe they wouldn’t. I don’t know. But we have three distinct queries now that we can work with. All right. We have, you know, we can investigate why each one of these is slow individually. And that’s much, much less difficult than it is to figure out why those chained together CTE and other nonsense are all performing poorly.
So we could go further from here. We could keep going. We could keep trying to tune things further. But I’m pretty happy going from roundabout 30 seconds, roundabout.
Well, I mean, that was eight seconds with the query plans. Oops. I have to get rid of those temp tables first. So if we turn query plans off and look at this, it should be a little bit quicker. But, you know, it’s nice to be able to test things in different ways and get your results back and everything.
But anyway, we went from, oh, it took seven seconds that time. Good for us. Anyway. So anyway, the moral of the story is when you get called in to tune a very, very big query like that, generally speaking, it’s not a good idea to try to consume that query as a whole.
The first steps I always take are just like what we saw here. I start looking at individual parts of the query, individual statements, how they tie together. And I start breaking them up into logical points like that, where I’ll stick one set of data into a temp table, work off that set of data. Just because, you know, we could totally try indexing temp tables and other stuff.
But I just find that, you know, materializing results, which CTE, derived tables, views don’t do, materializing results and giving SQL Server a known quantity to work off of, to build stats on, to, you know, figure out relationships with, is usually much, much better than asking it to do that over just the results of a whole bunch of queries, kind of tacked and hammered and duct taped and glued and, I don’t know, bound and gagged.
Oh, it’s getting, oh, it’s getting, sorry, I didn’t mean to bring my personal life into this. But it’s like kind of like lumping them all together into one sort of crazy mess. So anyway, that’s sort of the moral of this story.
Stop writing big queries. Unless you really know what you’re doing. If your last name is Mechanic or White, not Ozar, if your last name is Obish, yeah, then you can write big queries. Otherwise, I don’t want to hear about it.
Anyway, I hope you enjoyed watching this. I hope you learned something. I hope you take what you learned here and start fixing some problems with it. And I don’t know. I will apparently see you in the next video. Goodbye.
Going Further
If this is the kind of SQL Server stuff you love learning about, you’ll love my training. Blog readers get 25% off the Everything Bundle — over 100 hours of performance tuning content. Need hands-on help? I offer consulting engagements from targeted investigations to ongoing retainers. Want a quick sanity check before committing to a full engagement? Schedule a call — no commitment required.
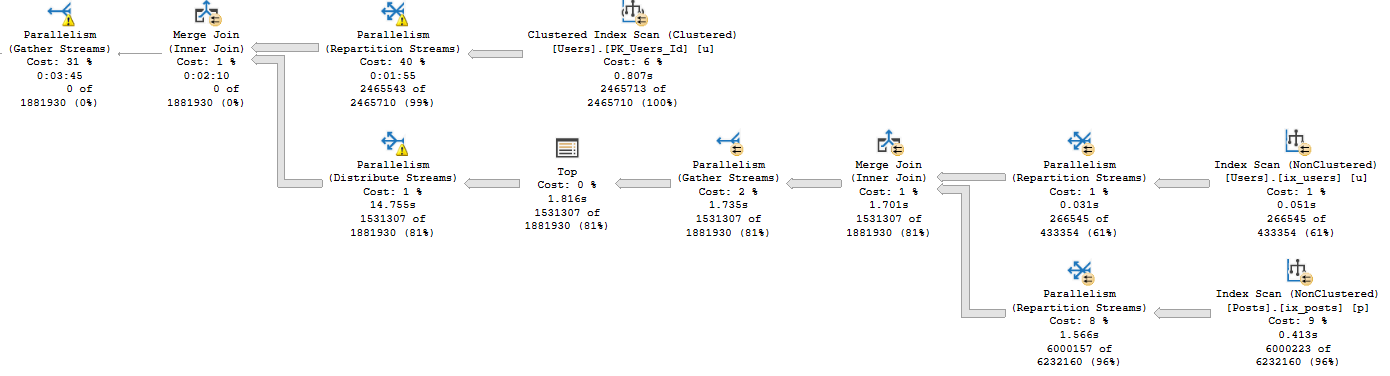
The root of this demo was trying to show people silly things about CTEs, how TOP can fence things off, and how TOP introduces a serial zone in plans unless it’s used inside the APPLY operator.
The result was this magnificent beast.
Long Mane
Why is this magnificent?
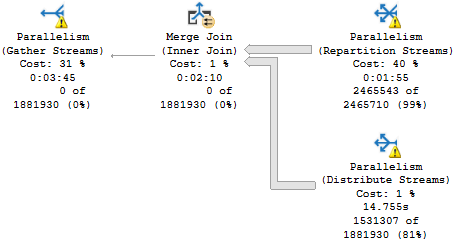
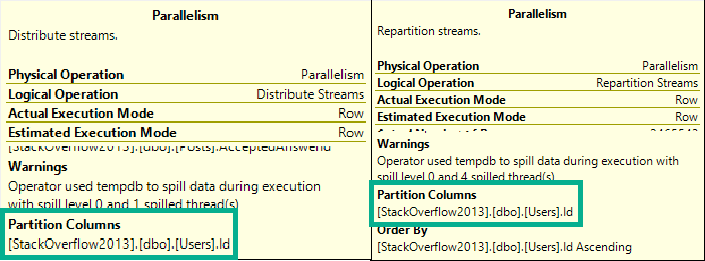
Because we have the trifecta. We have a spill on all three types of parallel exchanges.
It’s not gonna work out
Let’s take a closer look at those beauties.
*slaps hood*
Why Did That Happen?
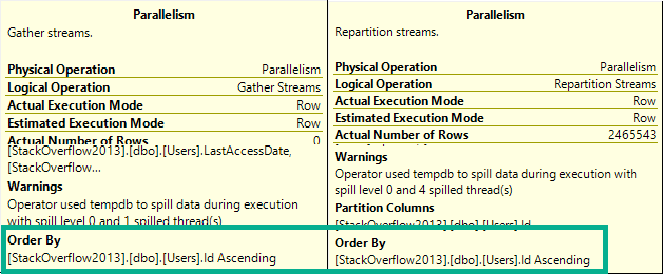
This plan has a Merge Join, which requires ordered input.
That means the Repartition and Gather Streams operators preserve the order of the Id column in the Users table.
News Of The World
They don’t actually order by that column, they just keep it in order.
But what about Distribute Streams? GREAT QUESTION!
Legalize Burberry
It has the same Partition Column as Repartition Streams. They both have to respect the same order going into the Merge Join, because it’s producing ordered output to the Gather Streams operator.
In short, there’s a whole lot of buffers filling up while waiting for the next ordered value.
Were Parallel Merge Joins A Mistake?
[Probably] not, but they always make me nervous.
Especially when exchange operators are the direct parent or child of an order preserving operator. This also goes for stream aggregates.
I realize that these things are “edge cases”. It says so in the documentation.
The Exchange Spill event class indicates that communication buffers in a parallel query plan have been temporarily written to the tempdb database. This occurs rarely and only when a query plan has multiple range scans… Very rarely, multiple exchange spills can occur within the same execution plan, causing the query to execute slowly. If you notice more than five spills within the same query plan’s execution, contact your support professional.
Well, shucks. We only have three spills. It looks like we don’t qualify for a support professional.
Thanks for reading!
Going Further
If this is the kind of SQL Server stuff you love learning about, you’ll love my training. Blog readers get 25% off the Everything Bundle — over 100 hours of performance tuning content. Need hands-on help? I offer consulting engagements from targeted investigations to ongoing retainers. Want a quick sanity check before committing to a full engagement? Schedule a call — no commitment required.
If you’ve made it this far, you’ve learned a few things:
Not all spills are worth trying to fix
The more columns you select, the worse spills get
The larger your string datatypes are, the worse spills get
Today’s post won’t prove much else different from those things, but follow along if you’re interested.
Batter Up
Our first example looks like this:
SELECT v.*
FROM dbo.Votes AS v
LEFT  JOIN dbo.Comments AS c
ON v.PostId = c.PostId
WHERE ISNULL(v.UserId, c.UserId) > 2147483647;
We’re joining Votes to Comments with kind of a funny where clause, again.
This’ll force us to join both tables fully together, and then filter things out at the end.
Maximum Bang For Maximum Buck.
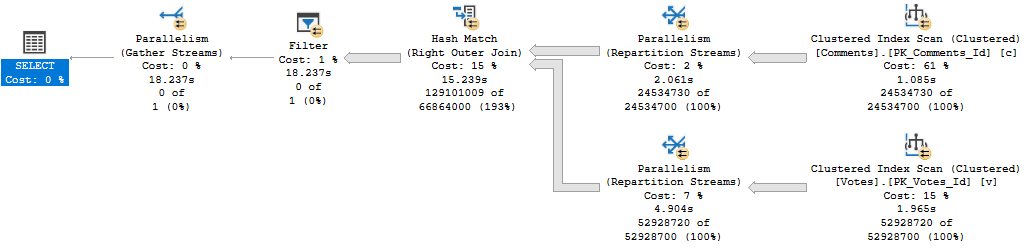
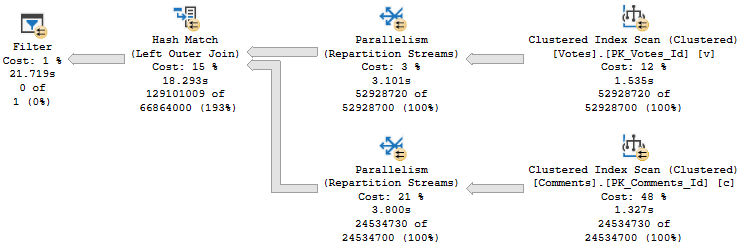
With no restrictions, this query runs for about 18 seconds with a 4.6GB memory grant.
Stolen wine
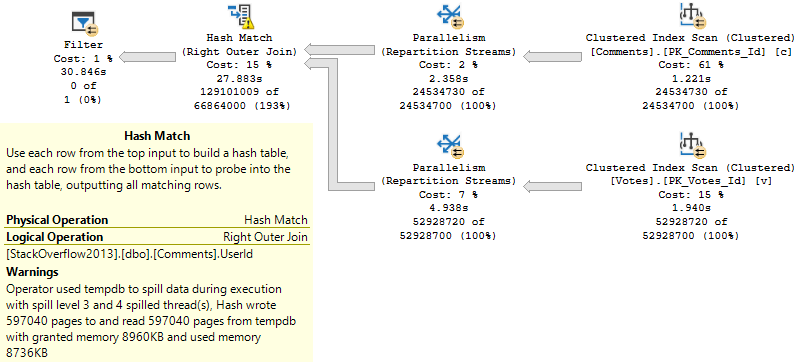
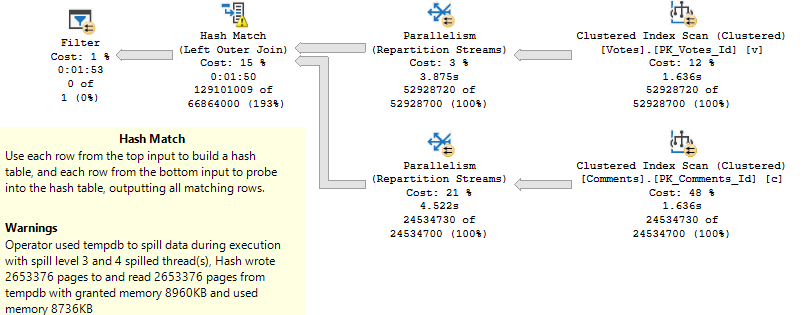
If we restrict the memory grant to 10MB, it runs for around 30 seconds. The spill is fairly large, too: 600k pages.
Paul White Likes Cowbells
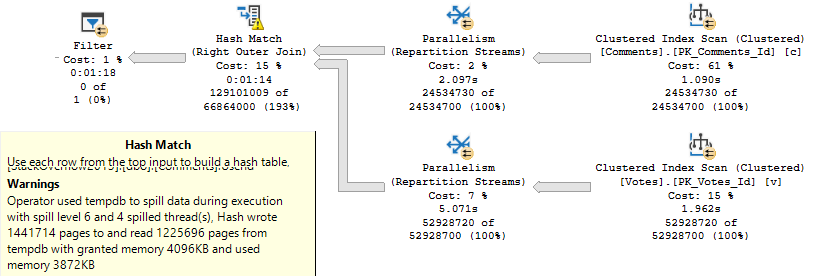
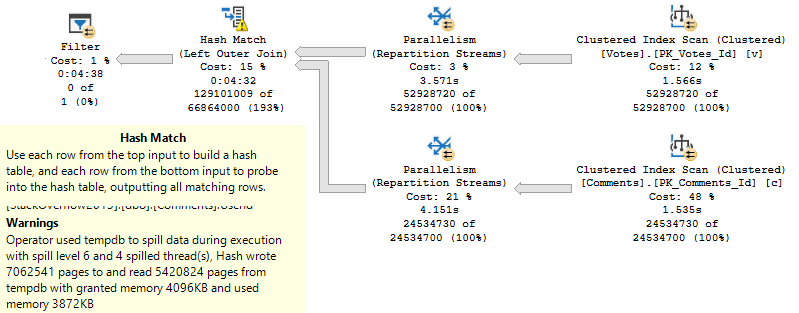
Dropping it down to 4.5MB follows a similar pattern. I told you. No surprises. Easy reading.
Slightly less good, eh?
Spill level 6. 1.4mm pages. Runs for a minute eighteen.
It’s almost like memory is kind of a big deal for SQL Server, huh?
That might be something to consider the next time you look at the size of your data in relation to the amount of memory that pesky VM admin swears is “enough” for SQL server.
Home Team
Our first query was selecting all the columns from the Votes table.
This time, we’re gonna select everything from the Comments table, including that pesky NVARCHAR 700 column.
SELECT c.*
FROM dbo.Votes AS v
LEFT  JOIN dbo.Comments AS c
ON v.PostId = c.PostId
WHERE ISNULL(v.UserId, c.UserId) > 2147483647;
Get in loser
About 22 seconds, with a 9.7GB memory grant.
If you recall up a little further, when we just selected the columns from Votes, the grant was 4.6GB.
Still big, but look at those string columns inflating things again. Golly and gosh.
With a 10MB grant, we shoot right to nearly 2 minutes.
DEAR LORD
If you’re keeping score at home, bloggers are very patient people.
My, my, my
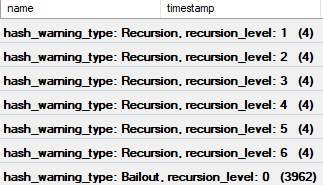
That’s 4:32 of my life that I’m never getting back. And I have to waste it again because I forgot to look at the hash bailout extended event for this.
There we are.
I’m bailing out of finishing this post tonight.
That represents a significant performance degradation.
Ahem.
Tomorrow, we’ll look at Exchange Spills, which represent an even worse one.
Thanks for reading!
Going Further
If this is the kind of SQL Server stuff you love learning about, you’ll love my training. Blog readers get 25% off the Everything Bundle — over 100 hours of performance tuning content. Need hands-on help? I offer consulting engagements from targeted investigations to ongoing retainers. Want a quick sanity check before committing to a full engagement? Schedule a call — no commitment required.