In this video, I delve into an interesting scenario comparing the performance of a stored procedure using a temp table versus one utilizing a table variable under high concurrency in SQL Server 2019. Surprisingly, despite the usual criticisms of table variables, my tests showed that they outperformed the temp table by nearly 30 seconds. However, I also explore the new feature introduced in SQL Server 2019—tempDB metadata being stored in memory—which was supposed to enhance performance further. Unfortunately, this feature didn’t provide a significant boost for either method during my tests. The video concludes with a hopeful note, suggesting that once everyone upgrades to SQL Server 2019, the use of temp tables could become more widespread and efficient, potentially leading to an end to my current dead-end job at Erik Darling Data. Who knows, maybe I’ll find myself sipping cocktails on a beach in Bora Bora instead!
Full Transcript
Erik Darling here, still stuck in this dead-end job at Darling Data, or Erik Darling Data, whatever that idiot named the company. And I think, was it a week ago? Maybe it was a week ago. It could very well have been a week ago. I recorded a video showing a race between a store procedure that uses a temp table and a store procedure that uses a table variable under very high concurrency, and found, interestingly, that the much maligned table variable did indeed get off to, did indeed cross the finish line much, much faster. And it’s full 30 seconds faster. But of course, you know, table variables do have a lot of downsides. And I covered them in that video. But you know, there’s stuff that, there’s stuff about them that can be unattractive at times. And SQL Server 2019 offers us this lovely new feature feature, where we can put some tempDB metadata in memory. By in memory, I mean using the Hecatonish in memory file group stuff for some of the views in tempDB. There’s lots of information about which ones are in there. And I have a feeling that more are going to end up there. So I’m not going to list them all now because that list will quickly be inaccurate. And I don’t want I don’t I don’t need any more inaccuracies in my in my video.
So I’m just going to leave that alone. You can you can read whatever current documentation or whatever documentation is current when you watch this, because you are going to watch this because you have no choice because you are also stuck in your dead end job. Just not a darling, Eric, darling, darling, Eric data. Dead. So just to recap a little bit what we do here, we have our first store procedure up here that uses a temp table, we create a temp table, we insert some stuff into the temp table, and then that’s it. We just create it jumping in. That’s all. And then one down here, where we declare a table variable, and insert into the table variable. And then that’s it. That’s that’s all we do.
It’s the end of the road. To wrap those up nice and neat and make calling them from an outside application easier. I have this store procedure that wraps both of them in up and gets us a number to pass into them. And then executes one or the other based on whatever we pass in here. So we’re going to So if we do that, we do that. If we do that, we do that. Good. So what I have SQL Server 2019 is of course, this lovely, lovely new setting. Tim DB metadata memory optimized, our value in use is one that means it’s been enabled. And now let’s see how things turn out this time around.
This time, though, I want to run the table variable test first, because I want to see if we can do any better. So remember, remember last time, this finished in about eight seconds. So let’s see if the in memory stuff helps the temp table variable. So I’m going to hit that. I’m going to go over to this window when SP who is active and just kind of watch stuff go through in the weight info column is still going to be remarkably empty. And we are done. How long did that take? That took 7.599. So I don’t know what is that a 400 millisecond or so difference. I don’t know. I don’t think that that was very helpful.
So it looks like table variables are still still fast, but the new feature doesn’t really help them spin any faster. Now let’s go back and let’s test temp tables because remember last time temp tables took about 38 seconds, nearly 40 seconds to run. So let’s get who is active ready. Let’s clear that screen. So we have no bias or judgment going on there.
And we’ll kick that off and let’s see what SP who is active tells us. Ooh, the weight info column here is no, we are not seeing all those page latch EX weights. And we’re going, we’re going, and we’re done. And that was not 38 seconds, was it?
That was 11.7 seconds. So pretty cool that under real high concurrency, we can get much better. Tempt table performance from SQL Server 2019 with our fancy in memory, temp DB metadata feature. So that’s nice. I like that. I enjoy that.
And I look forward to, you know, being able to use temp tables all willy nilly as soon as everyone just goes ahead and goes, goes ahead and upgrades 2019 or all your problems are solved. And you probably won’t even, probably won’t even need me anymore.
I can go, go pursue my dreams of getting out of this dead end job. And I don’t know, maybe I’ll, maybe I’ll open a bar on the beach in Bora Bora. And we’ll look into that.
And we’ll look into that. we’ll look into that. So,
Going Further
If this is the kind of SQL Server stuff you love learning about, you’ll love my training. Blog readers get 25% off the Everything Bundle — over 100 hours of performance tuning content. Need hands-on help? I offer consulting engagements from targeted investigations to ongoing retainers. Want a quick sanity check before committing to a full engagement? Schedule a call — no commitment required.
If you head to my GitHub repo, there’s an update to sp_PressureDetector, a free script I publish to help you figure out when your server is under CPU or memory pressure.
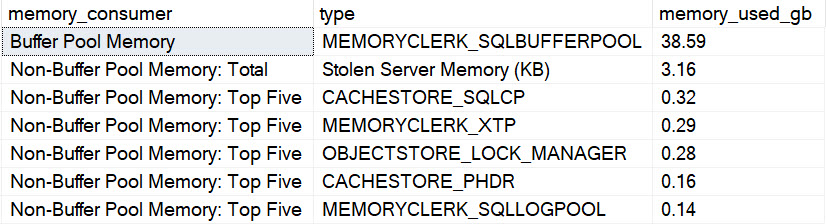
While working with a client recently, I found it useful to illustrate how much of their memory was used by different memory consumers.
Buffer pool
Total other
Top 5 other
It helps put in perspective just how many different things are asking for a piece of your precious RAM.
blue
This is a bad example from my personal server laptop, but you get the idea.
Anyway, that’s that. clink over to my GitHub repo to download it.
Thanks for reading!
Going Further
If this is the kind of SQL Server stuff you love learning about, you’ll love my training. Blog readers get 25% off the Everything Bundle — over 100 hours of performance tuning content. Need hands-on help? I offer consulting engagements from targeted investigations to ongoing retainers. Want a quick sanity check before committing to a full engagement? Schedule a call — no commitment required.
Over in my GitHub repo, I’ve added a file that will create an Agent Job to update statistics using Ola Hallengren’s IndexOptimize script.
It’s something I hand out enough that I figured people might be interested in it. Currently, it’s not a default offering from Ola, it’s uh… custom code.
There are lots of people who should be using this, too.
You need to be using a relatively new version of Ola’s scripts
This script utilizes the @StatisticsModificationLevel parameter, added 2018-06-16
That parameter is currently set to 5, and you may need to change that depending on your environement
There are some things you’ll need to change in the script, if you’re doing anything really custom:
It targets the master database
It’s owned by the sa account
It’s set to run at midnight
It has no failure emails or alerts set up
This is a very vanilla starting place. It’s up to you to make it yours.
To report any issues with Ola’s scripts, head over to this GitHub repo.
To get the Agent Job script, head over to my GitHub repo
Thanks for reading!
Going Further
If this is the kind of SQL Server stuff you love learning about, you’ll love my training. Blog readers get 25% off the Everything Bundle — over 100 hours of performance tuning content. Need hands-on help? I offer consulting engagements from targeted investigations to ongoing retainers. Want a quick sanity check before committing to a full engagement? Schedule a call — no commitment required.
Yesterday we looked at how parallel scans grab rows from partitioned tables. All of those queries were performing full scans of the Votes table, and in some cases threads were given no work to do. That could look troubling in a parallel query, because we’ve given worker threads to this query and they appear to be doing nothing.
Despite my oft frustration with Repartition Streams, it can come in quite handy, especially here.
In today’s experiment, we’re going to look at how plans running at different DOPs can be faster when seeking to partitions.
I’ll let you decide if these queries are being run on Standard Edition, or Developer/Enterprise Edition.
The setup
Because I want to test seeking into partitions, and a potentially more realistic query scenario with a couple joins, the query form is changing a little bit.
SELECT
    DATEPART(YEAR, vp.CreationDate) AS VoteYear,
    DATEPART(MONTH, vp.CreationDate) AS VoteMonth,
    COUNT_BIG(DISTINCT vp.PostId) AS UniquePostVotes,
    SUM(vp.BountyAmount) AS TotalBounties
FROM dbo.Votes16_p AS vp
JOIN dbo.Comments AS c
    ON c.PostId = vp.PostId
JOIN dbo.Users AS u
    ON u.Id = c.UserId
WHERE vp.CreationDate BETWEEN '2013-01-01 00:00:00.000'
                          AND '2013-12-31 00:00:00.000'
GROUP BY
    DATEPART(YEAR, vp.CreationDate),
    DATEPART(MONTH, vp.CreationDate)
Very realistically bad, that. You people.
The way this is written, the query will access two partitions that contain data for the year 2013.
CREATE PARTITION FUNCTION VoteYear16_pf(DATETIME)
    AS RANGE RIGHT FOR VALUES
    (
        '20080101',
        '20080601',
        '20090101',
        '20090601',
        '20100101',
        '20100601',
        '20110101',
        '20110601',
        '20120101',
        '20120601',
        '20130101',
        '20130601',
        '20140101',
        '20140601'
    );
GO
At DOP 4
All four threads seeking into the Votes table get rows to work on, and the entire thing runs for close enough to 14 seconds for me not to care.
buggysplitted
If one were to find themselves in the midst of having nothing to do, one might find that two threads each got groovy with two partitions.
At DOP 8
Things get a little awkward.
?
We end up with three threads that don’t do anything, sort of like in yesterday’s post when we had to touch empty partitions.
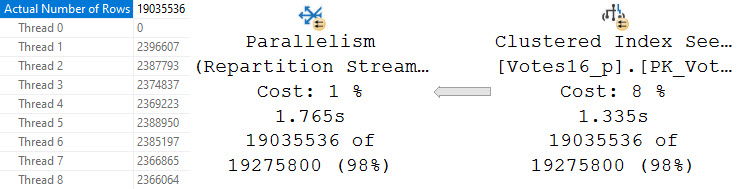
Despite the seek into the Votes table here taking about 350ms longer, the query overall runs about 5 seconds faster.
Fortunately, there’s a helpful repartition streams after the index seek that rebalances rows on threads.
thanks, robot
I’m not adding all those up for you.
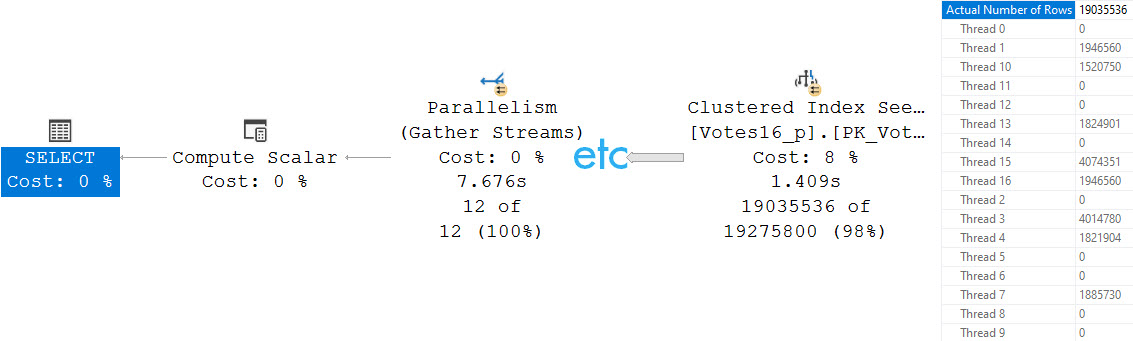
At DOP 16
Cha-ching, etc.
dopophobe
Eight threads get work, and eight don’t. The seek now takes a touch longer, but the query itself now finishes in 7.6 seconds.
Just like above, a repartition streams after the seek evens out row distributions.
Thinkin’ Tree
Even though higher DOPs are technically less helpful seeking into the Votes table, they obviously have some benefit to other operations in the query plan.
Whether or not it’s always worth the sacrifice takes some testing, and it might change based on how many partitions you’re touching.
Don’t be too concerned about lopsided parallelism at the seek or scan, as long as you have a repartition streams that adequately rebalances things afterwards.
But as people not from Australia are fond of saying, you should never run queries above DOP 8 anyway ?
Thanks for reading!
Going Further
If this is the kind of SQL Server stuff you love learning about, you’ll love my training. Blog readers get 25% off the Everything Bundle — over 100 hours of performance tuning content. Need hands-on help? I offer consulting engagements from targeted investigations to ongoing retainers. Want a quick sanity check before committing to a full engagement? Schedule a call — no commitment required.
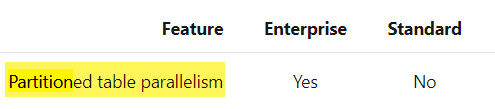
UPDATE 2021-04-14: Microsoft has updated the documentation for all 2016+ versions of SQL Server to indicate that parallelism is available for partitioned tables in non-Enterprise versions.
For the sake of completeness, I did all my testing across both Standard and Developer Editions of SQL Server and couldn’t detect a meaningful difference.
There may be scenarios outside of the ones I tested that do show a difference, but, uh. I didn’t test those.
Obviously.
Every table is going to test this query at different DOPs.
SELECT
    DATEPART(YEAR, vp.CreationDate) AS VoteYear,
    DATEPART(MONTH, vp.CreationDate) AS VoteMonth,
    COUNT_BIG(DISTINCT vp.PostId) AS UniquePostVotes,
    SUM(vp.BountyAmount) AS TotalBounties
FROM dbo.Votes_p AS vp
GROUP BY
    DATEPART(YEAR, vp.CreationDate),
    DATEPART(MONTH, vp.CreationDate);
Two Partitions
Here’s the setup:
CREATE PARTITION FUNCTION VoteYear2013_pf(DATETIME)
    AS RANGE RIGHT FOR VALUES
    (
        '20130101'
    );
GO


CREATE PARTITION SCHEME VoteYear2013_ps
    AS PARTITION VoteYear2013_pf
    ALL TO ([PRIMARY]);

DROP TABLE IF EXISTS dbo.Votes2013_p;

CREATE TABLE dbo.Votes2013_p
(
    Id int NOT NULL,
    PostId int NOT NULL,
    UserId int NULL,
    BountyAmount int NULL,
    VoteTypeId int NOT NULL,
    CreationDate datetime NOT NULL,
    CONSTRAINT PK_Votes2013_p_Id
        PRIMARY KEY CLUSTERED (CreationDate, Id)
) ON VoteYear2013_ps(CreationDate);


INSERT dbo.Votes2013_p WITH(TABLOCK)
    (Id, PostId, UserId, BountyAmount, VoteTypeId, CreationDate)
SELECT v.Id,
       v.PostId,
       v.UserId,
       v.BountyAmount,
       v.VoteTypeId,
       v.CreationDate
FROM dbo.Votes AS v;
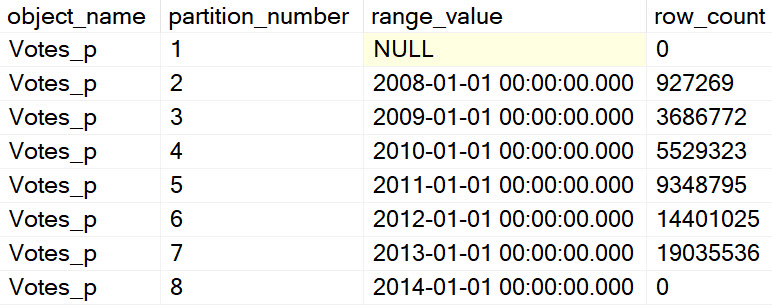
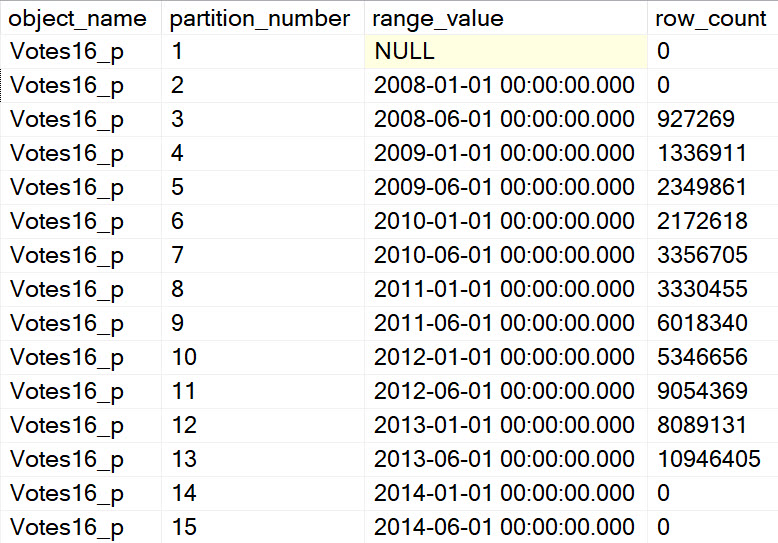
The data split looks like this:
not a good use of partitioning
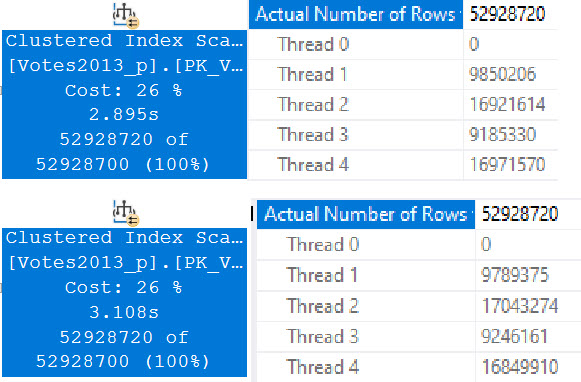
Running our test query at DOP 4, there are slight differences in counts across threads, but slight timing differences can explain that.
bonker
Standard Edition is on top, Developer Edition is at the bottom. There is a ~200ms difference here, but averaged out over multiple runs things end up pretty dead even.
Even looking at the row counts per thread, the distribution is close across both versions. I think it’s decently clear that the four threads work cooperatively across both partitions. A similar pattern continues at higher DOPs, too. I tested 8 and 16, and while there were slight differences in row counts per thread, there was a similar distribution pattern as at DOP 4.
Eight Partitions
Using a different partitioning function:
CREATE PARTITION FUNCTION VoteYear_pf(DATETIME)
    AS RANGE RIGHT FOR VALUES
    (
        '20080101',
        '20090101',
        '20100101',
        '20110101',
        '20120101',
        '20130101',
        '20140101'
    );
GO
We’re going to jump right to testing the query at DOP 8.
dartford
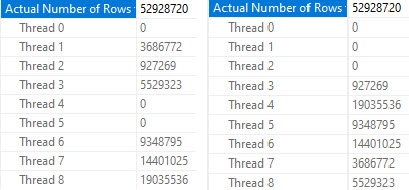
Again, different threads end up getting assigned the work, but row counts match exactly across threads that did get work, and those numbers line up exactly to the number of rows in each partition.
pattern forming
In both queries, two threads scanned a partition with no rows and did no work. Each thread that did scan a partition scanned only one partition.
At DOP 16, the skew gets a bit worse, because now four threads do no work.
crap
The remaining threads all seem to split the populated partitions evenly, though again there are slight timing differences that result in different row counts per thread, but it’s pretty clear that there is cooperation here.
At DOP 4, things get a bit more interesting.
bedhead
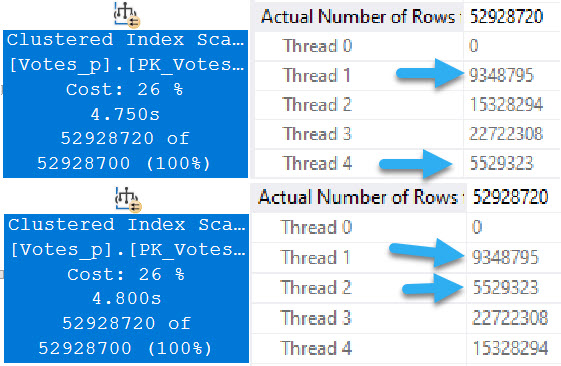
In both queries, two threads scan exactly one partition.
The rows with arrows pointing at them represent numbers that exactly match the number of rows in a single partition.
The remaining threads have exactly the same row counts across versions.
Fifteen Partitions
The results here show mostly the same pattern as before, so I’m keeping it short.
CREATE PARTITION FUNCTION VoteYear16_pf(DATETIME)
    AS RANGE RIGHT FOR VALUES
    (
        '20080101',
        '20080601',
        '20090101',
        '20090601',
        '20100101',
        '20100601',
        '20110101',
        '20110601',
        '20120101',
        '20120601',
        '20130101',
        '20130601',
        '20140101',
        '20140601'
    );
GO
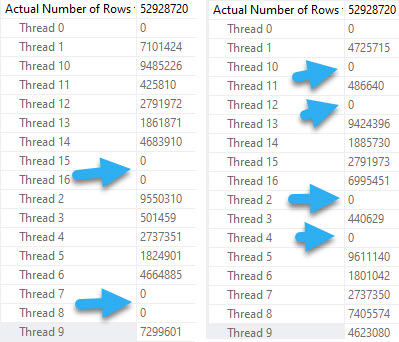
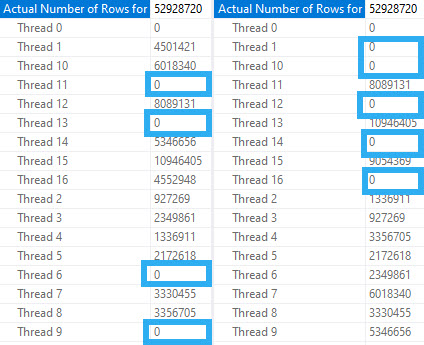
At DOP 4 and 8, threads work cooperatively across partitions. Where things get interesting (sort of) is at DOP 16.
craptastic
The four empty partitions here result in 4 threads doing no work in Developer/Enterprise Edition, and 5 threads doing no work in Standard Edition.
donkey
At first, I thought this might be a crack in the case, so I did things a little bit differently. In a dozen or so runs, the 5 empty threads only seemed to occur in the Standard Edition query. Sometimes it did, sometimes it didn’t. But it was at least something.
Fifteen Partitions, Mostly Empty
I used the same setup as above, but this time I didn’t fully load data from Votes in:
INSERT dbo.Votes16e_p WITH(TABLOCK)
    (Id, PostId, UserId, BountyAmount, VoteTypeId, CreationDate)
SELECT v.Id,
       v.PostId,
       v.UserId,
       v.BountyAmount,
       v.VoteTypeId,
       v.CreationDate
FROM dbo.Votes AS v
WHERE v.CreationDate >= '20130101';
And… Scene!
flop
That’s Just Great
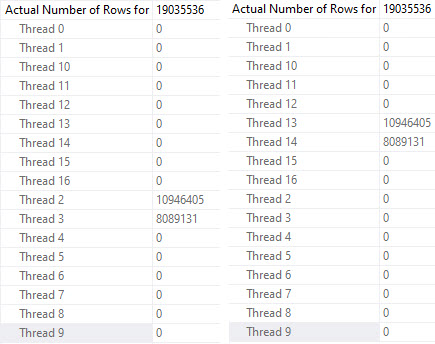
Aside from one case where an extra thread got zero rows in Standard Edition, the behavior across the board looks the same.
Most of the behavior is sensible, but cases where multiple threads get no rows and don’t move on to other partitions is a little troubling.
Not that anyone has partitioning set up right anyway.
Thanks for reading!
Going Further
If this is the kind of SQL Server stuff you love learning about, you’ll love my training. Blog readers get 25% off the Everything Bundle — over 100 hours of performance tuning content. Need hands-on help? I offer consulting engagements from targeted investigations to ongoing retainers. Want a quick sanity check before committing to a full engagement? Schedule a call — no commitment required.
There was a three-part series of posts where I talked about a weird performance issue you can hit with parameterized top. While doing some query tuning for a client recently, I ran across a funny scenario where they were using TOP PERCENT to control the number of rows coming back from queries.
With a parameter.
So uh. Let’s talk about that.
Setup Time
Let’s start with a great index. Possibly the greatest index ever created.
CREATE INDEX whatever
ON dbo.Votes
    (VoteTypeId, CreationDate DESC)
WITH
(
    MAXDOP = 8,
    SORT_IN_TEMPDB = ON
);
GO
Now let me show you this stored procedure. Hold on tight!
CREATE OR ALTER PROCEDURE dbo.top_percent_sniffer
(
    @top bigint,
    @vtid int
)
AS
SET NOCOUNT, XACT_ABORT ON;
BEGIN
    SELECT TOP (@top) PERCENT
        v.*
    FROM dbo.Votes AS v
    WHERE v.VoteTypeId = @vtid
    ORDER BY v.CreationDate DESC;

END;
Cool. Great.
Spool Hardy
When we execute the query, the plan is stupid.
EXEC dbo.top_percent_sniffer
    @top = 1,
    @vtid = 6;
GO
the louis vuitton of awful
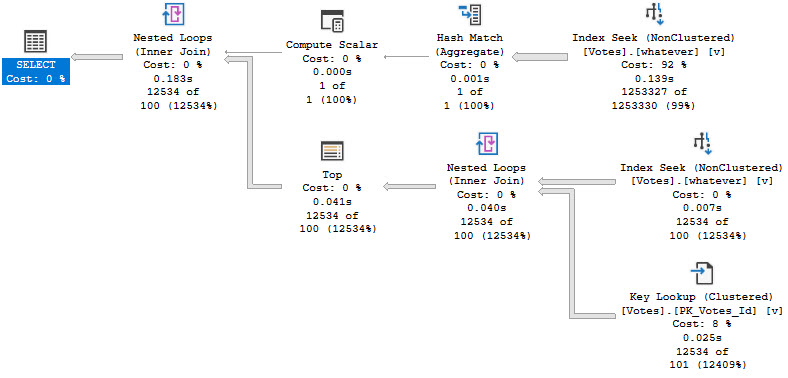
We don’t use our excellent index, and the optimizer uses an eager table spool to hold rows and pass the count to the TOP operator until we hit the correct percentage.
This is the least ideal situation we could possibly imagine.
Boot and Rally
A while back I posted some strange looking code on Twitter, and this is what it ended up being used for (among other things).
CREATE OR ALTER PROCEDURE dbo.top_percent_sniffer
(
    @top bigint,
    @vtid int
)
AS
SET NOCOUNT, XACT_ABORT ON;
BEGIN;

    WITH pct AS
    (
        SELECT
            records =
                CONVERT(bigint,
                    CEILING(((@top * COUNT_BIG(*)) / 100.)))
        FROM dbo.Votes AS v
        WHERE v.VoteTypeId = @vtid
    )
    SELECT
        v.*
    FROM pct
    CROSS APPLY
    (
        SELECT TOP (pct.records)
            v.*
        FROM dbo.Votes AS v
        WHERE v.VoteTypeId = @vtid
        ORDER BY v.CreationDate DESC
    ) AS v;

END;
GO
better butter
Soul Bowl
This definitely has drawbacks, since the expression in the TOP always gives a 100 row estimate. For large numbers of rows, this plan could be a bad choice and we might need to do some additional tuning to get rid of that lookup.
There might also be occasions when using a column store index to generate the count would be benefit, and the nice thing here is that since we’re accessing the table in two different ways, we could use two different indexes.
But for reliably small numbers of rows, this is a pretty good solution.
Thanks for reading!
Going Further
If this is the kind of SQL Server stuff you love learning about, you’ll love my training. Blog readers get 25% off the Everything Bundle — over 100 hours of performance tuning content. Need hands-on help? I offer consulting engagements from targeted investigations to ongoing retainers. Want a quick sanity check before committing to a full engagement? Schedule a call — no commitment required.
In this video, I delve into the often misunderstood world of table variables in SQL Server, exploring their uses and benefits, particularly when dealing with high concurrency and frequent execution. Using a series of stored procedures to test both temp tables and table variables, I demonstrate how these objects perform under stress using RML Utilities’ O Stress tool. The results show that while temp tables can lead to significant contention and slower performance due to their serialization issues, table variables shine in scenarios requiring quick, parallel query execution. This video aims to provide clarity on when it’s appropriate to use table variables over other temporary storage options, highlighting the importance of choosing the right tool for the job based on your specific workload requirements.
Full Transcript
Erik Darling here with Erik Darling Data, named one of the top 1001 sexiest SQL Server consulting companies in the world by BeerGut Magazine. And on this lovely Sunday, and it is Sunday, and so am I, I am enjoying a GinFizz of sorts. Mmm. Mmm. What a delicacy. Today we’re going to talk about when you should use table variables. Table variables get sort of an understandably bad rap for a lot of reasons. You know, you get the forced serialization when you modify them, you get the crappy estimates unless you recompile or throw some hokey trace flags at them. You get the the, um, what do you call it? What was the other one? There was another good one I had. Oh yeah. SQL Server has no idea what’s in them. Not only does it have no idea how much is in them, but it has no idea what the contents of that much is. And that’s not good. Often not good when we care about things like queries that have good cardinality estimates and perform well and plan shape makes a, makes a huge difference. But, uh, they’re there for a reason. They, they do not exist just to make consultants money finger wagging at you. Poor people who are there for a reason. They do not exist just to make consultants money finger wagging at you. Poor people who are there for a reason. They do not exist just to make consultants money finger wagging at you.
Who, who, who keep using them for no particular reason. Uh, they do exist for a good reason. And, uh, I’ve, I’ve talked a little bit about how they help when you, uh, have very high frequency execution for queries. Uh, but what I didn’t explore then was, uh, what happens when you also have very high concurrency along with the high frequency execution. And that’s what we’re going to look at today. Now I am going to use a, uh, a couple store procedures. that I used, uh, in the past to look at how these two different types of objects perform. Uh, one of them is a temp table test. And, um, you know, I know it’s not maximally, maximally realistic, but that’s fine. Cause all it has to do is show you behavior. Not everything is going to be a hundred percent true to life, real world. This is what happened demo this, but it just shows you what happens in the real world when you use different objects for different purposes. And this is the whole point. Thanks for watching. I’m just going to leave now, go enjoy my, my gin fizz. So this, uh, this one here is a temp table tester and we create a temp table. I don’t know how I missed a semi colon. There’s a sloppy of me. It’s been gone. It’s going to kill me next time I see him and I get assassinated. Uh, actually no, it’s not even my fault. Cause I, I use SQL prompt and I hit, uh, insert semi colons. And I don’t know what, what was going on with that. I don’t know. Maybe SQL prompt is dumb, but all this does is create a temp table. Uh, insert into the temp table and then we’re done with it. Uh, this one down here, look, see this, the semi colons here. I don’t know what, what the H E double, double doglegs happened.
No, but this one declares a table variable and then does the exact same thing. Now, of course, we have to pass something in to these store procedures and, uh, I don’t want to have to do that in a weird way. So what I did is I wrote a wrapper store procedure, uh, for, for these things. And, uh, it’s called the temp test wrapper. You know, I’ll have all this code somewhere. I mean, probably, probably in the blog post. I’m not going to stick all the code in the YouTube description. That’s annoying.
Uh, but it’ll be, it’ll, it’ll accompany the blog post along with some links to other things that I’ve written about table variables in the past. Uh, including the miraculous video where I, I test running these store procedures in a loop. Won’t that be fun for you? Uh, so yeah, so this thing, uh, declares a, uh, declares a variable and, uh, we set that variable to some random number between, uh, uh, one and the max ID in the post database, which is first exact overflow 2013 is currently 2119501.
In case you had trouble reading that number. And then, uh, you know, with the test procedure is, oh, you know, uh, temp, temp table test, then we’ll run temp table test. And if the test proc that we pass in up here is that, then we’ll run that. And I guess I should, I mean, I don’t really need to make it unicode. I guess I, I guess I should for completeness, right?
And make sure I don’t go against any of my, any of my own best practices mismatching data types. Not that this is going to matter, but whatever. I don’t want to get hoisted by my own petard or whatever that’s called unitard. Um, but you know, if we run these things, we get query plans turned on over here.
If we, uh, if we test these things out and run them, uh, we will get an execution plan that, uh, accurately portrays what we wanted to do. We have an insert into our pound sign temp table and then insert into our at sign table variable. We are all good. So what I’m going to do next is run use O stress from the lovely and talented RML utilities.
And I’m going to use that to, uh, run a bunch of concurrent threads 1000 times. So 300 sessions for 1000 iterations. And I just want to make a lot of busy work for the server. There’s no other point to it. Just plain busy work.
And let’s go over here and let’s, uh, plug that into. Oh, stress and get off that off and running. And let’s come over to here to SP who is active.
And we’re going to use this get task info parameter to get, uh, additional weight stat information. We see a whole bunch of page latch EX weights. And if we run this a whole bunch of times, uh, that’s what we’re just going to see piling up, right? Maybe they’re not terribly long.
Maybe this is no, not the worst, but you know, we can obviously see the, the tempDB contention occurring. We can see SQL Server trying to figure out where to put stuff, where things go, where do you belong? Um, I don’t know.
I don’t know where to go anymore. So if we keep running this, we’re just going to keep seeing it, right? It’s obvious signs of contention. Now, if, uh, we have code where it matters that, uh, that like, you know, what, what we’re putting into our, our temp table, we might just have to deal with some of that contention.
We might just have to, you know, live with it because we might need some of the, uh, the benefits of temp tables that table variables don’t have. You can put data into them in a, in a parallel query. You can, uh, you can create indexes on them that actually make a big difference because, you know, you get statistical information, you get all accurate.
Well, I mean, you know, usually accurate row counts. So there are some, you know, kind of iffies around, um, uh, temp tables getting cached and stored procedures. But as I always say, if that is your biggest problem, you should just go on vacation and find a new job where you will have interesting problems to solve again. Uh, but if you look, that whole thing took about 40 seconds to complete.
39.368, which is close enough to 40 for me. And I’m going to order a 40 later in remembrance of this fine demo. Uh, but next let’s go and look at table variables.
All right. Let’s, for good luck, we’re going to clear that out. And now we’re going to run the table variable version. Come back over here and let’s start running who is active.
And we’ll start seeing that wait info column. It doesn’t have anything in it. We’re not really waiting on anything. And, uh-oh, we’re done in eight seconds. So, if we were measuring this workload, right?
And I know it’s not the most realistic thing in the world, but, you know, let’s just say you have a lot of user sessions that come in, do something quick, and get out. So, well, if, you know, the idea is to make those user sessions as quick as possible because you don’t want them hanging around doing things, well, then we need to maybe consider the type of temporary object that we’re using to push those queries through. So, table variables do have very good uses in this case.
In this case, you know, we had an 8.3 second workload versus, what was that, almost 40 seconds if I’m remembering correctly. And I should remember correctly because now I have to order a 40 later and remembrance of that fine query. So, I’ll let you know how that smells in another video.
So, anyway, you know, table variables do get a lot of flack, and rightly so. They have probably messed up performance for people more times than they have solved a big performance problem. But this is a case where I would absolutely use one.
It’s a little bit of a niche case, but there are definitely industries, and there are definitely workloads where this kind of thing is, you know, the norma. The norma. The normal.
The norma. This is the norma gene. But, yeah, if you have that type of workload where you have very, very high frequency execution, and you need to push a bunch of tiny little queries through very, very quickly, table variables just might be the solution for you.
Now, of course, like, you know, one step further is, you know, the in-memory table variable, which I blogged about recently. I suppose I should put a link to that somewhere, too. I don’t know where it’s going to end up, though.
I don’t like to make promises about putting things in the YouTube description because quite often I forget. And I’m bad about remembering to go back and do it until someone leaves a comment and says, Hey, you said you were going to put this in the thing, and then you didn’t.
I’m like, yeah, sorry. Happens to me all the time. I’m forgetful. That’s why I blog a lot and record videos so I can remember. I don’t have to remember.
Anyway, I’m going to get back to my gin fizz and my Sunday because I am Sunday. And I will see you in another video another time. Thank you for watching.
Going Further
If this is the kind of SQL Server stuff you love learning about, you’ll love my training. Blog readers get 25% off the Everything Bundle — over 100 hours of performance tuning content. I’m also available for consulting if you just don’t have time for that and need to solve performance problems quickly.
USE StackOverflow2013;
EXEC dbo.DropIndexes;
SET NOCOUNT ON;
DBCC FREEPROCCACHE;
GO

CREATE INDEX whatever
ON dbo.Posts
    (OwnerUserId)
INCLUDE
    (Score);
GO

CREATE OR ALTER PROCEDURE dbo.TempTableTest (@Id INT)
AS
BEGIN
SET NOCOUNT, XACT_ABORT ON;

    CREATE TABLE #t(i INT NOT NULL);

    INSERT
        #t ( i )
    SELECT
        p.Score
    FROM dbo.Posts AS p
    WHERE p.OwnerUserId = @Id;

END;
GO

CREATE OR ALTER PROCEDURE dbo.TableVariableTest (@Id INT)
AS
BEGIN
SET NOCOUNT, XACT_ABORT ON;

    DECLARE @t TABLE (i INT NOT NULL);

    INSERT
        @t ( i )
    SELECT
        p.Score
    FROM dbo.Posts AS p
    WHERE p.OwnerUserId = @Id;

END;
GO


CREATE OR ALTER PROCEDURE dbo.TempTestWrapper (@TestProc sysname)
AS
BEGIN
SET NOCOUNT, XACT_ABORT ON;

DECLARE @rando int =
    ((ABS(CHECKSUM(NEWID())) % 21195018) + 1); /*this is the max id in posts for SO2013*/

IF @TestProc = N'TempTableTest'
    BEGIN
        EXEC dbo.TempTableTest @rando;
    END;

IF @TestProc = N'TableVariableTest'
    BEGIN
        EXEC dbo.TableVariableTest @rando;
    END;

END;
GO

/*Testing*/
EXEC dbo.TempTestWrapper @TestProc = 'TempTableTest';
EXEC dbo.TempTestWrapper @TestProc = 'TableVariableTest';

/*

ostress -SSQL2019S -d"StackOverflow2013" -Q"EXEC dbo.TempTestWrapper @TestProc = 'TempTableTest';" -U"ostress" -P"ostress" -q -n300 -r1000 -o"C:\temp\crap"

ostress -SSQL2019S -d"StackOverflow2013" -Q"EXEC dbo.TempTestWrapper @TestProc = 'TableVariableTest';" -U"ostress" -P"ostress" -q -n300 -r1000 -o"C:\temp\crap"

*/
When I’m blogging about performance tuning, most of it is from the perspective of Enterprise Edition. That’s where you need to be if you’re serious about getting SQL Server to go as fast as possible. Between the unrealistic memory limits and other feature restrictions, Standard Edition just doesn’t hold up.
Sure, you can probably get by with it for a while, but once performance becomes a primary concern it’s time to fork over an additional 5k a core for the big boat.
They don’t call it Standard Edition because it’s The Standard, like the hotel. Standard is a funny word like that. It can denote either high or low standing through clever placement of “the”. Let’s try an experiment:
Erik’s blogging is standard for technical writing
Erik’s blogging is the standard for technical writing
Now you see where you stand with standard edition. Not with “the”, that’s for sure. “The” has left the building.
Nerd Juice
A lot of the restrictions for column store in Standard Edition are documented, but:
DOP limit of two for queries
No parallelism for creating or rebuilding indexes
No aggregate pushdown
No string predicate pushdown
No SIMD support
Here’s a comparison for creating a nonclustered column store index in Standard and Enterprise/Developer Editions:
your fly is down
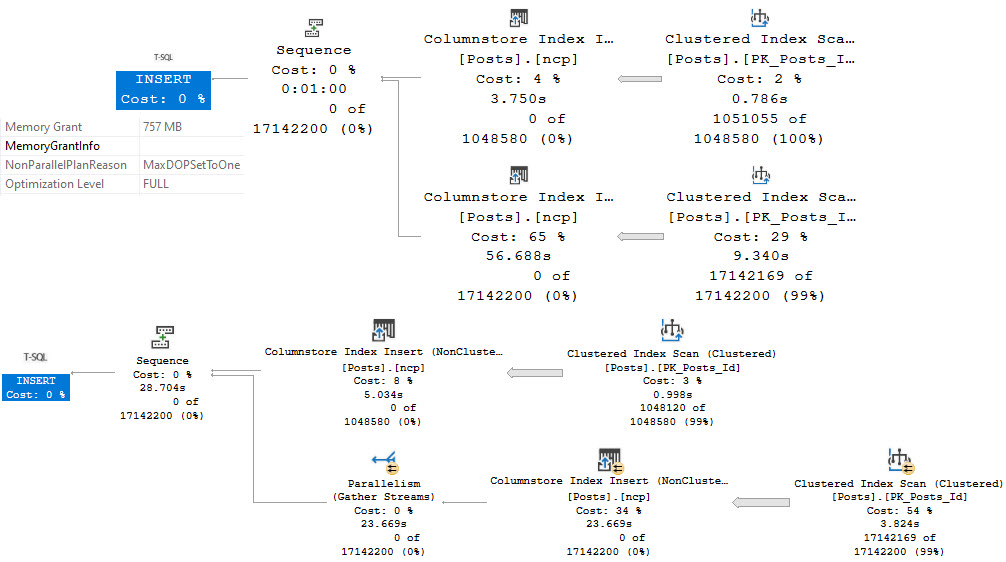
The top plan is from Standard Edition, and runs for a minute in a full serial plan. There is a non-parallel plan reason in the operator properties: MaxDOPSetToOne.
I do not have DOP set to one anywhere, that’s just the restriction kicking in. You can try it out for yourself if you have Standard Edition sitting around somewhere. I’m doing all my testing on SQL Server 2019 CU9. This is not ancient technology at the time of writing.
The bottom plan is from Enterprise/Developer Edition, where the the plan is able to run partially in parallel, and takes 28 seconds (about half the time as the serial plan).
Query Matters
One of my favorite query tuning tricks is getting batch mode to happen on queries that process a lot of rows. It doesn’t always help, but it’s almost always worth trying.
The problem is that on Standard Edition, if you’re processing a lot of rows, being limited to a DOP of 2 can be a real hobbler. In many practical cases, a batch mode query at DOP 2 will end up around the same as a row mode query at DOP 8. It’s pretty unfortunate.
In some cases, it can end up being much worse.
SELECT
    MIN(p.Id) AS TinyId,
    COUNT_BIG(*) AS records
FROM dbo.Posts AS p WITH(INDEX = ncp)
JOIN dbo.Votes AS v
    ON p.Id = v.PostId
WHERE p. OwnerUserId = 22656;

SELECT
    MIN(p.Id) AS TinyId,
    COUNT_BIG(*) AS records
FROM dbo.Posts AS p WITH(INDEX = 1)
JOIN dbo.Votes AS v
    ON p.Id = v.PostId
WHERE p. OwnerUserId = 22656;
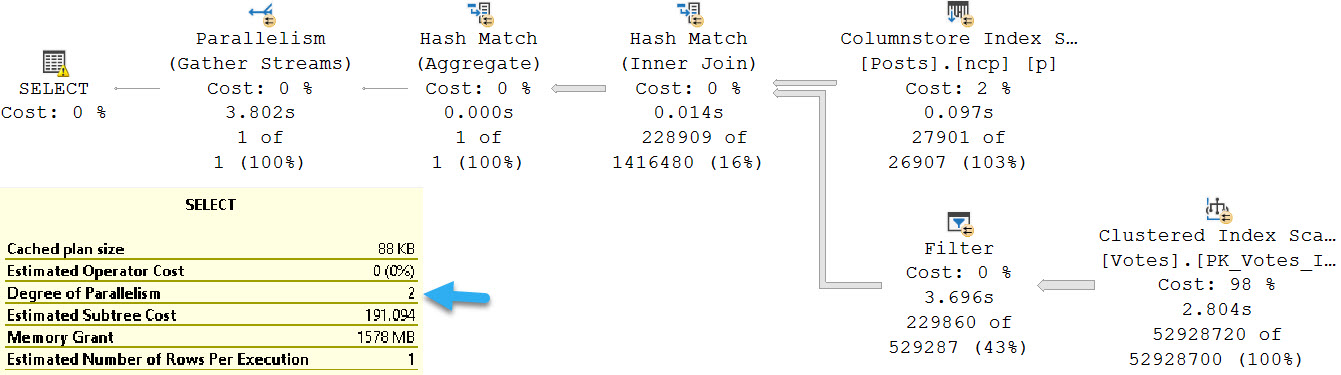
Here’s the query plan for the first one, which uses the nonclustered column store index on Posts. There is no hint or setting that’s keeping DOP at 2, this really is just a feature restriction.
drop it like it’s dop
Higher Ground
The second query, which is limited by the MAXDOP setting to 8, turns out much faster. The batch mode query takes 3.8 seconds, and the row mode query takes 1.4 seconds.
it’s a new craze
In Enterprise Edition, there are other considerations for getting batch mode going, like memory grant feedback or adaptive joins, but those aren’t available in Standard Edition.
In a word, that sucks.
Dumb Limit
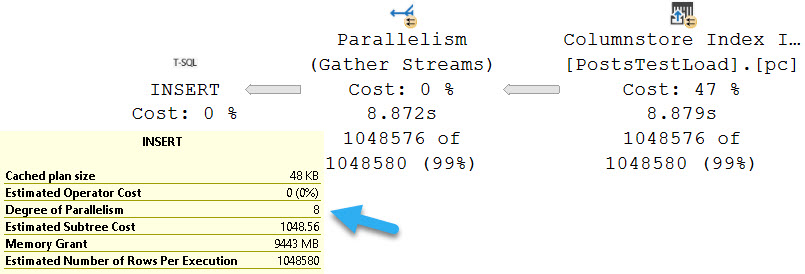
The restrictions on creating and rebuilding column store indexes to DOP 1 (both clustered and nonclustered), and queries to DOP 2 all seems even more odd when we consider that there is no restriction on inserting data into a table with a column store index on it.
As an example:
SELECT
    p.*
INTO dbo.PostsTestLoad
FROM dbo.Posts AS p
WHERE 1 = 0;

CREATE CLUSTERED COLUMNSTORE INDEX pc ON dbo.PostsTestLoad;

SET IDENTITY_INSERT dbo.PostsTestLoad ON;

INSERT dbo.PostsTestLoad WITH(TABLOCK)
(
    Id, AcceptedAnswerId, AnswerCount, Body, ClosedDate,
    CommentCount, CommunityOwnedDate, CreationDate,
    FavoriteCount, LastActivityDate, LastEditDate,
    LastEditorDisplayName, LastEditorUserId, OwnerUserId,
    ParentId, PostTypeId, Score, Tags, Title, ViewCount
)
SELECT TOP (1024 * 1024)
    p.Id, p.AcceptedAnswerId, p.AnswerCount, p.Body, p.ClosedDate, p.
    CommentCount, p.CommunityOwnedDate, p.CreationDate, p.
    FavoriteCount, p.LastActivityDate, p.LastEditDate, p.
    LastEditorDisplayName, p.LastEditorUserId, p.OwnerUserId, p.
    ParentId, p.PostTypeId, p.Score, p.Tags, p.Title, p.ViewCount
FROM dbo.Posts AS p;

SET IDENTITY_INSERT dbo.PostsTestLoad OFF;
smells like dop spirit
Unsupportive Parents
These limits are asinine, plain and simple, and I hope at some point they’re reconsidered. While I don’t expect everything from Standard Edition, because it is Basic Cable Edition, I do think that some of the restrictions go way too far.
Perhaps an edition somewhere between Standard and Enterprise would make sense. When you line the two up, the available features and pricing are incredibly stark choices.
There are often mixed needs as well, where some people need Standard Edition with fewer HA restrictions, and some people need it with fewer performance restrictions.
Thanks for reading!
Going Further
If this is the kind of SQL Server stuff you love learning about, you’ll love my training. Blog readers get 25% off the Everything Bundle — over 100 hours of performance tuning content. Need hands-on help? I offer consulting engagements from targeted investigations to ongoing retainers. Want a quick sanity check before committing to a full engagement? Schedule a call — no commitment required.
A lot has been written about dynamic SQL over the years, but I ran into a situation recently where I needed to rewrite some code that needed it with minimal disruption to other parts of a stored procedure.
The goal was to set a bunch of variables equal to column values in a table, but the catch was that some of the values that needed to be set also needed to be passed in as search arguments. Here’s a really simplified example:
DECLARE
    @i int = 4,
    @s nvarchar(MAX) = N'';

SET
    @s += N'
SELECT TOP (1)
    @i = d.database_id
FROM sys.databases AS d
WHERE d.database_id > @i
ORDER BY d.database_id;
'
EXEC sys.sp_executesql
    @s,
  N'@i INT OUTPUT',
    @i OUTPUT;

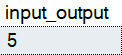
SELECT
    @i AS input_output;
The result is this:
sinko
All Points In Between
Since we declare @i outside the dynamic SQL and set it to 4, it’s known to the outer scope.
When we execute the dynamic SQL, we tell it to expect the @i parameter, so we don’t need to declare a separate holder variable inside.
We also tell the dynamic SQL block that we expect to output a new value for @i.
While we’re also passing in @i as a parameter.
Mindblowing.
Thanks for reading!
Going Further
If this is the kind of SQL Server stuff you love learning about, you’ll love my training. Blog readers get 25% off the Everything Bundle — over 100 hours of performance tuning content. Need hands-on help? I offer consulting engagements from targeted investigations to ongoing retainers. Want a quick sanity check before committing to a full engagement? Schedule a call — no commitment required.
Way back when, SQL Servers with lots of cores could hit some weird contention on CMEMTHREAD. To fix that and a lot of other issues associated with running on a large server, people would resort to all sorts of trace flags.
My dear friend L_____ (b|t) has a list. Maybe not the most up to date list, but there are a lot of good references in the post.
Something we’ve both observed working with large servers is that Trace Flag 8048 might still be necessary under some circumstances.
If you’re running a large server, this trace flag may still be of value even after SQL Server 2016.
Thanks for reading!
Going Further
If this is the kind of SQL Server stuff you love learning about, you’ll love my training. Blog readers get 25% off the Everything Bundle — over 100 hours of performance tuning content. Need hands-on help? I offer consulting engagements from targeted investigations to ongoing retainers. Want a quick sanity check before committing to a full engagement? Schedule a call — no commitment required.