But weird things can happen along the way, especially if you don’t have supporting indexes, or if supporting indexes aren’t chosen by the optimizer for various reasons.
In this post, I’m going to show you a query plan pattern that can occur in semi-join plans, and what you can do about it.
Row Goalies
This can happen without a TOP in the query, I’m only using it because it gets me the plan shape I care about quickly, and returns results “quickly” enough.
SELECT TOP (1)
    c.*
FROM dbo.Comments AS c
WHERE NOT EXISTS
(
    SELECT
        1/0
    FROM dbo.Votes AS v
    WHERE c.PostId = v.PostId
)
ORDER BY c.CreationDate DESC;
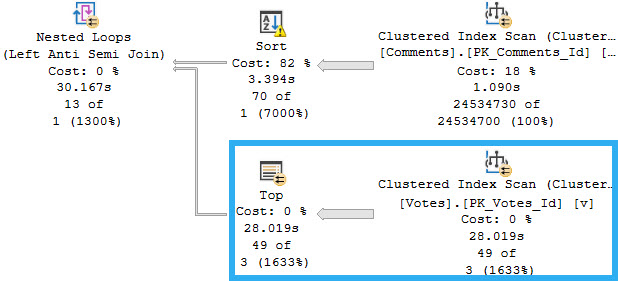
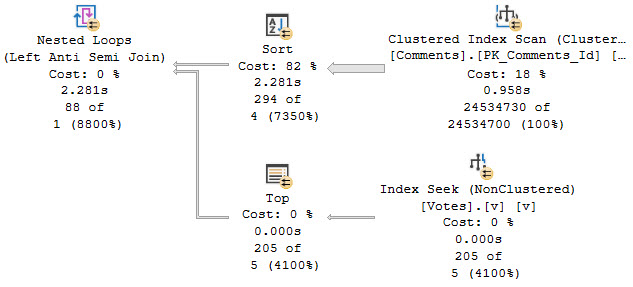
The part of the plan that we care about is on the inner side of the semi join, where the TOP is applied in a funny way.
just party
This is a very good example of where query costing can be quite off. The part of the plan that is responsible for most of the runtime is estimated to cost 0% of the total cost.
Closer
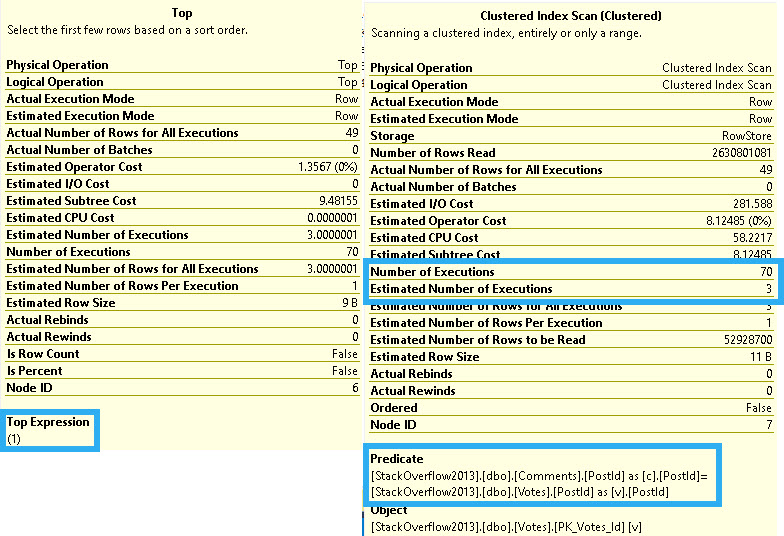
Here’s what’s going on in those two operators!
rock show
The optimizer thinks it can find a matching row in three executions, but it takes 70.
It also takes reading 2,630,801,081 rows to return 49 rows. There are 52,928,700 rows in the table.
Yes, if you multiply 52928700 * 49 = 2630801081. Technically it’s 49.7, but the plan shows rounded numbers. Close enough for the optimizer, so they say.
Index Not Exists
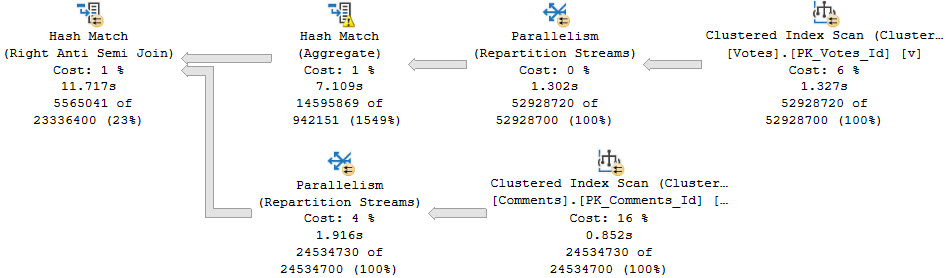
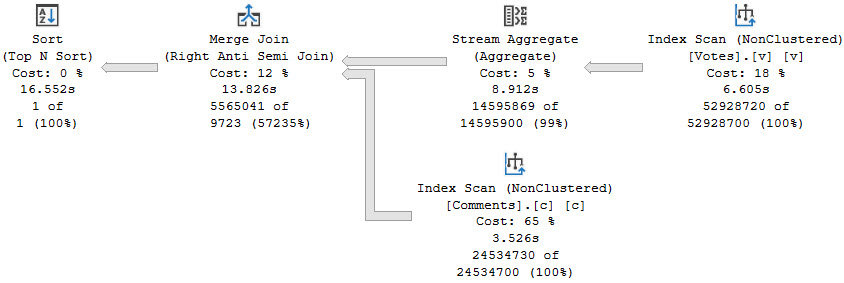
Without an index, a hash join plan would have been a much better option, which we can get by adding an OPTION(HASH JOIN) hint to the query.
freeloader
While ~12 seconds is great, we can do better. I’ve heard about these things called indexes.
How do we indexes?
An Index, You Say
It looks straight forward to create an index that should get us the plan we want, if we create it on the PostId column on the Votes table.
CREATE INDEX v ON dbo.Votes(PostId);
Assuming that the plan shape otherwise stays the same, we’ll scan the Comments table, Sort by PostId, and then do a Seek into the Votes table on the inner side of the join.
Right?
wrong
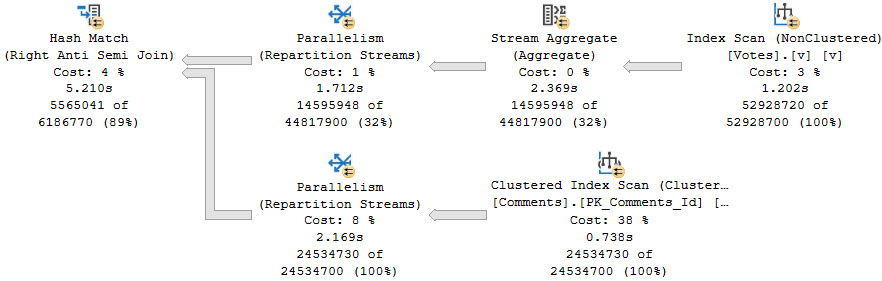
While it is quite a bit faster, it’s not at all what we want. And hey, look, the costs and times here are all screwy again.
Stop looking at costs.
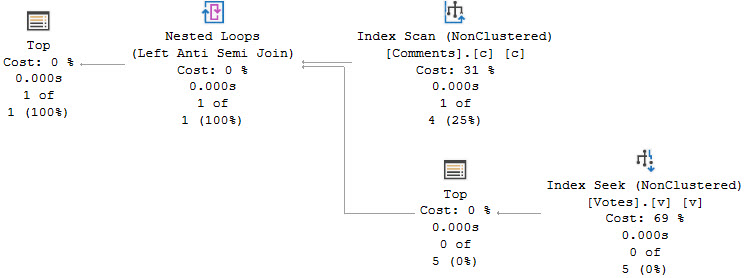
Adding a FORCESEEK hint gets us the plan shape we care about, of course:
SELECT TOP (1)
    c.*
FROM dbo.Comments AS c
WHERE NOT EXISTS
(
    SELECT
        1/0
    FROM dbo.Votes AS v WITH(FORCESEEK)
    WHERE c.PostId = v.PostId
)
ORDER BY c.CreationDate DESC;
Along with a much faster runtime:
premium tears
Gosh Wrong
If you’re keeping score at home, the optimizer chose:
A TOP > Scan that took 30 seconds instead of a Hash Join that took 11 seconds
A Hash Join that took 5.2 seconds instead of a Top > Seek that took 2.2 seconds
But I bet I know what you’re thinking. We need an index on the Comments table. And I bet you’re thinking it should look something like this:
CREATE INDEX c ON dbo.Comments
    (PostId, CreationDate)
INCLUDE
    (Score, UserId, Text);
But, prepare you biggest internet sigh, that just won’t work out.
and tears
Much like above, if we add a FORCESEEK hint, we get a better/faster plan that looks a lot like the plan above.
Flip That Script
The only index that gets us a respectable execution plan without a bunch of hints is this one:
CREATE INDEX c ON dbo.Comments
    (CreationDate, PostId)
INCLUDE
    (Score, UserId, Text);
Which gets us this execution plan:
what i want
Thanks for reading!
Going Further
If this is the kind of SQL Server stuff you love learning about, you’ll love my training. Blog readers get 25% off the Everything Bundle — over 100 hours of performance tuning content. Need hands-on help? I offer consulting engagements from targeted investigations to ongoing retainers. Want a quick sanity check before committing to a full engagement? Schedule a call — no commitment required.
This is one of my least favorite query patterns, because even with appropriate indexes, performance often isn’t very good without additional interventions.
Without indexes in place, or when “indexes aren’t used”, then the query plans will often look like one of these.
Maybe not always, but there are pretty common.
Merge Interval
SELECT
    COUNT_BIG(*) AS records
FROM dbo.Users AS u
JOIN dbo.Posts AS p
    ON (p.OwnerUserId = u.Id
        OR p.LastEditorUserId = u.Id);
here comes the pain
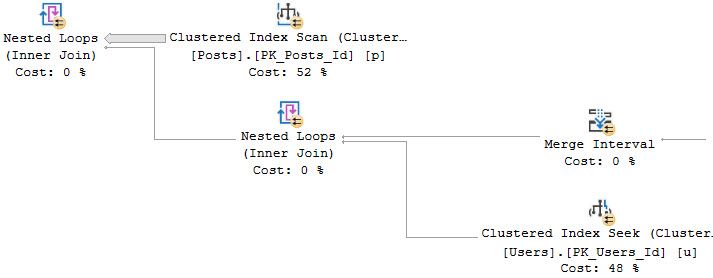
We start off with a scan of the Posts table, and a Nested Loops Join to a… Nested Loops Join? That’s weird.
work it
From the Merge Interval to the right, there’s a lot of additional operators. Those two Constant Scan operators represent virtual tables containing the two columns from Posts being used in the join.
One for OwnerUserId, and one for LastEditorUserId. The Sort and Merge interval are a pseudo-attempt at ordering the concatenated results and removing duplicate ranges. I don’t think I’ve ever seen them be terribly effective.
This plan takes on this shape because the Users table has a seekable index on the Users table on the Id column.
Loops and Lazy Spools
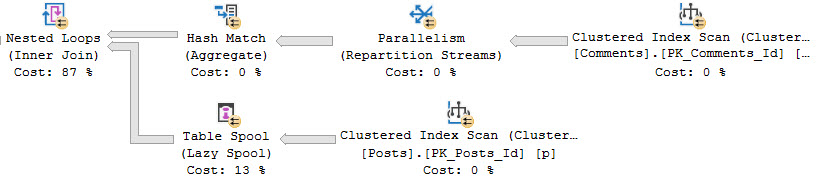
With no usable indexes on either side, the plan will often take on a shape like this.
SELECT
    COUNT_BIG(*) AS records
FROM dbo.Comments AS c
JOIN dbo.Posts AS p
    ON (p.OwnerUserId = c.UserId
        OR p.LastEditorUserId = c.UserId);
rebort
This is an admittedly weird plan. Weird because usually when there’s a Lazy Spool on the inner side of a Nested Loops Join, there’s some Sorting of data on the outer side.
The Nested Loops Join here is not Optimized, and does not do an Ordered Prefetch. It’s odd to me that the Hash Match Aggregate on the outer side isn’t a Sort > Stream Aggregate.
This is usually done to maximize the Spool’s efficiency, and cut down on the Spool needing to execute child operators.
For example, let’s say the numbers 1 through 10 came out of the Comments table, and there were 10 of each. If they were in order, the Spool would initially fill with the values from Posts for 1, and then the contents of the Spool would get used for the next 9 duplicate values of 1.
The process would repeat for the rest of the numbers, with the Spool truncating itself when it sees a new value.
Let’s Add Indexes
You may have noticed that I’ve only been using estimated plans up until now. That’s because both of these queries run way too slowly to deal with actual plans for.
The optimal indexes we need to make that not the case any more look like this:
CREATE INDEX po
ON dbo.Posts
    (OwnerUserId);

CREATE INDEX pl
ON dbo.Posts
    (LastEditorUserId);

CREATE INDEX cu
ON dbo.Comments
    (UserId);
ORnery
If we don’t change the queries at all, both plans will use the Merge Interval shape. It’s only somewhat beneficial to the Users/Posts query, which now finishes in about 40 seconds. The Comments/Posts query runs for… I dunno. I let it go for three hours and my CPUs were maxed out the whole time and things got unusable.
If you’re going to leave the OR in, you need to use a FORCESEEK hint. More specifically, you need to use the hint on the table that has different columns in the OR clause. Otherwise, the plan shape goes all to crap (Merge Interval).
SELECT
    COUNT_BIG(*) AS records
FROM dbo.Users AS u
JOIN dbo.Posts AS p WITH(FORCESEEK)
    ON (p.OwnerUserId = u.Id
        OR p.LastEditorUserId = u.Id);
GO

SELECT
    COUNT_BIG(*) AS records
FROM dbo.Comments AS c
JOIN dbo.Posts AS p WITH(FORCESEEK)
    ON (p.OwnerUserId = c.UserId
        OR p.LastEditorUserId = c.UserId);
GO
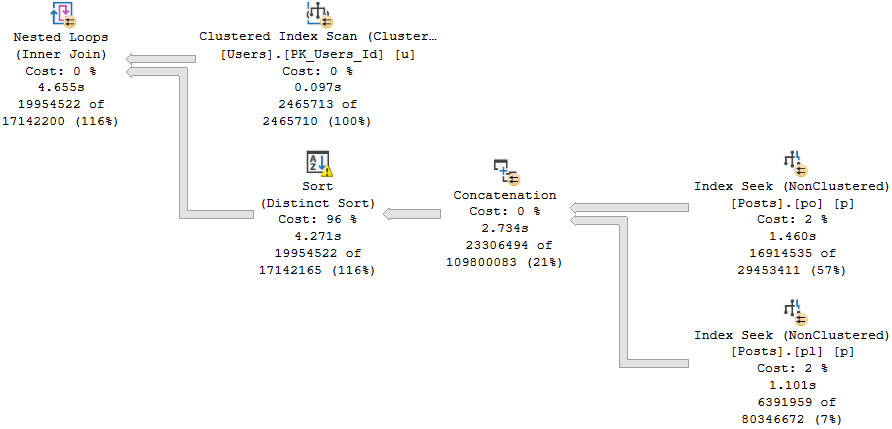
With that hint in place, both queries will take on a similar, non-disastrous shape.
oh hey seeks
Both queries will take around 5 seconds.
Leaving The Or Out
The usually-better rewrite is to use UNION ALL to separate the OR out, especially if you don’t have good indexes in place.
With good indexes in place (like above), both benefit from the FORCESEEK hint as well
SELECT
    SUM(x.x) AS records
FROM
(
    SELECT
        COUNT_BIG(*) AS x
    FROM dbo.Comments AS c
    JOIN dbo.Posts AS p WITH(FORCESEEK)
        ON p.OwnerUserId = c.UserId

    UNION ALL

    SELECT
        COUNT_BIG(*) AS x
    FROM dbo.Comments AS c
    JOIN dbo.Posts AS p WITH(FORCESEEK)
        ON p.LastEditorUserId = c.UserId
    AND p.OwnerUserId <> c.UserId
) AS x;

SELECT
    SUM(x.x) AS records
FROM
(
    SELECT
        COUNT_BIG(*) AS x
    FROM dbo.Users AS u
    JOIN dbo.Posts AS p WITH(FORCESEEK)
        ON p.OwnerUserId = u.Id

    UNION ALL

    SELECT
        COUNT_BIG(*) AS x
    FROM dbo.Users AS u
    JOIN dbo.Posts AS p WITH(FORCESEEK)
        ON p.LastEditorUserId = u.Id
    AND p.OwnerUserId <> u.Id
) AS x;
Not All ORs
I am usually not a fan of OR predicates in JOINs. There often isn’t great indexing in place to make things fast, or support the FORCESEEK hints.
If you see query plans with these patterns in them, you should keep an eye out for them. You may have a pretty easy performance win on your hands, either via indexing and hints, or rewriting to a UNION ALL.
Thanks for reading!
Going Further
If this is the kind of SQL Server stuff you love learning about, you’ll love my training. Blog readers get 25% off the Everything Bundle — over 100 hours of performance tuning content. Need hands-on help? I offer consulting engagements from targeted investigations to ongoing retainers. Want a quick sanity check before committing to a full engagement? Schedule a call — no commitment required.
In this video, I delve into a peculiar performance issue I encountered while working with SQL Server 2019, specifically in version CU9. The problem arose when creating an index on a table and running a windowing function over it, leading to bizarre parallel query performance issues at DOPs up to eight cores. What made this issue even more intriguing was that the same query ran much faster with just one core, suggesting some form of internal contention or optimization hiccup. I explore various fixes, including running the query with a single thread, hinting the clustered index, adding an unnecessary ORDER BY clause, and using a non-clustered columnstore index as the data source. The issue seems to be unique to SQL Server 2019, as it hasn’t been observed on earlier versions like 2016 or 2017. If you’re dealing with similar windowing function issues in parallel queries on SQL Server 2019, this video might offer some insights and potential solutions.
Full Transcript
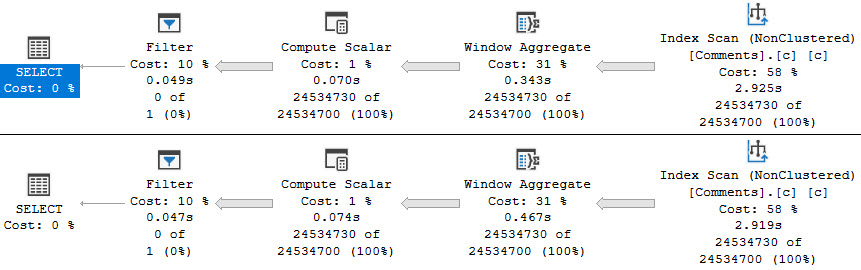
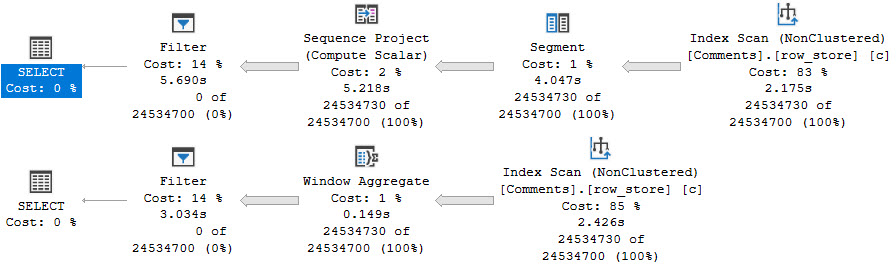
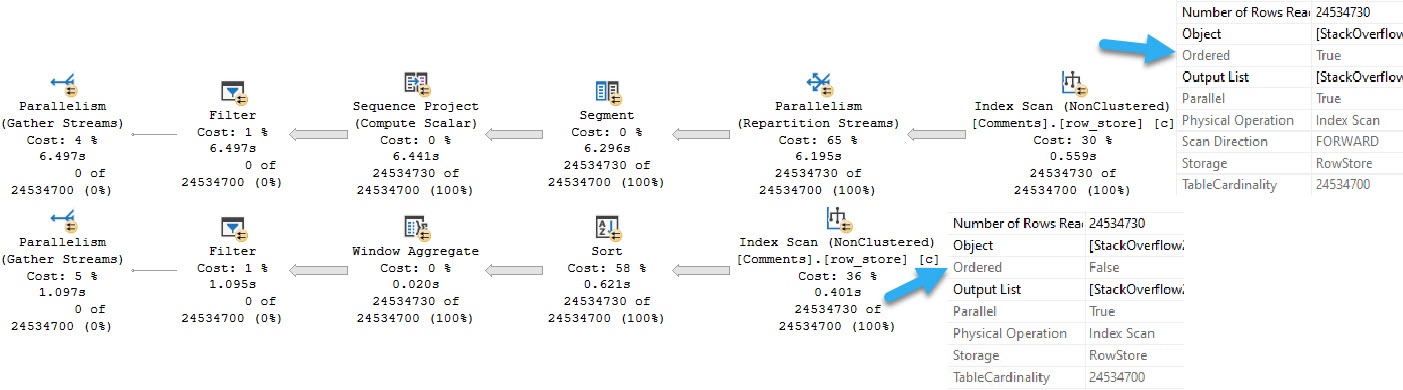
Erik Darling here with Erik Darling Data, a company recently voted least likely to be acquired by anyone by BeerGut Magazine. So I’m not sure how I feel about that, but okay. And anyway, today I want to talk about a very, very weird issue that I’ve been running into with SQL Server 2019. Now this is cumulative update 9. We are on the latest bits. The server has been rebooted many times at this point. There is nothing all that weird about my setup, and I’ve gotten this to repro in many different ways across many different servers. The only thing that seems to be a defining factor hardware-wise is that the server have at least more than eight cores in it. But you can repro it to some degree on other smaller CPU configurations, but anything over eight, this thing really seems to kick up. Now, the original issue that I ran into was I created an index on a table, and then I ran a windowing function over the table, and just with an over clause, nothing too weird in there. And it was weird, just bizarre performance when it went parallel. It happened at every DOP up to eight. I could put it up to DOP 16 and see the same problem, but you know, DOP 8 was kind of where the query was running originally. And what was even weirder was that it got completely fixed at DOP 1. And this is what the query plans end up looking like. Oops, shouldn’t have done that. You have this top query that goes parallel. And I mean, like, this was like a bad run. This is like a sort of like, actually, this is like in the middle of bad runs. Really bad runs were like 45, 50 seconds.
Like sort of like sort of like sort of like sort of like sort of like sort of like sort of like sort of like 15 and 30 seconds. This was like, you know, a little bit higher on the uptick. This is just the one that I happened to capture when I was thinking of it for the record this video. But you see the parallel version of this plan. We have an index scan that’s quick. We have a compute scalar that’s also quick. But then we have this window aggregate. And window aggregate happens in queries that use batch mode. This is batch mode on rowstore. But you could most likely see the same thing happen if you were to trick SQL Server into using batch mode either by, you know, left joining off to an empty temp table or something or whatever trick you want to use, creating an empty non-clustered columnstore index, you know, you name it.
There’s all sorts of things you could do in there that would trick the optimizer. But what gets really weird is that when we run that same query at top one, it is pretty quick, right? Like obviously the scan of the index over here is going to suffer because we’re scanning 25-ish million rows with a single thread.
That’s going to be slower. But the window aggregate finishes almost immediately. And this query runs, let’s go look at the time stats, properties, query time stats. So about 2.5 seconds there. But then up here, the parallel plan, well, this thing just gets the crap kicked out of it.
Like that’s just, yeah, I don’t know. I don’t know. I don’t claim to fully understand what’s happening behind the scenes. But that was sort of the deal there.
And like, you know, if we can just run this, runs quickly. Actually, that’s not going to run too quickly because that’s going to recompile and it’s going to spill a little bit on the first run. So this is going to look not so great. But then once memory adjusts because batch mode, this thing will run fairly quickly on the second go.
But, you know, this top eight query is always sort of suffering. And I’m not going to sit there and make you wait however long this thing might take to run. But that’s sort of what happens.
Now, what I did or what I was talking about this with some friends of mine. My friend Forrest said that you should look at spin locks during that period of time. And I said, you know what?
Forrest has never spin locks. I think it’s spin locks. So this was a, again, sort of a middle of the road run. This executed for about 37 seconds when this went off.
I didn’t grab a query plan for it because it was kind of useless in this case. But if we look during this 37 second window, this SOS suspend queue spin lock happened an extraordinary number of times. An extraordinary number of times in that window.
Now, of course, I don’t claim to know much about spin locks. So I went to look up what this spin lock meant. It said it was for internal use only. So I assume that I am never going to know what that means.
And I even had to go and steal the script from the lovely and talented Paul Randall. I will link to this in the YouTube notes. But there it is.
If you want to capture spin lock statistics for a period of time, aside from some mildly formatting that I did on things, this is the before and after of spin locks on my system when this thing runs at DOP 8. Now, I wanted to have some fixes for this. Or rather, I wanted to list out some of the things I found that had worked for this as far as fixing the issue goes.
Because I assume that if you stumble on this video, you might be running into the same problem. Or, you know, if you’re on SQL Server 2019 and using a lot of windowing functions, you should probably be aware of this until, I don’t know, maybe Microsoft fixes spin locks. I’m kidding, obviously.
But if you, if we, so like all sorts of things that I found that have fixed the issue. If we run the query at DOP 1, things finish very quickly. That’s all good there.
If we, what do you call it, hint the clustered index, we still face the issue to some degree. It’s much, much smaller for some reason. I don’t know if it’s something with the parallel page supplier or, you know, the size of the rows and the aggregate.
I just don’t, don’t really know offhand. And I don’t fully understand why going back to the clustered index works better than just going to the nonclustered index. And also, if we add a useless order by to the windowing function.
So here I just stuck an order by C dot score in there. The issue does not reproduce there. And finally, if we use a columnstore index, in this case non-clustered columnstore, as a data source, the issue also does not reproduce there.
So all sorts of things that potentially make this query faster or fix the issue with the spin locks, that seems to work there. This only seems to happen on SQL Server 2019. So far I haven’t gotten it to repro on SQL Server 2016 or 2017.
And if you want sort of a more generalized reproduction of this, there’s just, you know, if you create a temp table and stick a bunch of rows in it and, you know, do sort of the same query with the sum over, you know, whatever from that temp table, you can see the same sort of generalized pattern where, you know, you have a window aggregate in parallel that runs for a very long time. This will produce a whole bunch of those SOS spins. And then if you use the serial version of the plan, you will not run into the same performance issue.
Again, this query takes about 8.2 seconds in total. This query becomes batch mode, blah, blah, blah, takes about five seconds total. So definitely something interesting there.
I don’t know if this is something that requires some engineering fixes on Microsoft’s side or I don’t know, maybe I’ve just broken 15 different servers by running this demo there. But I spent last night and this morning spinning up cloud instances of various sizes between 16 and 96 cores. And so I’m going to have a bill to pay this month.
But it seemed to reproduce reliably on SQL Server 2019 on all of those. So if you’re on SQL Server 2019 and you have window aggregates in your execution plans that are going parallel, you might find some weird performance issues. Performance might be very variable or performance might be consistently bad.
Anyway, that’s all I had there. I’m going to go package these details up and send them to my friends who can fix these things. And hopefully in the next CU there will be far less spinlock contention when we have parallel batch mode window aggregates.
Well, I guess you couldn’t technically have a row mode window aggregate. That just wouldn’t be sensible, would it? No.
Anyway, thank you for watching. I hope you learned something. And I don’t know, it’s like 10 a.m. on a Tuesday. So it’s probably time for me to start thinking about what cocktail I’m going to have to get warmed up for lunch cocktails because it’s just around the corner. Don’t want to go into lunch cocktails too sober because you can really get ahead of yourself that way.
Anyway, yeah, that’s it. Thank you for watching. Goodbye.
I’m exhausted.
Going Further
If this is the kind of SQL Server stuff you love learning about, you’ll love my training. Blog readers get 25% off the Everything Bundle — over 100 hours of performance tuning content. Need hands-on help? I offer consulting engagements from targeted investigations to ongoing retainers. Want a quick sanity check before committing to a full engagement? Schedule a call — no commitment required.
Certain windowing functions allow you to specify more precise windows to perform calculations on, and many of them allow you to specify an empty OVER() clause to get a global aggregate for a result set.
The performance difference between RANGE and ROWS is fairly well-documented, and I’m mostly covering it here to show you the difference in execution plans.
There’s also some different behavior when Batch Mode shows up around memory usage, which I was amused by.
We’re going to be using this index to help our queries move along faster.
CREATE INDEX c
ON dbo.Comments
(
    UserId,
    CreationDate,
    Score
);
RANGEr Zone
If you don’t specify the type of window you want, by default you’ll use RANGE. I’m using it here to be clear about which I’m covering.
WITH Comments AS
(
    SELECT
        SUM(c.Score) OVER
        (
            PARTITION BY
                c.UserId
            ORDER BY
                c.CreationDate
            RANGE BETWEEN UNBOUNDED PRECEDING
                      AND CURRENT ROW
        ) AS n
    FROM dbo.Comments AS c
)
SELECT
    c.*
FROM Comments AS c
WHERE c.n < 0
OPTION(USE HINT('QUERY_OPTIMIZER_COMPATIBILITY_LEVEL_140'));
Even with an index to help us along, this query runs for a very long time. In fact it’s been running for the entire time I’ve been writing this particular blog post.
The longer it runs, the more space-filler I have to type, and the more post quality suffers. If this post is terrible, you can blame the above query. Or SQL Server.
Whatever.
Three minutes later:
cpu hound
In my experience, this is the query plan pattern that shows up when you use the RANGE/default specification.
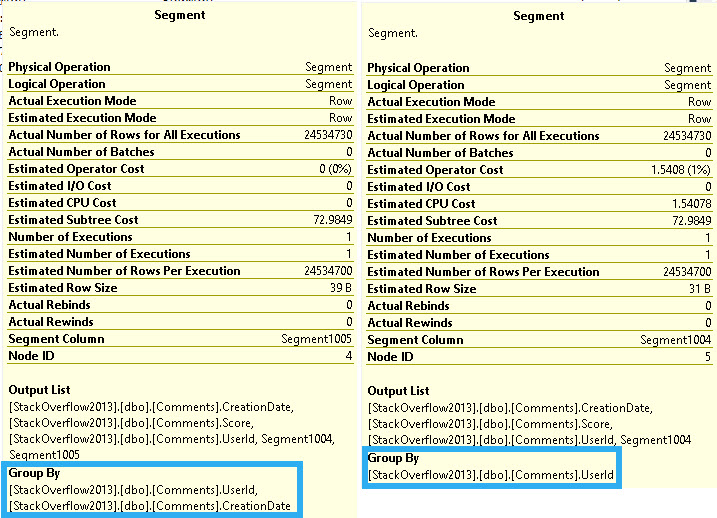
emergency
The first Segment is for the Partition By elements, and the second Segment is for both Partition By and Order By.
Depending on your ideas about our time on Earth, and the afterlife, this query could be considered a poor use of finite time.
ROW Boat
Switching over to the ROWS specification, performance is much different, and we get a different execution plan.
WITH Comments AS
(
    SELECT
        SUM(c.Score) OVER
        (
            PARTITION BY
                c.UserId
            ORDER BY
                c.CreationDate
            ROWS BETWEEN UNBOUNDED PRECEDING
                     AND CURRENT ROW
        ) AS n
    FROM dbo.Comments AS c
)
SELECT
    c.*
FROM Comments AS c
WHERE c.n < 0
OPTION(USE HINT('QUERY_OPTIMIZER_COMPATIBILITY_LEVEL_140'));
I only have to wait about 10 seconds for this one, with some efficiency gained by the query going parallel. Even if I force the query to run at DOP 1, it runs in about 25 seconds. Is 15 seconds of duration worth the 7 additional threads? I don’t know.
Again, it depends largely on your belief system. You may find this to be a good way to kill time until you end up somewhere better. You might not.
wisdumb
The relevant difference in the query plan here (again, based on my observations over the years) is that rather than two consecutive Segment operators, we have Segment > Sequence Project > Segment > Window Spool.
In this case, the Segment operators only list UserId in the “Group By” portion of the query plan. The Sequence Project uses ROW_NUMBER to define the frame.
gifts!
The reason for the performance difference is that the RANGE/default specification uses an on-disk worktable for the Window Spool, and the ROWS specification uses one in-memory. If you were to compare memory grant details for the two query plans, you’d see the RANGE/default query had 0 for all memory grant categories, and the ROWS specification asks for a ~6GB memory grant.
There is a limit here though. If you go beyond 10,000 rows, an on-disk table will be used. This query will run for just about a minute:
WITH Comments AS
(
    SELECT
        SUM(c.Score) OVER
        (
            PARTITION BY
                c.UserId
            ORDER BY
                c.CreationDate
            ROWS BETWEEN 9999 PRECEDING
                     AND CURRENT ROW
        ) AS n
    FROM dbo.Comments AS c
)
SELECT
    c.*
FROM Comments AS c
WHERE c.n < 0
OPTION(USE HINT('QUERY_OPTIMIZER_COMPATIBILITY_LEVEL_140'));
Unfortunately, details of the Window Spool don’t indicate that any I/O was done. This seems a little bit weird, since Many to Many Merge Joins will show I/O details for the worktable.
Anyway. What about that Batch Mode?
Batcher Up
In Batch Mode, the window specification doesn’t tend to make a lot of difference when it comes to performance.
bangers
Both of these queries ask for 1MB of memory, but take ~3 seconds to scan the table single-threaded.
If you use an empty OVER() clause, you can’t specify rows or ranges. You use the default/RANGE specification. That typically means queries using that in Row Mode vs Batch Mode will be much slower.
WITH Comments AS
(
    SELECT
        COUNT_BIG(*) OVER () AS n
    FROM dbo.Comments AS c
)
SELECT
    c.*
FROM Comments AS c
WHERE c.n < 0
OPTION(USE HINT('QUERY_OPTIMIZER_COMPATIBILITY_LEVEL_140'));
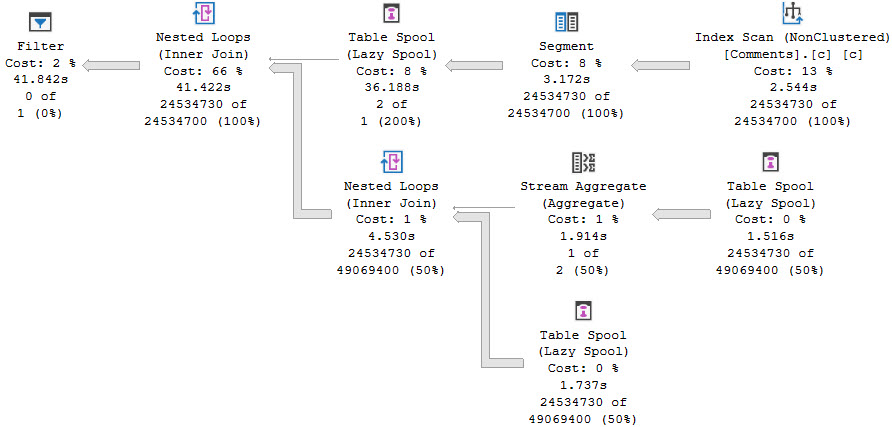
Also, the query plans are atrocious looking.
take your time
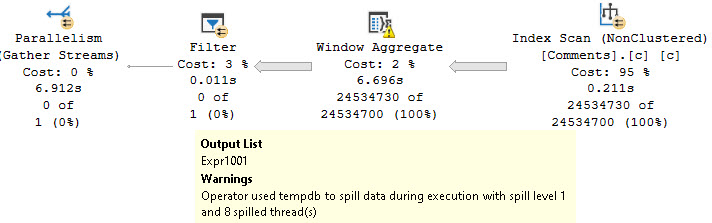
Batch Mode does solve a lot of the issues with them, but at the cost of additional memory usage, and the potential for spilling.
scampi
Batch Mode Memory Grant Feedback will fix the spill, and the query will run about 2-3 seconds faster.
Thanks, probably.
Some Grants Are Bigger Than Others
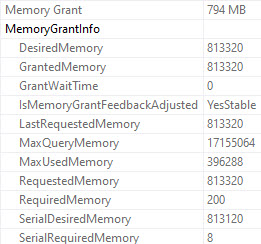
The non-spilling memory grant for the COUNT query is about 800MB.
one right here
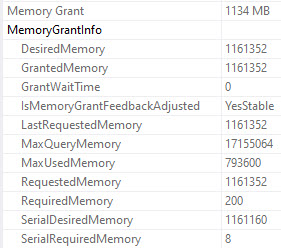
The non-spilling grant for the SUM query is about 1100MB:
friendly
Apparently the reason for the additional memory is because behind the scenes sum also does a count, and returns NULL if it’s zero.
SELECT
    SUM(x.x) AS the_sum,
    COUNT_BIG(x.x) AS the_x_count,
    COUNT_BIG(*) AS the_full_count
FROM
(
    SELECT CONVERT(int, NULL) AS x
) AS x;
Thanks for reading!
Going Further
If this is the kind of SQL Server stuff you love learning about, you’ll love my training. Blog readers get 25% off the Everything Bundle — over 100 hours of performance tuning content. Need hands-on help? I offer consulting engagements from targeted investigations to ongoing retainers. Want a quick sanity check before committing to a full engagement? Schedule a call — no commitment required.
All of our previous queries looked about like this:
WITH Comments AS
(
    SELECT
        ROW_NUMBER() OVER
        (
            PARTITION BY
                c.UserId
            ORDER BY
                c.CreationDate
        ) AS n
    FROM dbo.Comments AS c
)
SELECT
    c.*
FROM Comments AS c
WHERE c.n = 0;
The only columns that we were really selecting from the Comments table were UserId and CreationDate, which are an integer and a datetime.
Those are relatively easy columns to deal with, both from the perspective of reading and sorting.
In order to show you how column selection can muck things up, we need to create a more appropriate column store index, add columns to the select list, and use a where clause to restrict the number of rows we’re sorting. Otherwise, we’ll get a 16GB memory grant for every query.
Starting Point
Selecting no additional columns:
WITH Comments AS
(
    SELECT
        ROW_NUMBER() OVER
        (
            PARTITION BY
                c.UserId
            ORDER BY
                c.CreationDate
        ) AS n
    FROM dbo.Comments AS c
    WHERE c.CreationDate >= '20131201'
)
SELECT
    c.*
FROM Comments AS c
WHERE c.n = 0;
On a second run of the query, after a memory grant feedback correction, we end up with a plan with these details:
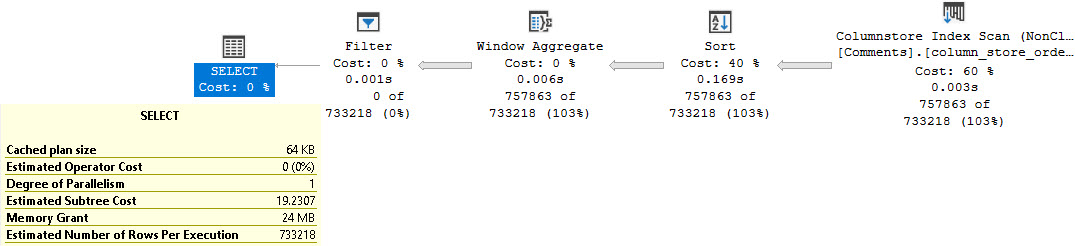
burgers
It takes us 3 milliseconds to scan the column store index, and we get a 24MB memory grant. This is good. I like this.
Darn Strings
Our second query looks like this. We’re selecting all the columns from the Comments table.
WITH Comments AS
(
    SELECT
        c.Id,
        c.CreationDate,
        c.PostId,
        c.Score,
        c.Text,
        c.UserId,
        ROW_NUMBER() OVER
        (
            PARTITION BY
                c.UserId
            ORDER BY
                c.CreationDate
        ) AS n
    FROM dbo.Comments AS c
    WHERE c.CreationDate >= '20131201'
)
SELECT
    c.*
FROM Comments AS c
WHERE c.n = 0;
A first run of the query, before memory grant feedback fixes things for us, asks for a 16GB memory grant. Without this mechanism in place, we’ll keep asking for the same unproductive grant. If you don’t have batch mode and enterprise edition, this is the scenario you’ll face over and over again.
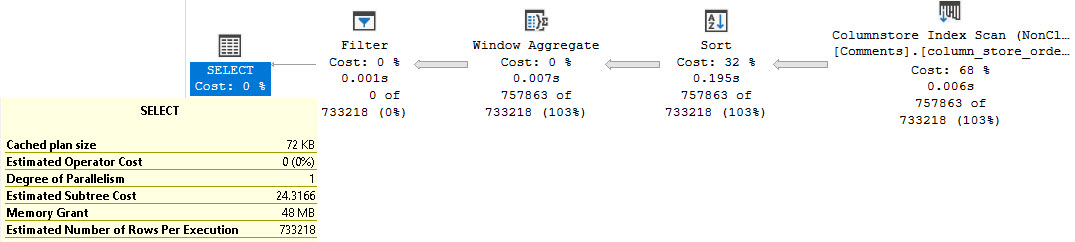
When memory grant correction kicks in, we end up with a 456MB memory grant.
Quite an adjustment, eh?
kick me
We also end up taking 125ms to scan the table with parallel threads, up from 3 milliseconds with a single thread. Of course, the issue here is mostly the Text column.
Strings were a mistake.
No Strings Attached
If we select all the columns other than the string, we’ll end up with a very similar set of metrics as the first plan.
mexico
If we want to maintain those metrics, but still show the Text column, we’ll need to do something like this:
WITH Comments AS
(
    SELECT
        c.Id,
        c.CreationDate,
        c.PostId,
        c.Score,
        c.UserId,
        ROW_NUMBER() OVER
        (
            PARTITION BY
                c.UserId
            ORDER BY
                c.CreationDate
        ) AS n
    FROM dbo.Comments AS c
    WHERE c.CreationDate >= '20131201'
)
SELECT
    c.*,
    c2.Text
FROM Comments AS c
JOIN dbo.Comments AS c2
    ON c.Id = c2.Id
WHERE c.n = 0;
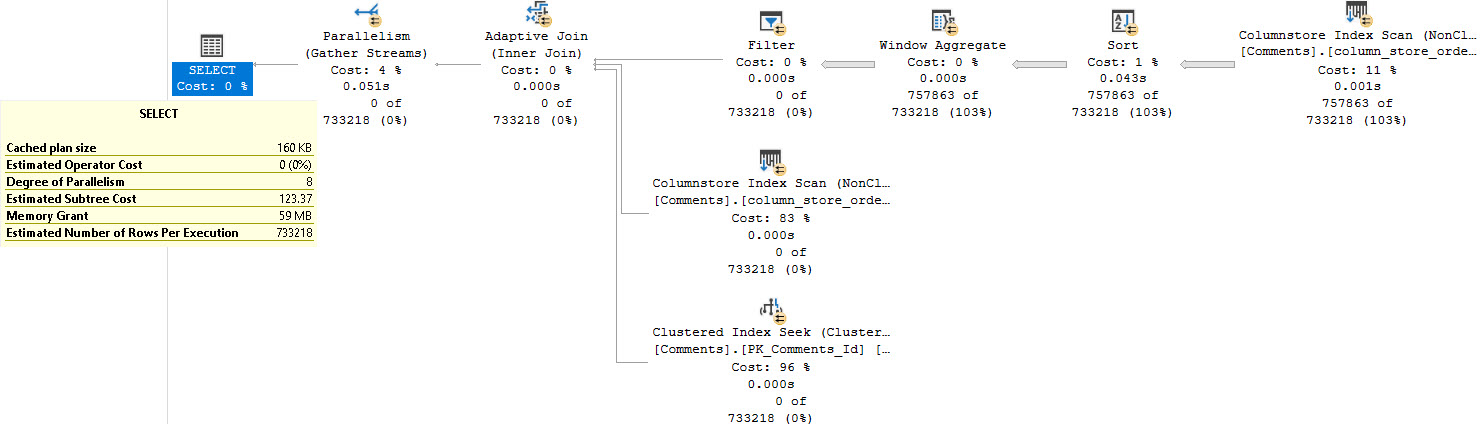
big hands
Using a self-join, and getting the initial set of columns we care about, then getting the Text column at the end means we avoid some of the the knuckle-headedness of strings in databases.
Deep Drink
This pattern applies to more than just windowing functions, but it’s a performance issue I have to tune pretty often for people using paging queries.
In tomorrow’s post, we’ll look at another rather unfortunate thing that I see people messing up with windowing functions, and how you can spot it looking at query plans.
Thanks for reading!
Going Further
If this is the kind of SQL Server stuff you love learning about, you’ll love my training. Blog readers get 25% off the Everything Bundle — over 100 hours of performance tuning content. Need hands-on help? I offer consulting engagements from targeted investigations to ongoing retainers. Want a quick sanity check before committing to a full engagement? Schedule a call — no commitment required.
Getting it out of the way, yes, we can create this nonclustered row store index to store our data in oh-so-perfect order for the windowing function:
CREATE INDEX row_store
ON dbo.Comments
(
    UserId,
    CreationDate
);
Keeping in mind that sort direction matters in how you write your query and define your index, this particular topic has, in my mind, been done to death.
pasty
Look ma, no Sort! Whoopie.
We also get serial plans. For the row store query, it’s about twice as fast, even single-threaded.
For the column store query, it’s about twice as slow.
Headed Parallel
Here are some interesting things. You’re going to want to speak to the manager.
Let’s force these to go parallel. For science.
longer
Not only is the parallel version of the row mode plan a full second slower, but… look at that batch mode plan.
Look at it real close. There’s a sort before the Window Aggregate, despite reading from the same nonclustered index that the row mode plan uses.
But the row mode plan doesn’t have a Sort in it. Why? Because it reads ordered data from the index, and the batch mode plan doesn’t.
This must be hard to do, with all the support added for Batch Mode stuff, to still not be able to do an ordered scan of the data.
For those of you keeping track at home: yes, we are sorting sorted data.
Column-Headed
Let’s try an equivalent column store index:
CREATE COLUMNSTORE INDEX column_store_ordered
ON dbo.Comments
(
    UserId,
    CreationDate
)
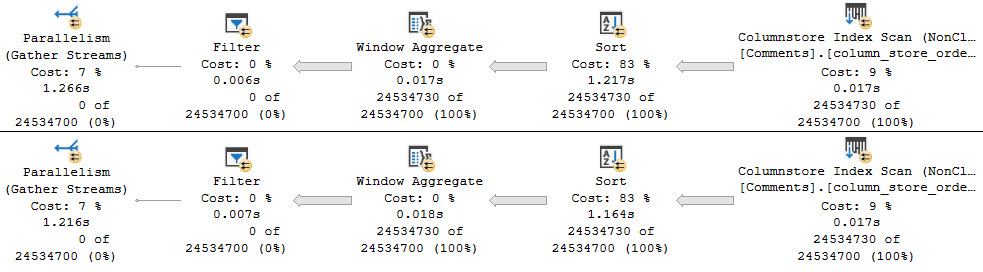
tiny dragons
Both have to sort, but both are fast and parallel. Yes, Sorting is annoying. Unfortunately, we can’t do this Sort in the application.
But hey, look how fast those index scans are. Choo-choo, as a wise man once said.
And of course, since we have to sort anyway, we’d be better off creating a wide nonclustered column store index on the table, so it would be more generally useful to more queries. You only get one per table, so it’s important to choose wisely.
If you have queries using window functions where performance is suffering, it might be wise to considered nonclustered column store indexes as a data source for them. Beyond just tricking the optimizer into using Batch Mode, the data compression really helps.
Elsewise
But there’s something else to consider, here: the plans with Sorts in them require memory.
It’s not much here — about 570MB — but in situations where more columns are needed for the query, they could get much larger.
If this is the kind of SQL Server stuff you love learning about, you’ll love my training. Blog readers get 25% off the Everything Bundle — over 100 hours of performance tuning content. Need hands-on help? I offer consulting engagements from targeted investigations to ongoing retainers. Want a quick sanity check before committing to a full engagement? Schedule a call — no commitment required.
Prior to SQL Server 2012, this blog post would be wrong. If you’re still on a version prior to 2012, ignore this blog post.
In fact, ignore every blog post and go upgrade those servers. Go on. Get out of here. Show’s over.
After SQL Server 2012, AKA the only versions that currently matter, this blog post is largely correct, and leans more towards correctness as you get to closer to SQL Server 2019.
Sliding scale correctness. Get on board.
Say It Slow
When windowing functions don’t have a Partition By, the parallel zone ends much earlier on than it does with one.
That doesn’t mean it’s always slower, though. My general experience is the opposite, unless you have a good supporting index.
But “good supporting index” is for tomorrow. You’re just going to have to deal with that.
WITH Comments AS
(
    SELECT
        ROW_NUMBER() OVER
        (
            ORDER BY
                c.CreationDate
        ) AS n
    FROM dbo.Comments AS c
)
SELECT
    c.*
FROM Comments AS c
WHERE c.n = 0
OPTION(USE HINT('QUERY_OPTIMIZER_COMPATIBILITY_LEVEL_140'));
With just an Order By in the windowing function, our query plan looks about like so:
ripper
Immediately after sorting data, our parallel streams are gathered. This is the end of our parallel zone, and it will occur regardless of if you’re filtering on the windowing function or now. I’m filtering on it here because I don’t want to spend any time retuning rows to SSMS.
Here’s an example of when a parallel zone is started again later:
WITH Comments AS
(
    SELECT
        ROW_NUMBER() OVER
        (
            ORDER BY
                c.CreationDate
        ) AS n
    FROM dbo.Comments AS c
)
SELECT
    c.*
FROM Comments AS c
WHERE c.n > 100000000
OPTION(USE HINT('QUERY_OPTIMIZER_COMPATIBILITY_LEVEL_140'));
innuendo
Note that there’s no Top in this plan prior to the Filter.
You’ll see a Top generally when you filter on the windowing function with an equality or less-than predicate. Greater than seems to most often not end up with a Top in the plan.
Margaret Batcher
If we let Batch Mode run free, things turn out a little bit different.
WITH Comments AS
(
    SELECT
        ROW_NUMBER() OVER
        (
            ORDER BY
                c.CreationDate
        ) AS n
    FROM dbo.Comments AS c
)
SELECT
    c.*
FROM Comments AS c
WHERE c.n = 0;
branded!
The Window Aggregate operator is within the parallel zone, unlike the Segment and Sequence Project operators in the Row Mode plan.
If we reuse the greater-than query from above while allowing Batch Mode to be used, we get a fully parallel plan.
science can’t explain it
Paddington
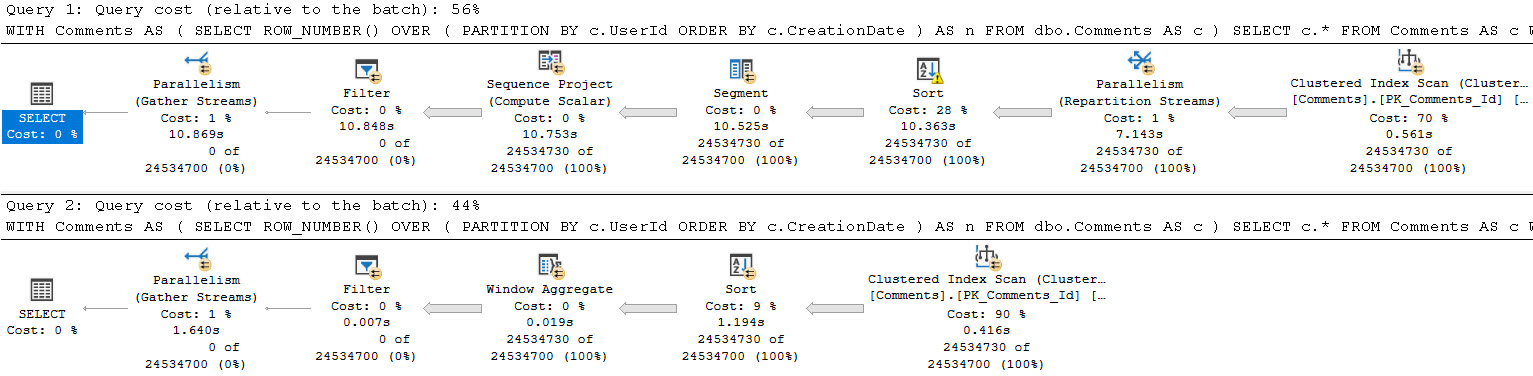
Of course, Partition By adds work, especially in Row Mode, and especially without a supporting index.
boulevard
The nearly 11 second Row Mode plan compared to the 1.6 second Batch Mode plan doesn’t leave a lot of room for arguing.
It’s also worth noting here that Batch Mode Sorts (at least currently) will always sort on a single thread, unless it’s the child of a Window Aggregate operator, like in the above plan.
Tomorrow, we’ll look at how indexing can improve things, but not just row store indexes!
Everyone knows about those P(artition By) O(rder By) C(overing) indexes, but does that attention to ordering matter as much with column store indexes?
Tune in to find out!
Thanks for reading.
Going Further
If this is the kind of SQL Server stuff you love learning about, you’ll love my training. Blog readers get 25% off the Everything Bundle — over 100 hours of performance tuning content. Need hands-on help? I offer consulting engagements from targeted investigations to ongoing retainers. Want a quick sanity check before committing to a full engagement? Schedule a call — no commitment required.
To start things off, we’re going to talk about query plan patterns related to windowing functions.
There are several things to consider with windowing function query plans:
Row vs Batch mode
With and Without Partition By
Index Support for Partition and Order By
Column SELECTion
Rows vs Range/Global aggregates
We’ll get to them in separate posts, because there are particulars about them that would make covering them all in a single post unwieldy.
Anyway, the first one is pretty simple, and starting simple is about my speed.
Row Mode
I’m doing all of this work in SQL Server 2019, with the database in compatibility level 150. It makes my life easier.
First, here’s the query we’ll be using. The only difference will be removing the hint to allow for Batch Mode later on.
WITH Comments AS
(
    SELECT
        ROW_NUMBER() OVER
        (
            PARTITION BY
                c.UserId
            ORDER BY
                c.CreationDate
        ) AS n
    FROM dbo.Comments AS c
)
SELECT
    c.*
FROM Comments AS c
WHERE c.n = 0
OPTION(USE HINT('QUERY_OPTIMIZER_COMPATIBILITY_LEVEL_140'));
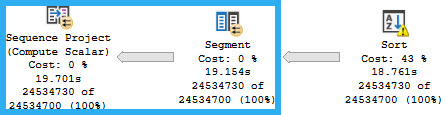
Part of the row mode query plan will look like this:
The two operators that generate the numbering are the Segment and Sequence Project.
shotted
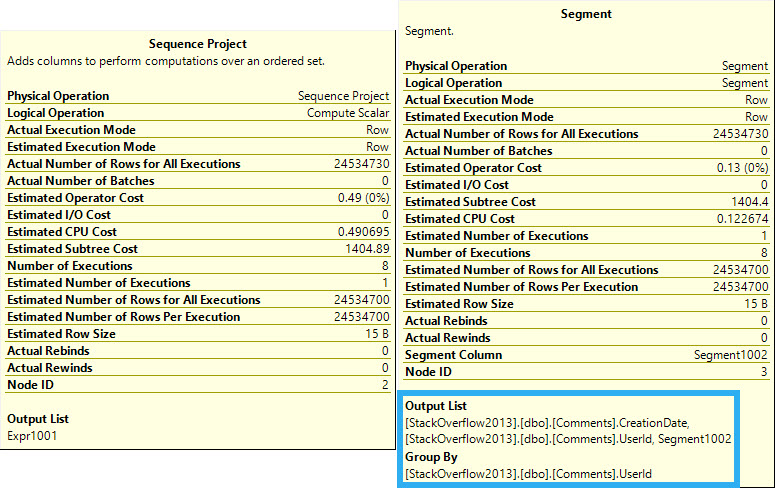
We’ll talk about the Sort later on. For now, we can see the segment “grouping” by UserId, and the Sequence Project description notes that it works over an ordered set.
You can probably guess why we need the Sort here.
consider surgery
Group is in quotes up there, because technically there’s no grouping. The “Segment1002” column in the Output List of the Segment is a computed column that marks the beginning and ending of each set of values. Likewise, the Sequence Project outputs “Expr1001”, which in this case is the calculated row number.
Batch Mode
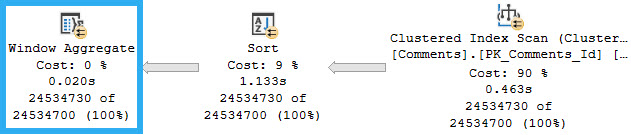
In Batch Mode, there are three operators associated with windowing functions that get replaced with a single operator: the Window Aggregate.
The operators that get replaced are two we’ve already seen — Segment and Sequence Project, along with one we’ll see in a future post, the Window Spool.
richie rich
We still need to Sort data for it without a supporting index. Gosh, those indexes sure are magickal.
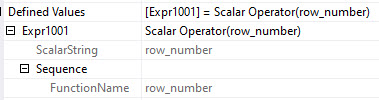
The details of the Window Aggregate do still show a sequence generated, but we no longer see the “grouping”.
a society
Baby Steps
Batch Mode kicks the pantalones off of Row Mode when it comes to window functions, but that’s not really the point of the post.
If you’re using a relatively modern version of SQL Server and also windowing functions, you should look at various ways to get Batch Mode processing alongside them.
In the next entry in this series, we’ll look at how the absence and presence of Partition By changes parallelism.
Thanks for reading!
Going Further
If this is the kind of SQL Server stuff you love learning about, you’ll love my training. Blog readers get 25% off the Everything Bundle — over 100 hours of performance tuning content. Need hands-on help? I offer consulting engagements from targeted investigations to ongoing retainers. Want a quick sanity check before committing to a full engagement? Schedule a call — no commitment required.
I’m writing this series because as interesting as single operators can be, you rarely run into interesting query plans that are a single operator. I don’t know exactly how many posts this will end up being. I have a list of about 15 things that I’d like to write about.
Anyway, I’d been thinking about something like this for a while, because being able to understand which part of a query generates which part of a query plan can help you focus in on what you need to work on. It’s also helpful to understand how different aspects of your database design and written queries might manifest in query plans.
You know, for performance.
Anyway, I hope you enjoy it. This post will be remarkably empty on first read, but will populate over time.
Thanks for reading!
Going Further
If this is the kind of SQL Server stuff you love learning about, you’ll love my training. Blog readers get 25% off the Everything Bundle — over 100 hours of performance tuning content. Need hands-on help? I offer consulting engagements from targeted investigations to ongoing retainers. Want a quick sanity check before committing to a full engagement? Schedule a call — no commitment required.
In this video, I delve into the intricate relationship between queries and memory usage on SQL Server. Using my novel stored procedure, SP_pressure_detector, I demonstrate how to evaluate memory usage effectively by running a query designed to fill up the buffer pool and another that generates a significant 16 gigabyte memory grant. By analyzing these processes, viewers can understand how different queries compete for memory resources and the impact on overall server performance. I also explore practical scenarios where multiple memory-intensive operations are run simultaneously, illustrating the dynamic changes in memory allocation and the resulting effects on buffer pools and query execution.
Full Transcript
Erik Darling here with Erik Darling Data. And we recently got sponsored by BeerGut Magazine. Thank you for sending some beer so that I can hopefully someday be a centerfold in BeerGut Magazine. Appreciate you, your wonderful publication. Truly doing work that the journalistic world is afraid to do. Anyway, today I want to talk about, you know, queries and memory and how you can use my novel stored procedure, SP pressure detector, SP, was there an underscore? No, there’s an underscore. SP underscore pressure detector to evaluate memory usage on your SQL Server and how queries and different things might be fighting over it. Now, I have one query here that’s designed to just fill up the buffer pool. It hits the POST table, which is big, and cross-joins the VOTES table because it’s a demo and why not, I don’t care. And then I have this query down here, which will generate a 16 gig memory grant. One six. And we’re going to see how these things kind of play together. Now, if we look at how big the POST table is, we can see that it is 120 gigabytes. And that means it is larger than the amount of memory we have assigned to the server, which is just about at the 90, well, max memory, max memory is set to 90 gigs.
The VM itself has 96 gigs. If we go look over, oh, not there. If we go look over here, we can see 96 gigs. That’s 96 times 1024. We do correct math in these videos, by God. But anyway, let’s go look at what’s going on in the server right now, which is absolutely nothing. There is nothing happening. The server is wildly, wildly bored. If we look at some of the details here, we can see that the buffer pool is up around 86 gigs, just about close enough for me to say 86. If you want to argue, I don’t know, do it in the mirror, mirror in the bathroom. We can see that currently there are about three gigs of memory assigned to other things within SQL Server. What are they? I don’t know. Maybe just a whole bunch of little things like this. I don’t know. You’ll have to just deal with that too. But what happens when we run this store procedure.
And we come look over here. We’re never going to really get up to that 90 gigs of max server memory. Like we’re never going to, like the buffer pool is never actually going to hit that number. It’ll always stay just around the 86 gig mark. Sort of interestingly, if I turn lock pages and memory off, this thing will stay just around like 82, 83 gigs.
We do use a little bit more buffer pool when we have, when we have lock pages and memory turned on. I don’t know if that’s like the biggest deal in the world, but you know, it’s like, at least in this situation where it’s just like a few gigs difference. But, you know, it just may be something helpful to know. And if we look at what happens to memory when we run the memory thief, store procedure, and come look at SP pressure detector, we’re going to see immediately that this 16 point something gigs gets reserved.
And memory used is going to slowly, or the buffer pool is going to slowly decrease down to about 76 gigs. We’re also going to see the stolen server memory setting, and that’s going to slowly creep up as the query uses the memory that it’s been granted. We can see that the memory has been granted that 16 whatever gigs, and we can see that the memory that it’s used so far is only about 7 gigs.
But as that number creeps up, now this number, now we’ve used about 15 gigs, we’re going to see the stolen server memory setting, or stolen server memory metric creep up. So, stolen server memory is a snapshot of what is taking memory away from the buffer pool currently.
All right. If we kill this query, murder it, and it’s stopped, and we come look at SP pressure detector, we’re going to see this number disappear.
It goes away immediately. Stolen server memory also goes back down to about 3 gigs, but used memory hasn’t really recovered, right? We see that number is going to stay exactly the same because nothing is asking to get read back into the buffer pool and get things moving there.
All right. So, if we keep running this, nothing really is going to happen. Cool.
That’s good to know. We’ve set up some sort of, like, things in isolation that matter. Okay. Let’s abuse this server a little bit. Close this. We don’t need that open.
And we’re going to run four copies of our memory thief store procedure. And we’re going to run three copies of our buffer pool filling store procedure. And let’s see what happens.
All right. So, we’ve got our memory thieves. And we’ve got our pool fillers. And if we come over here and run this, this has jumped up to about 50 gigs. Stolen server memory is about 12 gigs.
But we’re going to see that the buffer pools slowly decrease as these memory grants start getting used, right? As these numbers start creeping up, these used memory numbers start creeping up, what happens? Buffer pools start shrinking down and down and down.
And stolen server memory creeps up and up and up. All right. So, you can see all that stuff happening there. And if we look at what’s going on with the queries, well, we’re going to see that the queries that need to, read a bunch of pages from disk into memory are, of course, going to be waiting on page IOLatch, SH.
All right. And we’re going to be waiting a long, long time on that. All right.
Reading pages from disk into memory. That’s what we have to do because we don’t have all the pages that we need in memory. And SQL Server is a curmudgeon about that sort of thing. All right. So, we come over here and look. We’re also going to have one query waiting on resource semaphore.
So, one of our queries that is asking for a memory grant is not getting it. It has requested that 16 gig grant, but SQL Server can’t give it out because it has reached the limit of how much it is willing to give out to queries. All right.
If we look over here a little bit, we will see that this thing is sitting in a queue, unable to do anything. And if we look down here, we’ll see that we have granted out all that. And even though we have almost the identical amount of memory that that thing has asked for available to give out, we’re not going to give it out to that query.
This is why we hit those resource semaphore weights. I’ve recorded a whole bunch of videos about that. But notice that what we end up with here is at some point, the buffer pool is shrunk down to 40 gigs.
And we have given out more memory to queries than we have kept in the buffer pool by about 9 gigs. All right. So, that’s fun stuff right there.
That’s really fun, interesting, messed up stuff. And if we keep running SP pressure detector, this situation isn’t really going to change much. If we just keep running this, eventually we’ll end up with more queries waiting on resource semaphore.
We’ll end up with the buffer pool just getting abused and beat up and dropping down to a way lower number. And, you know, things just not being fun for SQL Server. But that’s the new thing that SP pressure detector can show you.
I just added that recently while working with a client. This top result sit here. And as we kill off those queries, we stop things from running. Notice that we still have a very small buffer pool.
We still have not given anything back to the buffer pool. But we have reclaimed all the memory that we could give out to queries. So, that’s fun stuff there.
So, anyway, I think, you know, I’ve said it quite a few times in quite a few ways. But, you know, make sure when you are sizing your SQL servers, when you are tuning your SQL servers, and you’re trying to figure out why your SQL servers are slow and crappy and everything is falling apart.
Why doesn’t SQL Server scale? Well, probably because you didn’t give it enough memory. Because you are bad at guessing memory numbers.
Something. Bad memory fortune teller. But remember, you know, not only is the amount of memory that you need a function of how much data you have stored on the server, but it’s also a function of how much memory your queries are asking for.
If you want to figure out if SQL Server has enough memory, and using my store procedure, SP pressure detector is a great way to do that. Because it will help you determine if queries are waiting on memory.
You have resource semaphore weights, how much memory is generally taken away from the buffer pool. And, you know, you can look at the weight stats for individual queries and figure out, oh, we spend a lot of time waiting on reading pages from disk.
We spend a lot of time with queries waiting on, with the page IO latch weights. We spend a lot of time with queries waiting on resource semaphore weights, waiting to get memory. So there’s a couple of good things you can figure out.
Just with the hit magical F5 button, and you too can learn all sorts of horrible things about why your SQL Server is slow, and everyone is angry at you, and you will never, ever be a centerfold in BeerGut Magazine. Anyway, it’s Friday.
I hope you are too. And, I don’t know, I’m going to go enjoy my BeerGut Magazine subscription. And, I don’t know, I’ll see you in another video, or maybe you’ll just read me in another blog post.
Or, I don’t know, maybe once I become a world-famous model, world-famous centerfold, I’ll just quit all this SQL Server stuff and go live with the glitterati. Anyway, thanks for watching.
See you next time. Where’s that stop button? Where’s that stop button? And, I’ll just limit it to you in that very столpar,
Going Further
If this is the kind of SQL Server stuff you love learning about, you’ll love my training. Blog readers get 25% off the Everything Bundle — over 100 hours of performance tuning content. Need hands-on help? I offer consulting engagements from targeted investigations to ongoing retainers. Want a quick sanity check before committing to a full engagement? Schedule a call — no commitment required.