Assume that you use Microsoft SQL Server data warehousing. When you run parallel insert queries to insert data into a clustered columnstore index, the query operation freezes.
To quote one of the Top Men of SQL Server product support:
Hope this helps!
How to freeze your query
Consider a query execution that meets all of the following criteria:
A parallel INSERT INTO… SELECT into a columnstore table is performed
The SELECT part of the query contains a batch mode hash join
The query can’t immediate get a memory grant, hits the 25 second memory grant timeout and executes with required memory
The query may appear to get stuck. It no longer uses CPU and the parallel worker threads appear to wait on each other. Let’s go through an example on SQL Server 2017 RTM. First create all of the following tables:
CREATE PARTITION FUNCTION PART_FUN_REP_SGM(BIGINT)AS RANGE LEFTFOR VALUES (1, 2, 3);CREATE PARTITION SCHEME PART_SCHEME_REP_SGMAS PARTITION PART_FUN_REP_SGMALL TO ( [PRIMARY] );DROP TABLE IF EXISTS dbo.SOURCE_DATA_FOR_CCI;CREATE TABLE dbo.SOURCE_DATA_FOR_CCI (PART_KEY BIGINT NOT NULL,ID BIGINT NOT NULL,FAKE_COLUMN VARCHAR(4000) NULL) ON PART_SCHEME_REP_SGM (PART_KEY);INSERT INTO dbo.SOURCE_DATA_FOR_CCI WITH (TABLOCK)SELECT TOP (1048576) 1, ROW_NUMBER()OVER (ORDER BY (SELECT NULL)) % 16000, NULLFROM master..spt_values t1CROSS JOIN master..spt_values t2OPTION (MAXDOP 1);INSERT INTO dbo.SOURCE_DATA_FOR_CCI WITH (TABLOCK)SELECT TOP (1048576) 2, ROW_NUMBER()OVER (ORDER BY (SELECT NULL)) % 16000, NULLFROM master..spt_values t1CROSS JOIN master..spt_values t2OPTION (MAXDOP 1);DROP TABLE IF EXISTS dbo.LARGE_BATCH_MODE_MEMORY_REQUEST;CREATE TABLE dbo.LARGE_BATCH_MODE_MEMORY_REQUEST (ID VARCHAR(4000),INDEX CCI CLUSTERED COLUMNSTORE);INSERT INTO dbo.LARGE_BATCH_MODE_MEMORY_REQUESTWITH (TABLOCK)SELECT TOP (2 * 1048576) CAST(ROW_NUMBER()OVER (ORDER BY (SELECT NULL)) AS VARCHAR(8000))+ 'DYEL'FROM master..spt_values t1CROSS JOIN master..spt_values t2;DROP TABLE IF EXISTS dbo.CCI_SLOW_TO_COMPRESS_TARGET_1;CREATE TABLE dbo.CCI_SLOW_TO_COMPRESS_TARGET_1 (ID BIGINT NULL,INDEX CCI CLUSTERED COLUMNSTORE);DROP TABLE IF EXISTS dbo.CCI_SLOW_TO_COMPRESS_TARGET_2;CREATE TABLE dbo.CCI_SLOW_TO_COMPRESS_TARGET_2 (ID BIGINT NULL,INDEX CCI CLUSTERED COLUMNSTORE);
Here’s what the plan looks like:I set Max Server Memory to 8000 MB and executed two queries with a maximum allowed memory grant of 60% via Resource Governor. The first query finished in about 40 seconds. The second query hasn’t finished after 30 minutes. During those 30 minutes the second query has only used 1184 ms of CPU time. The COLUMNSTORE_BUILD_THROTTLE wait type shows up in sys.dm_os_waiting_tasks:Execution context id 2 is waiting on execution context id 1 with a wait type of HTDELETE. Execution context id 1 has a wait type of COLUMNSTORE_BUILD_THROTTLE. I don’t think that this wait is supposed to show up for parallel inserts. It can show up by design when creating or rebuilding a columnstore index in parallel:
When a columnstore index is being built, the memory grant estimate is based on a segment size of one million rows. The first segment of the index is built using a single thread so the real, required per-thread memory grant is found. Then the memory grants are given per thread and the other segments are built multi-threaded. Although all the threads for the operation are allocated at the start of the build, only one thread is used for the first segment and all the others incur a COLUMNSTORE_BUILD_THROTTLE wait.
The important point is that a wait type of COLUMNSTORE_BUILD_THROTTLE means that worker thread is waiting on another thread to do something. But so does a wait time of HTDELETE. There are only two worker threads and both of them are waiting on another thread to do something. As a result, the query makes no progress. I’ve let similar queries run for 72 hours before giving up and killing them.
How to unfreeze your query
Upgrading to SQL Server 2017 CU11 or higher fixes the issue. With that said, if you’re seeing this issue that means that you have columnstore insert queries waiting at least 25 seconds for a memory grant. That should be considered to be a problem even if the queries didn’t get stuck. If you find yourself in this situation, I strongly consider increasing memory available to SQL Server or limiting memory grants via Resource Governor or some other method.
Final Thoughts
If you have parallel insert queries into CCis that appear to be stuck with no CPU usage and long COLUMNSTORE_BUILD_THROTTLE wait times check your version of SQL Server. Upgrading to at least CU11 will resolve the immediate issue, but consider a more complete fix will include addressing the RESOURCE_SEMAPHORE waits that must be present on your system.
Thanks for reading!
Going Further
If this is the kind of SQL Server stuff you love learning about, you’ll love my training. Blog readers get 25% off the Everything Bundle — over 100 hours of performance tuning content. Need hands-on help? I offer consulting engagements from targeted investigations to ongoing retainers. Want a quick sanity check before committing to a full engagement? Schedule a call — no commitment required.
But when I do, it’s usually to tell people they should use RCSI, and then disappear in a cloud of smoke.
Recently I was thinking about lock promotion, because that’s what happens when I get lonely.
While digging around, I found some interesting stuff.
This is the part where I share it with you.
Without Five I Couldn’t Count To Six
The first thing I wanted was a table that I wouldn’t care about messing up, so I made a copy of the Users table.
SELECT *
INTO dbo.IDontCareAboutUsers
FROM dbo.Users AS u

ALTER TABLE dbo.IDontCareAboutUsers
    ADD CONSTRAINT pk_IDontCareAboutUsers_id PRIMARY KEY CLUSTERED (Id);
Then I picked on a Reputation that only has one entry in the table: 20720.
BEGIN TRAN
UPDATE idcau
SET idcau.Reputation = 0
FROM dbo.IDontCareAboutUsers AS idcau
WHERE idcau.Reputation = 20720
OPTION(MAXDOP 4)

ROLLBACK
What followed was a full morning of wishing I paid more attention in internals class.
Number One
The first thing I found is that there were 16 attempts at promotion, and four successful promotions.
4×4
Why did this seem weird? I dunno.
Why would there be only 4 successful attempts with no competing locks from other queries?
Why wouldn’t all 16 get promotions?
Number Two
Well, that’s a parallel plan. It’s running at DOP 4.
I added the hint in the update query above so I wouldn’t have to, like, do more to prove it.
Plantar
Okay, maybe this makes a little more sense. Four threads.
If each one tried four times, maybe another thread was like “nah, yo”, and then got by on the fifth try.
Number Three
Looking at perfmon counters before and after running showed.. exactly four!
This isn’t wrong, necessarily. This is how things look in the DMVs it touches after the update runs, but the transaction is still open.
I’m not mad, but I am curious. I wanna know what happened in the middle.
Number Five
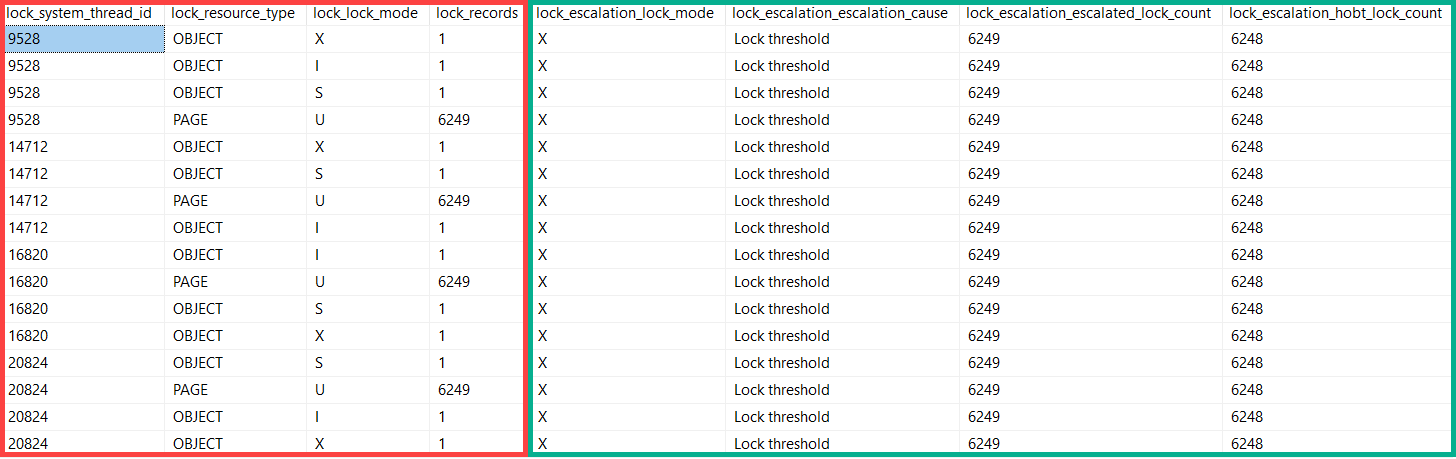
I set up a couple Extended Event sessions, one to capture locks acquired, and one to capture lock escalations.
This was neat.
Tell’em, picture
The red rectangle comes from locks acquired during the course of the update. You can see four separate threads going through and grabbing locks.
Each thread got the okay to escalate at 6,249 page locks.
Number Six
Lock promotion isn’t only denied when competing locks on the table are held by other queries.
Modification queries taking locks will attempt promotion every 1,250 locks.
Documentation regarding lock promotion points to at least 5,000 locks needing to be held before it occurs, as one factor (incompatible locks not being present are another).
If we have four threads asking every 1,250 locks (in this case on pages), they all will have made four attempts before finally escalating at 6,249.
6,249 / 1,250 is right around 5, for those who don’t have a calculator installed.
Don’t freak out if your monitoring tool tells you there’s a lot of attempts at escalation, and very few are successful.
It’s not always a sign that there’s blocking, though you may be able to correlate that with lock waits if both are present.
Thanks for reading!
Going Further
If this is the kind of SQL Server stuff you love learning about, you’ll love my training. Blog readers get 25% off the Everything Bundle — over 100 hours of performance tuning content. Need hands-on help? I offer consulting engagements from targeted investigations to ongoing retainers. Want a quick sanity check before committing to a full engagement? Schedule a call — no commitment required.
Last week’s thrilling, stunning, flawless episode of whatever-you-wanna-call-it.
Thanks for watching!
Going Further
If this is the kind of SQL Server stuff you love learning about, you’ll love my training. Blog readers get 25% off the Everything Bundle — over 100 hours of performance tuning content. Need hands-on help? I offer consulting engagements from targeted investigations to ongoing retainers. Want a quick sanity check before committing to a full engagement? Schedule a call — no commitment required.
I’m gonna be honest with you: I’m not gonna build another First Responder Kit.
It’s established, it’s open source, and it’s badass. I poured a ton of work into it over the years, and starting from scratch seems like a bad use of my time.
I totally encourage you to help continue to build it. I learned a ton working on that stuff, and it was an incredibly valuable and rewarding experience.
I am going to build tooling that I think would be useful but that isn’t covered in there, for things like:
Using any tool that returns a given set of information about wait stats, query plans, indexes, or whatever about SQL Server will show you roughly the same problems.
Roughly. Some better than others. Some I have no idea. Some not so much.
The point is, I can teach you to find problems with the tool you’re using, or help you find a tool that does.
I can also teach you how to solve them.
Nothing New But The Name
My thing over here is coaching. Helping you become better at whatever it is you wanna do.
Every tool is a wrapper for what’s inside SQL Server. Tools are interchangeable, mostly.
Knowing how use and interpret them in a meaningful way is not.
Thanks for reading!
Going Further
If this is the kind of SQL Server stuff you love learning about, you’ll love my training. Blog readers get 25% off the Everything Bundle — over 100 hours of performance tuning content. Need hands-on help? I offer consulting engagements from targeted investigations to ongoing retainers. Want a quick sanity check before committing to a full engagement? Schedule a call — no commitment required.
Thank you to everyone who donated, attended the session, and of course the lovely people at SQLBits for putting on a great conference. Hope to see everyone again next year…
If this is the kind of SQL Server stuff you love learning about, you’ll love my training. Blog readers get 25% off the Everything Bundle — over 100 hours of performance tuning content. Need hands-on help? I offer consulting engagements from targeted investigations to ongoing retainers. Want a quick sanity check before committing to a full engagement? Schedule a call — no commitment required.
The speaker lineup is PHENOMENAL, including Joe Obbish who absolutely kills it with column store.
If you’re from that neck of the woods, I’d encourage you to make the trip.
It’s my first time in town, and I’m sure I’ll have lots of questions like “what smells like Chicago?”
See you there!
Going Further
If this is the kind of SQL Server stuff you love learning about, you’ll love my training. Blog readers get 25% off the Everything Bundle — over 100 hours of performance tuning content. Need hands-on help? I offer consulting engagements from targeted investigations to ongoing retainers. Want a quick sanity check before committing to a full engagement? Schedule a call — no commitment required.
In this video, I share one of my favorite features in SQL Server execution plans that often goes unnoticed but can provide invaluable insights into query performance. I dive into the actual time statistics property, which allows you to see exactly how long each operator ran for without needing live query plans. By highlighting examples from a recent podcast and demonstrating with a practical query plan, I show how this feature can pinpoint where your queries are spending most of their time—whether it’s on sorting or other operations—and help identify areas for optimization. If you’re curious about optimizing your SQL Server queries or just want to understand execution plans better, make sure to check out the pre-con I’ll be giving at SQL Bits and start exploring this feature in your own plans!
Full Transcript
What’s up? Erik Darling here with Erik Darling Data, the official sticker of my company, or the official company of my stickers, I guess, I don’t know, whatever. I’m recording a quick video today to talk about one of my favorite new features, or not even new, but one of my favorite features that I don’t see enough people talking about when they’re looking at query plans. And I’ve been watching this podcast called Drink Champs, which is awesome, and it’s just like all interviews with rap dudes from the 80s and 90s and stuff.
And I get jealous because when they record their thing, they get to be like, make some noise! And they have like air horns. All I have is this lame can of compressed air. So when I do make some noise, it’s just… It doesn’t have the same effect. And I think next video I might try to get an air horn in here so that I can make some noise too.
But, so anyway, what I’m going to show you is actually a little bit of a preview from my pre-con that I have coming up at SQL Bits. And I’m really looking forward to that. I’m getting a little nervous because it’s like the Saturday and it’s, man, it’s creeping up. Whew! It’s so close.
But, so one thing that I’m going to be talking about in the pre-con is this cool thing in execution plans that shows you how long an operator kind of ran for. So we have this query, right? Now we have this query plan. And there’s a whole bunch of stuff in it.
And there’s a whole lot of stuff that could be slow. If you look down the bottom of the screen, let me zoom in a little bit down here, we can see this dog ran for 29 seconds. 29! And I know people will be like, well turn on live query plans, rerun it.
Well I don’t want to turn on live query plans, I just want to get my actual plan. And I want to see where I spent all my time. Now if I hit F4 on one of these operators, what’s going to pop up is this new window over on the side, the properties thing. And there’s a property in here called actual time statistics.
And when I open it up, not only can I see the actual CPU and elapsed time that I spend on an operator, but if I click these out, I can see how many rows ended up on threads. I can see if my parallelism got all skewed and stuff got all nasty. So we have this timing here.
So we can see that for this index scan, we spent about six and a half CPU seconds on it. And we spent, we use multiple CPUs to make things faster. And so we spent about one point, well, you know what, I’m going to round up and say 1.8 actual seconds on the index scan.
Right? And if we go down the line, and we look at all of these different operators, we proceed to different operators, we can start to see how much time we spent in different places. And we get over to this sort operator, whoo-wee!
We spent 19 seconds sorting data. That’s crazy. So 19 out of 29 seconds in this execution plan was just spent on this sort. And of course, this sort spills out to disk and it’s all nasty and gnarly.
And that thing spilled almost 1 million pages out to disk. 980,000 pages. That’s bonkers.
Of course, that took 19 seconds. That’s terrible. And as we go down the line, we’ll see different things for, we’ll see different timings. And the timing kind of adds up as you go down. So it wasn’t a full 19 seconds here, but there wasn’t really a whole lot else going on between that scan and that sort.
So we’re going to call that sort the majority of the time we spend in the query plan. Not every operator has this attribute. So if we look at the, if you look at the, sorry, the compute scalar over here, we don’t have that attribute.
And that’s why it disappears. But if you come back to the sequence project compute scalar, we’ll have our actual time statistics back. And we can look at our filter and we can see that as we go kind of to the left, the time will sort of add up.
But it resets in weird places. I haven’t quite figured out the entire dynamic of when things reset and when things change. It’s a little bit weird.
It’s a little bit weird and foreign to me. I don’t think it’s documented anywhere. So I’m going to, I’m going to refrain from making too many guesses. But as we click around, we can kind of see where different parts of the plan spent different amounts of time. And by the time we get to the very end here to this parallelism, where we gather all the streams together, we’re at about 28 seconds.
And then the sort will have us a little bit higher up a little bit closer to 20. So there was some time spent in the query to show us the results, right? So we had to show the results and format that.
But overall, the majority of the time was spent sorting all this data. Now, of course, you’re going to have to come to my pre-con to learn how we can fix this and make this not take 19 seconds. And maybe you, maybe, maybe I’ll see you there.
Or maybe I’ll see you when I, when I talk about this somewhere else, live and in person. I hope I do, because it’s really neat. And you don’t even need an index to fix it. Anyway, that was, that was a short demo of this cool new, well, I keep saying new, this cool thing that I don’t see enough people talking about when they’re looking through execution plans.
And I hope that you watch this video and you start looking at this when you start looking at your actual plans, too. Thanks, and I’ll see you hopefully again soon, maybe. I don’t know.
It’s gearing up to be a weird weekend.
Video Summary
In this video, I share one of my favorite features in SQL Server execution plans that often goes unnoticed but can provide invaluable insights into query performance. I dive into the actual time statistics property, which allows you to see exactly how long each operator ran for without needing live query plans. By highlighting examples from a recent podcast and demonstrating with a practical query plan, I show how this feature can pinpoint where your queries are spending most of their time—whether it’s on sorting or other operations—and help identify areas for optimization. If you’re curious about optimizing your SQL Server queries or just want to understand execution plans better, make sure to check out the pre-con I’ll be giving at SQL Bits and start exploring this feature in your own plans!
Full Transcript
What’s up? Erik Darling here with Erik Darling Data, the official sticker of my company, or the official company of my stickers, I guess, I don’t know, whatever. I’m recording a quick video today to talk about one of my favorite new features, or not even new, but one of my favorite features that I don’t see enough people talking about when they’re looking at query plans. And I’ve been watching this podcast called Drink Champs, which is awesome, and it’s just like all interviews with rap dudes from the 80s and 90s and stuff.
And I get jealous because when they record their thing, they get to be like, make some noise! And they have like air horns. All I have is this lame can of compressed air. So when I do make some noise, it’s just… It doesn’t have the same effect. And I think next video I might try to get an air horn in here so that I can make some noise too.
But, so anyway, what I’m going to show you is actually a little bit of a preview from my pre-con that I have coming up at SQL Bits. And I’m really looking forward to that. I’m getting a little nervous because it’s like the Saturday and it’s, man, it’s creeping up. Whew! It’s so close.
But, so one thing that I’m going to be talking about in the pre-con is this cool thing in execution plans that shows you how long an operator kind of ran for. So we have this query, right? Now we have this query plan. And there’s a whole bunch of stuff in it.
And there’s a whole lot of stuff that could be slow. If you look down the bottom of the screen, let me zoom in a little bit down here, we can see this dog ran for 29 seconds. 29! And I know people will be like, well turn on live query plans, rerun it.
Well I don’t want to turn on live query plans, I just want to get my actual plan. And I want to see where I spent all my time. Now if I hit F4 on one of these operators, what’s going to pop up is this new window over on the side, the properties thing. And there’s a property in here called actual time statistics.
And when I open it up, not only can I see the actual CPU and elapsed time that I spend on an operator, but if I click these out, I can see how many rows ended up on threads. I can see if my parallelism got all skewed and stuff got all nasty. So we have this timing here.
So we can see that for this index scan, we spent about six and a half CPU seconds on it. And we spent, we use multiple CPUs to make things faster. And so we spent about one point, well, you know what, I’m going to round up and say 1.8 actual seconds on the index scan.
Right? And if we go down the line, and we look at all of these different operators, we proceed to different operators, we can start to see how much time we spent in different places. And we get over to this sort operator, whoo-wee!
We spent 19 seconds sorting data. That’s crazy. So 19 out of 29 seconds in this execution plan was just spent on this sort. And of course, this sort spills out to disk and it’s all nasty and gnarly.
And that thing spilled almost 1 million pages out to disk. 980,000 pages. That’s bonkers.
Of course, that took 19 seconds. That’s terrible. And as we go down the line, we’ll see different things for, we’ll see different timings. And the timing kind of adds up as you go down. So it wasn’t a full 19 seconds here, but there wasn’t really a whole lot else going on between that scan and that sort.
So we’re going to call that sort the majority of the time we spend in the query plan. Not every operator has this attribute. So if we look at the, if you look at the, sorry, the compute scalar over here, we don’t have that attribute.
And that’s why it disappears. But if you come back to the sequence project compute scalar, we’ll have our actual time statistics back. And we can look at our filter and we can see that as we go kind of to the left, the time will sort of add up.
But it resets in weird places. I haven’t quite figured out the entire dynamic of when things reset and when things change. It’s a little bit weird.
It’s a little bit weird and foreign to me. I don’t think it’s documented anywhere. So I’m going to, I’m going to refrain from making too many guesses. But as we click around, we can kind of see where different parts of the plan spent different amounts of time. And by the time we get to the very end here to this parallelism, where we gather all the streams together, we’re at about 28 seconds.
And then the sort will have us a little bit higher up a little bit closer to 20. So there was some time spent in the query to show us the results, right? So we had to show the results and format that.
But overall, the majority of the time was spent sorting all this data. Now, of course, you’re going to have to come to my pre-con to learn how we can fix this and make this not take 19 seconds. And maybe you, maybe, maybe I’ll see you there.
Or maybe I’ll see you when I, when I talk about this somewhere else, live and in person. I hope I do, because it’s really neat. And you don’t even need an index to fix it. Anyway, that was, that was a short demo of this cool new, well, I keep saying new, this cool thing that I don’t see enough people talking about when they’re looking through execution plans.
And I hope that you watch this video and you start looking at this when you start looking at your actual plans, too. Thanks, and I’ll see you hopefully again soon, maybe. I don’t know.
It’s gearing up to be a weird weekend.
Going Further
If this is the kind of SQL Server stuff you love learning about, you’ll love my training. Blog readers get 25% off the Everything Bundle — over 100 hours of performance tuning content. Need hands-on help? I offer consulting engagements from targeted investigations to ongoing retainers. Want a quick sanity check before committing to a full engagement? Schedule a call — no commitment required.
Last week’s thrilling, stunning, flawless episode of whatever-you-wanna-call-it.
Well, uh, I was at SQLBits last week, and I didn’t record one. Perils of a single point of failure.
Thanks for watching!
Going Further
If this is the kind of SQL Server stuff you love learning about, you’ll love my training. Blog readers get 25% off the Everything Bundle — over 100 hours of performance tuning content. Need hands-on help? I offer consulting engagements from targeted investigations to ongoing retainers. Want a quick sanity check before committing to a full engagement? Schedule a call — no commitment required.
In this video, I delve into how better indexes can significantly enhance the memory efficiency of SQL Server operations. I walk through two custom views that provide detailed insights into index usage and buffer pool activity. By running various queries and analyzing their impact on memory, I demonstrate how using specific indexes for certain operations can reduce the amount of data read into memory, leading to more efficient use of resources. Whether you’re dealing with a full table scan or filtering by a particular column, understanding these nuances can help optimize your SQL Server environment and improve overall performance.
Full Transcript
Howdy folks, Erik Darling here with Erik Darling Data, now complete with stickers. So I at least can’t close down shop until I’ve given all these stickers out. So you got me around for a little while. And today I wanted to talk to you about something that I think is really interesting in SQL Server and is how better indexes can help you make the most of your SQL Server’s memory. Now I have a couple views that I’ve written. I’m not going to go over the full text of them in the video, but they will be available in the blog post. One of them just kind of gives you a basic view of what indexes you have for, I mean, you can do it for a bunch of tables, but I have it filtered down to just the users table here. So you can see it’s a schema, the table name, the name of any indexes we have on there, how many rows are in the table, how many pages, some information about how big it is, how big the log data is. So good basic information about an index. And that is going to work alongside this other view that I’ve written that will tell you what’s going on in the buffer pool. So like what pages ended up in the buffer pool when you did a particular thing.
Right now we have the entire primary key clustered index for the users table up in the buffer pool. We’ll come back to that. The way this script is generally going to work is I’m going to select everything from the view so that we can see exactly how big and how many pages are in the index. So it’s right at the top. So we always see it. Then I’m going to drop the ever loving crap out of clean buffers and I’m going to clear out the proc cache just to make sure there’s nothing in there.
And to verify that I’m going to run a first select from the memory view. Right. So drop everything out, make sure nothing’s in there. And then I’m going to run some queries in different ways. And after after we’re done with that, we’ll check, we’ll do another check to see what ended up in the buffer pool. So we’re going to go from clean buffer pool, verify that, run a query, see what ended up in the buffer pool afterwards. Good stuff.
The first thing I’m going to run is a select count from the users table. So let’s unquote that. And I’m just going to go hit F5 up here and we’re going to be off to the races. So we have our initial set of information about the index. We have verified that the buffer pool is empty right here. We have our count query that we ran. We have a query plan for it. The, I don’t know why I stuck in there just in case anything happens.
And then we have our select query, right? We can select query from the buffer pool. So now we see that when we did, we ran that count query, we ended up with the, nearly the entire clustered index up in memory. Right. So when we got a count from the clustered index, we needed absolutely everything.
Right. We have 8,505 pages here, 8,505 pages here. We didn’t go and get all that lob data. So one really cool thing about SQL Server is that if you have lob data, but you don’t specifically ask for it, SQL Server doesn’t go run out and find it. They’re not going to read a bunch of lob data into memory if you don’t really need it.
But we can see that we did read everything else up into memory just to get that count. So we know now that if we need to count a whole table and we end up using that clustered index, we need the whole clustered index. But we can do it a little bit differently. Let’s quote this out and let’s run a count for just a single user.
Now the ID column here is the primary key clustered index. So there’s only going to be one user with this ID. And when we go looking to find this user, we’re not going to need to read the entire index in because SQL Server is just going to go get the pages that we need to find this particular user. So now we only end up with 15 pages in the buffer pool and we don’t end up with all 60 some 66 just megs in there.
Right. So there’s 8,505 pages in the index, but we only read 15 in to get that data. So that’s pretty nice. Right. So like SQL Server is also not going to read all of the index in when we don’t need the entire thing. Let’s run a query slightly differently. So I’m going to quote this out. And the first thing I’m going to do is run is I’m going to start using this query now.
So we have a count from the users table where the reputation is greater than or equal to 100,000, but we don’t have an index that helps this query. So when we run this and we get our information back, we’re going to see that once again, SQL Server had to read the entire clustered index up into memory to get the pages that we want to get a count there. This changes when we add an index on the reputation column. So let’s go up here and let’s create this index just on reputation to make our lives easier.
And we’ll rerun that query batch again. And now we can see that for the index information, we have this entry for the nonclustered index that we just created, which is far smaller than the clustered index. Right. It’s only 523 pages versus 8,505 because we can fit a whole lot more of just a single integer on data pages than if you have all the other columns that are in the users table. Now, when we look at what’s in the buffer pool, we only have about 10 total pages from our nonclustered index sitting in there.
So SQL Server is able to say, ah, we have this nonclustered index and I can find this data very easily. I’m only going to get 10 pages from here in order to give you this count. Now, this helps regular count queries too. And I’m going to show you how.
If we quote this back out and we rerun our initial count query, quote that out, run this. We’re going to get our index information again and we will eventually get the remainder of stuff. So there’s our, what’s in the buffer pool? I don’t know.
Somehow that one page stuck around in there. It’s a sneaky clustered index page. But now when we go, when we look at what got read into SQL Server, rather than using the clustered index, used our narrow nonclustered index on reputation.
Right. So we use a smaller index to get a count and we read less into memory. Right. So we rather than using all 8,505 pages of the clustered index, SQL Server was able to get an accurate row count from this nonclustered index, which is only 523 pages.
So smaller indexes can help there. And the right indexes can help SQL Server use memory much more efficiently. We didn’t have, rather than reading an entire index in and saying, I don’t know what we’re going to need. Let’s just get this all up here.
So you will serve. We can go find the right pages and say, hey, you come into memory. The rest of you guys hang out, sit on disk. You do something else for a little while. So pretty cool. I think. Anyway, that was it. I think. Was I anything else? No, I don’t think I had anything else. Cool. All right.
Well, thanks for watching. I hope you learned something. I hope you got some fun stuff out of this. Again, keep an eye out for the blog post. It’ll be out, I don’t know, sometime soon. I’m going to schedule everything today.
And that’s when the full scripts will be available for you to take a look at. Anyway, thanks for watching. And I’ll see you next time. Bye.
Video Summary
In this video, I delve into how better indexes can significantly enhance the memory efficiency of SQL Server operations. I walk through two custom views that provide detailed insights into index usage and buffer pool activity. By running various queries and analyzing their impact on memory, I demonstrate how using specific indexes for certain operations can reduce the amount of data read into memory, leading to more efficient use of resources. Whether you’re dealing with a full table scan or filtering by a particular column, understanding these nuances can help optimize your SQL Server environment and improve overall performance.
Full Transcript
Howdy folks, Erik Darling here with Erik Darling Data, now complete with stickers. So I at least can’t close down shop until I’ve given all these stickers out. So you got me around for a little while. And today I wanted to talk to you about something that I think is really interesting in SQL Server and is how better indexes can help you make the most of your SQL Server’s memory. Now I have a couple views that I’ve written. I’m not going to go over the full text of them in the video, but they will be available in the blog post. One of them just kind of gives you a basic view of what indexes you have for, I mean, you can do it for a bunch of tables, but I have it filtered down to just the users table here. So you can see it’s a schema, the table name, the name of any indexes we have on there, how many rows are in the table, how many pages, some information about how big it is, how big the log data is. So good basic information about an index. And that is going to work alongside this other view that I’ve written that will tell you what’s going on in the buffer pool. So like what pages ended up in the buffer pool when you did a particular thing.
Right now we have the entire primary key clustered index for the users table up in the buffer pool. We’ll come back to that. The way this script is generally going to work is I’m going to select everything from the view so that we can see exactly how big and how many pages are in the index. So it’s right at the top. So we always see it. Then I’m going to drop the ever loving crap out of clean buffers and I’m going to clear out the proc cache just to make sure there’s nothing in there.
And to verify that I’m going to run a first select from the memory view. Right. So drop everything out, make sure nothing’s in there. And then I’m going to run some queries in different ways. And after after we’re done with that, we’ll check, we’ll do another check to see what ended up in the buffer pool. So we’re going to go from clean buffer pool, verify that, run a query, see what ended up in the buffer pool afterwards. Good stuff.
The first thing I’m going to run is a select count from the users table. So let’s unquote that. And I’m just going to go hit F5 up here and we’re going to be off to the races. So we have our initial set of information about the index. We have verified that the buffer pool is empty right here. We have our count query that we ran. We have a query plan for it. The, I don’t know why I stuck in there just in case anything happens.
And then we have our select query, right? We can select query from the buffer pool. So now we see that when we did, we ran that count query, we ended up with the, nearly the entire clustered index up in memory. Right. So when we got a count from the clustered index, we needed absolutely everything.
Right. We have 8,505 pages here, 8,505 pages here. We didn’t go and get all that lob data. So one really cool thing about SQL Server is that if you have lob data, but you don’t specifically ask for it, SQL Server doesn’t go run out and find it. They’re not going to read a bunch of lob data into memory if you don’t really need it.
But we can see that we did read everything else up into memory just to get that count. So we know now that if we need to count a whole table and we end up using that clustered index, we need the whole clustered index. But we can do it a little bit differently. Let’s quote this out and let’s run a count for just a single user.
Now the ID column here is the primary key clustered index. So there’s only going to be one user with this ID. And when we go looking to find this user, we’re not going to need to read the entire index in because SQL Server is just going to go get the pages that we need to find this particular user. So now we only end up with 15 pages in the buffer pool and we don’t end up with all 60 some 66 just megs in there.
Right. So there’s 8,505 pages in the index, but we only read 15 in to get that data. So that’s pretty nice. Right. So like SQL Server is also not going to read all of the index in when we don’t need the entire thing. Let’s run a query slightly differently. So I’m going to quote this out. And the first thing I’m going to do is run is I’m going to start using this query now.
So we have a count from the users table where the reputation is greater than or equal to 100,000, but we don’t have an index that helps this query. So when we run this and we get our information back, we’re going to see that once again, SQL Server had to read the entire clustered index up into memory to get the pages that we want to get a count there. This changes when we add an index on the reputation column. So let’s go up here and let’s create this index just on reputation to make our lives easier.
And we’ll rerun that query batch again. And now we can see that for the index information, we have this entry for the nonclustered index that we just created, which is far smaller than the clustered index. Right. It’s only 523 pages versus 8,505 because we can fit a whole lot more of just a single integer on data pages than if you have all the other columns that are in the users table. Now, when we look at what’s in the buffer pool, we only have about 10 total pages from our nonclustered index sitting in there.
So SQL Server is able to say, ah, we have this nonclustered index and I can find this data very easily. I’m only going to get 10 pages from here in order to give you this count. Now, this helps regular count queries too. And I’m going to show you how.
If we quote this back out and we rerun our initial count query, quote that out, run this. We’re going to get our index information again and we will eventually get the remainder of stuff. So there’s our, what’s in the buffer pool? I don’t know.
Somehow that one page stuck around in there. It’s a sneaky clustered index page. But now when we go, when we look at what got read into SQL Server, rather than using the clustered index, used our narrow nonclustered index on reputation.
Right. So we use a smaller index to get a count and we read less into memory. Right. So we rather than using all 8,505 pages of the clustered index, SQL Server was able to get an accurate row count from this nonclustered index, which is only 523 pages.
So smaller indexes can help there. And the right indexes can help SQL Server use memory much more efficiently. We didn’t have, rather than reading an entire index in and saying, I don’t know what we’re going to need. Let’s just get this all up here.
So you will serve. We can go find the right pages and say, hey, you come into memory. The rest of you guys hang out, sit on disk. You do something else for a little while. So pretty cool. I think. Anyway, that was it. I think. Was I anything else? No, I don’t think I had anything else. Cool. All right.
Well, thanks for watching. I hope you learned something. I hope you got some fun stuff out of this. Again, keep an eye out for the blog post. It’ll be out, I don’t know, sometime soon. I’m going to schedule everything today.
And that’s when the full scripts will be available for you to take a look at. Anyway, thanks for watching. And I’ll see you next time. Bye.
Going Further
If this is the kind of SQL Server stuff you love learning about, you’ll love my training. Blog readers get 25% off the Everything Bundle — over 100 hours of performance tuning content. I’m also available for consulting if you just don’t have time for that and need to solve performance problems quickly.
Demoman!
USE StackOverflow2010;
SET NOCOUNT ON;
GO

/*
--Basic index info
SELECT *
FROM dbo.WhatsUpIndexes AS wui
WHERE wui.table_name = 'Users'
OPTION ( RECOMPILE );
GO

--What's in the buffer pool?
SELECT *
FROM dbo.WhatsUpMemory AS wum
WHERE wum.object_name = 'Users'
OPTION ( RECOMPILE );
GO
*/

--CREATE INDEX ix_whatever ON dbo.Users (Reputation);
GO

SELECT *
FROM dbo.WhatsUpIndexes AS wui
WHERE wui.table_name = 'Users'
OPTION ( RECOMPILE );
GO


DBCC DROPCLEANBUFFERS;
CHECKPOINT;
DBCC FREEPROCCACHE;
CHECKPOINT;
GO 5


SELECT *
FROM dbo.WhatsUpMemory AS wum
WHERE wum.object_name = 'Users'
OPTION ( RECOMPILE );
GO

    SET STATISTICS TIME, IO, XML ON;
    SET NOCOUNT OFF;

    --/*Select a count of everything*/
    SELECT COUNT(*) AS records
    FROM dbo.Users AS u
    WHERE 1 = (SELECT 1);

    --/*Select a count of one user*/
 --   SELECT COUNT(*) AS records
 --   FROM dbo.Users AS u
 --   WHERE u.Id = 22656
	--AND 1 = (SELECT 1);


    --/*Select a count of rep > 100k*/
    --SELECT COUNT(*) AS records
    --FROM dbo.Users AS u
    --WHERE u.Reputation >= 100000
    --AND 1 = (SELECT 1);

    SET NOCOUNT ON;
    SET STATISTICS TIME, IO, XML OFF;

SELECT *
FROM dbo.WhatsUpMemory AS wum
WHERE wum.object_name = 'Users'
OPTION ( RECOMPILE );
GO
In this video, I dive into the nuances of setting `max degree of parallelism` (MAXDOP) and `cost threshold for parallelism` in SQL Server. While many suggest these settings are straightforward—like just setting MAXDOP to the number of cores per NUMA node or cost threshold to any value higher than five—I argue that it’s not always as simple. I explore how different core configurations can affect query performance, especially with varying numbers of sockets and cores. Through practical examples on my laptop, I demonstrate the impact of these settings on query execution times and thread usage, revealing why tuning queries and indexes remains crucial for optimal performance.
Full Transcript
Howdy folks, Erik Darling here with Erik Darling Data. And now that I’ve got stickers to prove it, I think it’s a real company. I think it’s like a thing now. It’s not just like some imaginary website. It’s got like physical goods attached to it. So watch out! And today I’m here to ask an annoying question. And it’s a question, I think it’s annoying because to a lot of people it seems like pretty settled advice, at least to, you know, pretty casual observers of SQL Server, just like, you know, like kind of like aware of best practice. And like, yeah, just do this and this and you’re cool. And that question is, is setting maxed up and cost threshold for parallelism really as easy as it seems?
And I don’t think that it always is. And the reason I think that is because when you take the advice from maxed up, it’s like if you have one socket, you can sometimes leave it alone. But if you have like, you know, eight, 12, 16, but holy God, like you have like a weird VM with like a whole bunch of cores in one socket, then the advice to not set maxed up there kind of makes less sense because then you still have one query that can use a whole bunch of cores in that socket. Right. And you have more than one socket. People like, OK, well, just set it to, you know, the number of cores in a single Numa node up to eight.
And you can just kind of leave it alone after that. It’s fine. And for cost threshold for parallelism, the advice is to start at any number higher than five, like 20, 50, 75, just some number that’s for the love of God, not five. And then you can tweak from there kind of based on like the how you see queries running. Now you can maybe raise it up a little, pull it down a little bit. That’s up to you. That’s a very personal thing.
But that’s one of those things that kind of makes setting it not as easy as the the line where you want to draw. OK, I want queries this expensive to go parallel. It’s going to be way different from environment to environment. But that device is probably usually mostly fine.
But where you can kind of get screwed, and this is true for any environment, you know, if all your queries and indexes are just so horribly untuned that they all have this astronomical cost, then like setting cost threshold for parallelism for like 5000 might not even get you all that much. Like you might just have these terrible queries that just run with like a very high cost constantly.
And they’re just going to go parallel, like almost up to this crazy point. Like unless you set max stop don’t wonder, set cost threshold for parallelism to like the maximum value. You just might never get rid of those queries going parallel.
And if all your queries are just like big, huge joins across lots and lots of tables, max stop is going to be really hard to set too. Now, of course, these things do get more complicated, like even beyond that, if you start looking at like, you know, if you have a bunch of users connecting, and like they’re all doing really like doing things of really, really high concurrency, or if you have like an AG or mirroring with like a bunch of like thousands of databases or something in it, and they’re all synchronizing data because that takes up a bunch of worker threads too.
But let’s get back to just sort of a basic thing at the query level. Now on my laptop, I have eight cores visible to SQL Server, which means I have 576 worker threads. You can see that number right there. 576.
Right? So I like at any point I can run like 576 serial queries, probably, or like, you know, some divisor of parallel queries depending on how many threads they get. Now over in this window, I’ve got some interesting stuff going on.
I ran a bunch of really big queries, right? Like joining a whole bunch of tables together. And I’ve run them at different max stops. I got a max stop two.
I got a max stop four. I got a max stop six. I got a max stop eight down here, which is the highest I can go up to with it before SQL is just like, okay, you’re drunk. We can’t use more dots than we have. Right?
That’d be silly. Now, here’s where setting max stop gets weird. If we start looking at the timing differences between these queries, this one here at max stop two, that takes about 120 seconds. If we scroll down to the one that runs at max stop four, we’re down to about 42 seconds, which is a big jump from max stop two to four, right?
120 to 42. That’s a huge jump. If I were as an end user, I’d be like, sweet.
Good job, query tuning. Thanks for that. We go to max stop six, we get down to 31 seconds. And if we get to, when we get down to max stop eight, we’re at about 30 seconds. So not a big difference between six and eight, but you know, just a little, little difference.
And this is why it’s tricky. So at some point you have to sacrifice the number of queries that you want to run simultaneously for how fast you want them to run. So right now with the way my laptop is set up with the 576 threads, I could run 18 queries that use 32 threads.
I could run 24 queries that use 24 threads. I could run 36 queries that use 16 threads. And I can run 17 queries that use eight threads.
And now you’re thinking, well, max stop two, you only use two threads. And that’s why you’re wrong. You’re so wrong. And I’m going to show you why you’re wrong. Now in the actual execution plans for all of these, there’s a helpful little doodad.
If you hit F4 and you look at the select operator and you scroll down a little bit, you come to this part of the properties called thread stat. And thread stat is going to give you some interesting information. So for this one query, I had four branches in this query.
That means there were four branches that SQL Server said, oh, you could run at the exact same time. So that’s four branches that can run in parallel concurrently. And for each of those branches, I got two threads.
So I two times four is eight. Right. And you can see that I reserved eight threads and I used eight threads for this one query at max stop two. So we see that max stop doesn’t limit the number of threads that you get.
Max stop limits the number of threads per concurrent parallel branch that you get. I know, right? Crappy.
If we scroll down to the max stop four query and we look at that same thing. Now for our four branches, we got four threads per branch and now we’re reserving 16 threads. So this is where we just made a jump from being able to run 32, 72 queries simultaneously to being able to run 36 queries simultaneously.
And that’s a pretty big jump because that’s like, like half. And you can probably imagine that if we scroll down to the max stop six query, our brand, our thread usage is going to go up to 24. So now if we have 24 of these, I can only run 24 of them.
I can have 24 instances of this query running at once before I start running out of worker threads to use. And I know because you’re good at math. You’re better at math than I am.
If we scroll down to this last query and we look at the thread stat usage for four branches, we’re now up to using 32 threads. I wasn’t just making those numbers up. I was serious.
So what happens after you have 18 instances of this query running at once? Let’s say that, you know, 18 users log in and when they log in, this query runs to give them some information. What happens when user 19 logs in?
You do not have any more worker threads to give to user 19. And user 19 has to wait for all of these other queries to finish before it can take, it says, I would like to reserve 32 threads, please. And SQL Server says, well, you have to wait for those 32.
You can use less if it’s emergency. Well, you could wait for 32. So that’s what’s called thread pool. And that’s when SQL Server does plum runs out of worker threads to give to new queries.
And that’s why I think that when you’re going to, you know, make changes to settings like maxed up and cost resh over parallelism, the starting point advice is better than the defaults, 100% better than the defaults. But at some point when you need to tune a highly concurrent workload, you need to look at things a little bit more closely.
You need to say, okay, well, you know, when queries go big and crazy and they start running, well, you know, we get lots of thread pool weights because we have lots of queries that are trying to reserve lots of threads and go. And so that’s when, you know, making those settings changes is like lowering maxed up or raising cost threshold can be beneficial. But at the same time, you’re looking at possibly regressing query performance, right?
If you change maxed up from six to four or four to two, there’s some pretty big changes in how long those queries ran for. Users might not be so happy with you. So it’s a very, very careful thing you have to balance.
And at some point, query and index tuning does have to come into the picture. Anyway, that’s just a quick video because I was bored on a, I don’t know what day it is. I think my vitamin K said it was Thursday.
So I’m going to guess it’s Thursday. I might be wrong though. Anyway, I’m Erik Darling again with Erik Darling data. You can, I don’t know if you, if you’re watching this, you can probably figure out where to find me.
Anyway, thank you for, thank you for watching. I hope you learned something. Hope you had some fun and I will see you next time. Hopefully.
I hope I get to record more videos. If I don’t, I’ll be pretty sad. All right. Computer don’t fail me now. Thanks for watching.
Going Further
If this is the kind of SQL Server stuff you love learning about, you’ll love my training. Blog readers get 25% off the Everything Bundle — over 100 hours of performance tuning content. Need hands-on help? I offer consulting engagements from targeted investigations to ongoing retainers. Want a quick sanity check before committing to a full engagement? Schedule a call — no commitment required.
 I set Max Server Memory to 8000 MB and executed two queries with a maximum allowed memory grant of 60% via Resource Governor. The first query finished in about 40 seconds. The second query hasn’t finished after 30 minutes. During those 30 minutes the second query has only used 1184 ms of CPU time. The COLUMNSTORE_BUILD_THROTTLE wait type shows up in sys.dm_os_waiting_tasks:
 Execution context id 2 is waiting on execution context id 1 with a wait type of HTDELETE. Execution context id 1 has a wait type of COLUMNSTORE_BUILD_THROTTLE. I don’t think that this wait is supposed to show up for parallel inserts. It can show up by design when creating or rebuilding a columnstore index in parallel: