In this video, I share a performance tuning shortcut that came in handy during a recent client project. When working with complex queries involving scalar-valued functions, sometimes the best approach is not to rewrite everything from scratch but to take a “band-aid” route. By temporarily removing these functions and dumping the data into a temporary table, we can significantly improve query performance without losing functionality. This method allows us to run our big, complex queries faster while still applying necessary formatting later on, ensuring that scalar-valued functions don’t hinder overall performance. It’s a practical solution for those of us who need quick wins in SQL Server tuning until more comprehensive optimizations can be implemented.
Full Transcript
Howdy folks, Erik Darling here with the old Erik Darling data. And I want to show you a kind of a funny little performance tuning shortcut that actually came in handy earlier this week. Now, when I’m working with clients, my job is to get them the fastest possible solution to their problem that, you know, that it’s like possible, right? So it’s like, some times I can touch more stuff than others. Other times I can touch less stuff than others. Either way, my job is to get people moving faster in a hurry. Sometimes, like, you know, in a perfect world, we can all take a lot of time to perfectly tune this, that, and the other thing to change, you know, functions and indexes and queries all over the place to get the perfect code. Other times, it’s, we can take what I like to call the band-aid route and we can put a band-aid on it. That gets us to a much, much better place for now until we can get to that wonderful Arcadian pasture that is perfect performance. I know, right? So what I’m going to show you is something that came in handy earlier this week. When I was tuning, it was a much bigger query than the one you’re looking at on the screen. It was a big tangle with, like, a 500-line where clause and all this other stuff.
And there’s a lot of complex stuff going on, even in the select case expressions and whatnot. But what it came down to was that there were a bunch of functions. Now, in the query that I’m looking at, I only have one function, and it’s called initial cap. And it does exactly what it sounds like. It’ll take a string, and it’ll make the first letter a capital, and it’ll make any letter after a space a capital. It’s a scalar valued function. And while we’re all breathlessly awaiting these things not sucking in SQL Server 2019, there are a whole heck of a lot of us who have to deal with versions of SQL Server that do not have the magic of Freud. Now, the real query that I dealt with had a bunch of formatting functions in it.
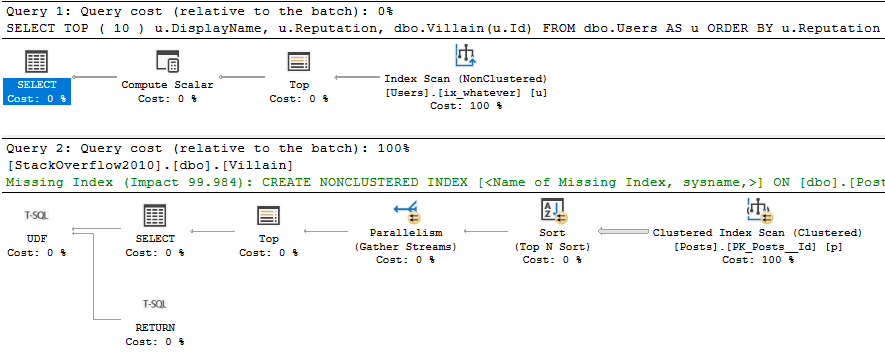
So, like, there were a whole bunch of things that formatted, like, phone numbers and postal codes and dates and all this other crazy stuff. And I know what you’re thinking. You can’t just, like, use convert to formatted date? No, apparently not. Apparently, you need to scale our valued function to do that. So, rather than sit there and rewrite every single function and mess with logic and results, here’s what I did. Now, I’m going to show you exactly how this reproduces with this query. I’m going to turn on query plans, and I’m going to fire this thing off. And this thing is going to run for around about 11 or 12 seconds.
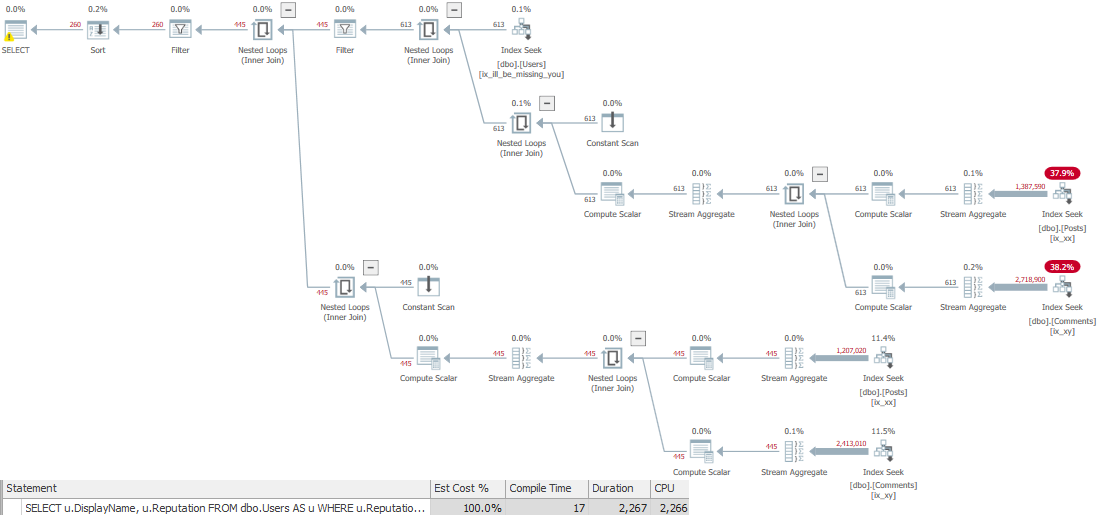
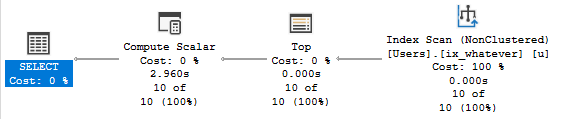
And part of the problem with the way this query runs is that because of this scalar value function in there, it’s forced to run serially. Now, another problem that scalar valued functions have is that they run once per row, not once per query. We can kind of see that if we look in the query plan and we look at this compute scalar operator.
If we hit F4 here, we can see that this is where that init cap function gets called. All right? So, that’s where we do it. But we do it at the very end. And we only do this over 500 rows. So, this function running 500 times isn’t going to be a big deal.
What’s a much, much bigger deal for this query is that it’s forced to run serially. If we look at the properties of the select operator, we have this non-parallel plan reason could not generate valid parallel plan. This started in the SQL Server 2012 plan XML. This would start showing up in there.
So, if you’re on 2008 or 2008 R2, you’re not going to see this. If you’re on 2012 plus, you will see that if you have some construct in your query plan forcing things to run serially. Now, since there were a bunch of functions in the actual code that I was tuning, what I decided to do was, rather than spend my time and waste someone’s money rewriting a bunch of functions and trying to toggle with indexes and this, that, and the other thing, I just wanted to see how the query ran if I took the functions out.
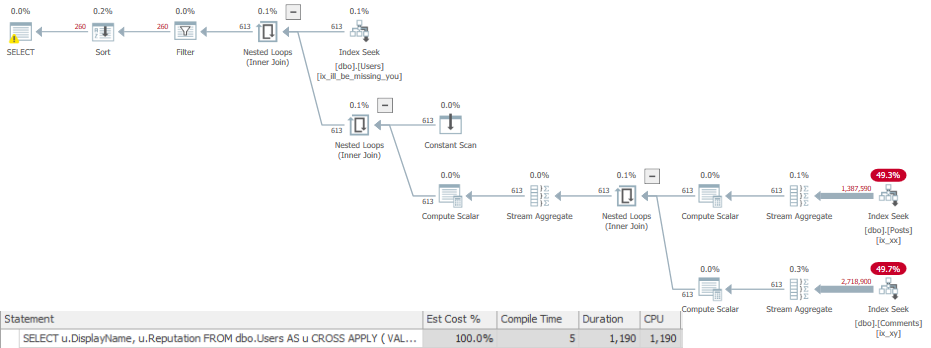
And that’s what I did in this query right here below it. Is rather than have a reference to the formatted display name, I just have the display name. So, I quoted out the functions and I kept the columns in that the functions were formatting.
And, oops, I hit F5, but I highlighted the whole thing as a professional query performance tuner. I cannot impress upon you enough the importance of highlighting the entire query. So, I highlighted the entire, in real life, I highlighted the entire query.
And I hit F5, and it ran much faster. That finished in 2 seconds, rather than, what, 12 seconds or something? Yeah, it took 12 seconds.
So, we improved this query by 10 seconds, just by not having the scalar function in there. Of course, the reason this query runs much faster isn’t because that function did anything so heinous. It’s because this query was allowed to go parallel.
So, now that we have all this parallelism going on in here, the root query finishes much faster. Now, there are a lot of caveats, and I’m not saying that a query going parallel is always a good thing, or that you should have as many queries going parallel at once as possible, because that has effects on concurrency, how many threads get used by queries, how many threads get used by overall workload.
But, in this case, it didn’t hurt too much. So, what I did is I took that query, and I said, well, you know what? This query gets us close to what we need. We just need to format that data at some point.
And I’m going to tell you something about scalar valued functions. In small doses, they’re not that bad. In small doses, they’re okay.
They’re not too terrible, which I know is not a great thing to say. Everyone’s just going to come up with torches and pitforks and tell me that scalar valued functions are the devil. And a lot of the times, I’ll agree with them.
But in this case, where we’re just formatting data, the scalar valued functions aren’t going out to other tables and doing all sorts of other crazy things. We’re just formatting some data in place.
Well, that still will suck, but we can make it suck a whole lot less if we don’t let it impact our big queries and if we only do it on a limited number of rows later. So, what we can do, and this is a trick that you can try out, is if you have your big queries and lots of scalar valued functions in them, you don’t want to rewrite a bunch of scalar valued functions and have a whole bunch of awful things.
I get it. It’s hard. It’s daunting. But what you can do is you can take your big, mean, nasty, awful queries, and you can dump them into a temp table.
And the dump into a temp table will still take about two seconds to finish. All right. So, that still takes, you know, a couple seconds to get the data into the temp table, but it’s a lot faster than the 12 seconds that we waited for when we just needed to select all the data.
And then after we have data in a temp table, well, now we can just call our functions on what’s remaining. So, now if I hit F5 here, well, that finishes just about as quick as you could want it to finish. So, we still have, like, the old, like, we still have a big query that we have to run and do stuff with, but that query isn’t impacted by the side effects of scalar valued functions.
So, that’s one way to kind of skirt around the issue and then get the data that, get whatever the scalar valued functions need to do at a later point. Anyway, I thought that I would share that with you in video form because I care about you and I care about the health and well-being.
No, I’m kidding. Yeah. No. No. Good luck. Good luck. I wish you luck out there. Anyway, I’m Erik Darling.
Thanks for watching. I hope you learned something. I hope you enjoyed yourselves. And I will see you in some other video some other time. Goodbye. Bye. Bye.
Video Summary
In this video, I share a performance tuning shortcut that came in handy during a recent client project. When working with complex queries involving scalar-valued functions, sometimes the best approach is not to rewrite everything from scratch but to take a “band-aid” route. By temporarily removing these functions and dumping the data into a temporary table, we can significantly improve query performance without losing functionality. This method allows us to run our big, complex queries faster while still applying necessary formatting later on, ensuring that scalar-valued functions don’t hinder overall performance. It’s a practical solution for those of us who need quick wins in SQL Server tuning until more comprehensive optimizations can be implemented.
Full Transcript
Howdy folks, Erik Darling here with the old Erik Darling data. And I want to show you a kind of a funny little performance tuning shortcut that actually came in handy earlier this week. Now, when I’m working with clients, my job is to get them the fastest possible solution to their problem that, you know, that it’s like possible, right? So it’s like, some times I can touch more stuff than others. Other times I can touch less stuff than others. Either way, my job is to get people moving faster in a hurry. Sometimes, like, you know, in a perfect world, we can all take a lot of time to perfectly tune this, that, and the other thing to change, you know, functions and indexes and queries all over the place to get the perfect code. Other times, it’s, we can take what I like to call the band-aid route and we can put a band-aid on it. That gets us to a much, much better place for now until we can get to that wonderful Arcadian pasture that is perfect performance. I know, right? So what I’m going to show you is something that came in handy earlier this week. When I was tuning, it was a much bigger query than the one you’re looking at on the screen. It was a big tangle with, like, a 500-line where clause and all this other stuff.
And there’s a lot of complex stuff going on, even in the select case expressions and whatnot. But what it came down to was that there were a bunch of functions. Now, in the query that I’m looking at, I only have one function, and it’s called initial cap. And it does exactly what it sounds like. It’ll take a string, and it’ll make the first letter a capital, and it’ll make any letter after a space a capital. It’s a scalar valued function. And while we’re all breathlessly awaiting these things not sucking in SQL Server 2019, there are a whole heck of a lot of us who have to deal with versions of SQL Server that do not have the magic of Freud. Now, the real query that I dealt with had a bunch of formatting functions in it.
So, like, there were a whole bunch of things that formatted, like, phone numbers and postal codes and dates and all this other crazy stuff. And I know what you’re thinking. You can’t just, like, use convert to formatted date? No, apparently not. Apparently, you need to scale our valued function to do that. So, rather than sit there and rewrite every single function and mess with logic and results, here’s what I did. Now, I’m going to show you exactly how this reproduces with this query. I’m going to turn on query plans, and I’m going to fire this thing off. And this thing is going to run for around about 11 or 12 seconds.
And part of the problem with the way this query runs is that because of this scalar value function in there, it’s forced to run serially. Now, another problem that scalar valued functions have is that they run once per row, not once per query. We can kind of see that if we look in the query plan and we look at this compute scalar operator.
If we hit F4 here, we can see that this is where that init cap function gets called. All right? So, that’s where we do it. But we do it at the very end. And we only do this over 500 rows. So, this function running 500 times isn’t going to be a big deal.
What’s a much, much bigger deal for this query is that it’s forced to run serially. If we look at the properties of the select operator, we have this non-parallel plan reason could not generate valid parallel plan. This started in the SQL Server 2012 plan XML. This would start showing up in there.
So, if you’re on 2008 or 2008 R2, you’re not going to see this. If you’re on 2012 plus, you will see that if you have some construct in your query plan forcing things to run serially. Now, since there were a bunch of functions in the actual code that I was tuning, what I decided to do was, rather than spend my time and waste someone’s money rewriting a bunch of functions and trying to toggle with indexes and this, that, and the other thing, I just wanted to see how the query ran if I took the functions out.
And that’s what I did in this query right here below it. Is rather than have a reference to the formatted display name, I just have the display name. So, I quoted out the functions and I kept the columns in that the functions were formatting.
And, oops, I hit F5, but I highlighted the whole thing as a professional query performance tuner. I cannot impress upon you enough the importance of highlighting the entire query. So, I highlighted the entire, in real life, I highlighted the entire query.
And I hit F5, and it ran much faster. That finished in 2 seconds, rather than, what, 12 seconds or something? Yeah, it took 12 seconds.
So, we improved this query by 10 seconds, just by not having the scalar function in there. Of course, the reason this query runs much faster isn’t because that function did anything so heinous. It’s because this query was allowed to go parallel.
So, now that we have all this parallelism going on in here, the root query finishes much faster. Now, there are a lot of caveats, and I’m not saying that a query going parallel is always a good thing, or that you should have as many queries going parallel at once as possible, because that has effects on concurrency, how many threads get used by queries, how many threads get used by overall workload.
But, in this case, it didn’t hurt too much. So, what I did is I took that query, and I said, well, you know what? This query gets us close to what we need. We just need to format that data at some point.
And I’m going to tell you something about scalar valued functions. In small doses, they’re not that bad. In small doses, they’re okay.
They’re not too terrible, which I know is not a great thing to say. Everyone’s just going to come up with torches and pitforks and tell me that scalar valued functions are the devil. And a lot of the times, I’ll agree with them.
But in this case, where we’re just formatting data, the scalar valued functions aren’t going out to other tables and doing all sorts of other crazy things. We’re just formatting some data in place.
Well, that still will suck, but we can make it suck a whole lot less if we don’t let it impact our big queries and if we only do it on a limited number of rows later. So, what we can do, and this is a trick that you can try out, is if you have your big queries and lots of scalar valued functions in them, you don’t want to rewrite a bunch of scalar valued functions and have a whole bunch of awful things.
I get it. It’s hard. It’s daunting. But what you can do is you can take your big, mean, nasty, awful queries, and you can dump them into a temp table.
And the dump into a temp table will still take about two seconds to finish. All right. So, that still takes, you know, a couple seconds to get the data into the temp table, but it’s a lot faster than the 12 seconds that we waited for when we just needed to select all the data.
And then after we have data in a temp table, well, now we can just call our functions on what’s remaining. So, now if I hit F5 here, well, that finishes just about as quick as you could want it to finish. So, we still have, like, the old, like, we still have a big query that we have to run and do stuff with, but that query isn’t impacted by the side effects of scalar valued functions.
So, that’s one way to kind of skirt around the issue and then get the data that, get whatever the scalar valued functions need to do at a later point. Anyway, I thought that I would share that with you in video form because I care about you and I care about the health and well-being.
No, I’m kidding. Yeah. No. No. Good luck. Good luck. I wish you luck out there. Anyway, I’m Erik Darling.
Thanks for watching. I hope you learned something. I hope you enjoyed yourselves. And I will see you in some other video some other time. Goodbye. Bye. Bye.
Going Further
If this is the kind of SQL Server stuff you love learning about, you’ll love my training. Blog readers get 25% off the Everything Bundle — over 100 hours of performance tuning content. Need hands-on help? I offer consulting engagements from targeted investigations to ongoing retainers. Want a quick sanity check before committing to a full engagement? Schedule a call — no commitment required.
In this video, I dive into the complexities of operator times and execution plans in SQL Server, particularly focusing on how they behave differently in batch mode versus row mode. I explain that while these new features are incredibly valuable for query performance tuning, there are some quirks that can make them confusing. For instance, I demonstrate how operator times are measured per operator in batch mode but add up along the plan in row mode, and how there’s no clear visual indicator of when a switch between modes occurs. By walking through these examples using SSMS 18, I aim to help you better understand and navigate these peculiarities, making your query tuning efforts more efficient.
Full Transcript
Howdy folks, Erik Darling here with Erik Darling Data. Still six months in I have managed not to fire myself which is amazing because I always considered me to be one of my most underperforming employees so it’s a real tribute to I guess nepotism that I haven’t fired myself yet. Anyway, I’m here to talk about operator times and execution plans. I want to talk about them because they can be really, really confusing. And hopefully me recording this video will help you understand exactly what’s going on with them. Now, they’re only available in SSMS 18. So if you aren’t using SSMS 18, I actually understand why because it’s really buggy. crashes more than normal SSMS. But this is a great new feature for especially unemployed query tuners who, you know, need to make a buck here and there, spare changing outside bodegas and, you know, trying to get some money up for a beer and a beer and a banana or something. But yeah, these things are weird and I’m going to try to explain why. Now, in SQL Server, well, I mean, 2019 CTP3 batch mode is generally available for rowstore queries. You could still see this in SQL Server 2017 or 16 or wherever else, you know, batch mode is available or wherever you have chosen to sneakily introduce batch mode into your rowstore queries with the temp table trick or with the filtered index trick. But anyway, this gets really odd. Now, the first thing I want to explain is that in batch mode plans, the timing is per operator. But there are two things that suck. One is that there’s no general indicator of which operators ran in batch mode. There’s one operator in this plan, that window aggregate that can only happen in batch mode. So we know that’s batch mode.
But if you look at the index scan, the sort, the compute scaler, the filter, any of those other operators, there’s no visual indicator that they happened in batch mode. The other thing that sucks is that there’s no visual indicator when we switch between row mode and batch mode. There’s nothing that says, there’s nothing that says, hey, like there’s no, there’s no, there’s no like little like interruption in the arrow or like, you know, little like, like, like little flippy sign that says, hey, that we switched here. We made it, we made an adjustment. Now, I’m going to show you why this is important. So I run this, I run this query, and this query does run for about four and a half seconds that that timing isn’t up for debate. That did happen in about four and a half seconds.
But what you’ll see across the bottom of the execution plan is that each, like the operator times for each one of those operators looks funky. They don’t add up. So this ran for 1.2 seconds, this ran for 2 seconds, this ran for 0.15 milliseconds, this ran for 0.9, 900 milliseconds, or 157 milliseconds, 900 milliseconds, 0.37 milliseconds.
So all of these are individual times. And if you add them up across the line, they’ll add up to about 4.3. But what gets weird is this is batch mode, right? So batch mode, this is batch mode. In fact, all of these are batch mode up to right here. Where they stop being batch mode is that this gather streams. This is row mode. And this top is also row mode.
There’s a difference between batch mode and row mode here. And the way that these operator times operate. And that is, for batch mode, it’s per operator. For row mode, it adds up along the plan. I know that sounds confusing, so I’m going to change this query slightly and rerun it. And I’m going to show you the difference. So remember what this looks like. Each one of these operators does a thing, and we measure that thing separately until we get to the row mode part.
And the row mode part reflects an adding up of everything here, right? So when we get to that gather streams, we’re adding up all of the child operator times. Prior to that in batch mode, each operator time is individual. Now I’m going to run, I’m going to change the query a little bit, and I’m going to rerun it. And this is going to execute fully in row mode. So this index seek is row mode, this source row mode, segment’s row mode, this is row mode.
Nested loops, of course, is row mode. I wish bash mode nested loops would become a thing, but it just hasn’t yet. But what the difference here is that when we look across these query times, or when we look across these operator times, they add up. So we have 1.04, 1.84, 1.99, 2.16, 2.33, go up here to 2.6, 2.65.
They add up as we go across, right? So that top operator reflects adding up all of the child operators together because they’re all row mode, right? So each row mode operator is a reflection of it and whatever time the operator or operators before it took.
So if that’s not confusing enough, again, like I was saying, when operators in a plan might switch between batch and row mode, we don’t have an indicator of when that happens, right? So in a really complicated plan where there might be a lot of switches, this might be even harder to try and figure out. So rather than me saying, well, you need to get your times right, I think it just might be easier for us as query tuning people to have a visual indicator of when an operator is in batch mode and or when we flip or even if we had like a visual indicator of when we switch between batch and row mode.
Like maybe the arrow gets interrupted, maybe there’s something between the operators, like a little swirly thing that says, hey, we switched here. So you could at least have an indicator that one thing was batch or row mode and the other thing made a switch to batch or row mode from whatever the previous operator was. Another place where this can get kind of confusing is in plans that look like this.
Now, this plan is all row mode. All of these operators are row mode. There is no batch mode happening in any of these, I promise you. But what happens is at the very end, gather streams, finish it.
Well, it says 11.242, but that nested loop says 11.499. So where these pretty accurately add up across the whole thing, they sort of get funky at the gather streams. So gather streams says it finished about, I don’t know, 300 or so milliseconds before the nested loops did, which is a little awkward.
Again, this isn’t like a big query tuning dilemma. It’s just sort of an oddity. And it’s happened across multiple queries for me.
I have another example of it happening over here where, again, all of this stuff happens. Well, I can’t say that’s entirely true. Anyway, all of this stuff happens in row mode.
Where it’s supposed to add up, it doesn’t quite add up because we have this oddity over here where the hash join says that it finished in 5.572 seconds. And then the gather stream says it finished in 5.132 seconds. This is also a little bit of a weird plan because even though it’s in row mode, at least last I checked it was all in row mode.
Who knows what happens between runs? It looks like it’s still in row mode to me. But this stream aggregate.
So these two operators are killing me. So we have this stream aggregate that ran in 1.83. And then this repartition streams that ran in 1.73. So this was supposed to add up, but it didn’t add up for some reason.
So that’s another thing that’s kind of odd. Sometimes, despite your best efforts to understand these things, you run a demo and then you look a little more closely while you’re recording a video. And you spot something even stranger.
So now I have to go figure out just what that was about. But that’s going to require a lot of day drinking. So I need to go get started on that. Anyway, I do think this is incredibly valuable.
As query performance tuners, usually when we’re looking at an execution plan, it’s a lot of guesswork as to, okay, let’s figure out what went wrong here. Let’s figure out what we need to focus on. Let’s figure out what’s bad.
This does help us focus quite a bit of our efforts on, okay, which operator really did take a long time to run? What’s sticking out like that awful sore thumb? Anyway, I’m Erik Darling with Erik Darling Data.
Still haven’t fired myself, and I will see you around in another video when it’s less hot and wearing headphones doesn’t make my ears sweat. Have a lovely Saturday. Can you talk to me today?
Have a lovely night. Hi. Hi. Thank you.
Video Summary
In this video, I dive into the complexities of operator times and execution plans in SQL Server, particularly focusing on how they behave differently in batch mode versus row mode. I explain that while these new features are incredibly valuable for query performance tuning, there are some quirks that can make them confusing. For instance, I demonstrate how operator times are measured per operator in batch mode but add up along the plan in row mode, and how there’s no clear visual indicator of when a switch between modes occurs. By walking through these examples using SSMS 18, I aim to help you better understand and navigate these peculiarities, making your query tuning efforts more efficient.
Full Transcript
Howdy folks, Erik Darling here with Erik Darling Data. Still six months in I have managed not to fire myself which is amazing because I always considered me to be one of my most underperforming employees so it’s a real tribute to I guess nepotism that I haven’t fired myself yet. Anyway, I’m here to talk about operator times and execution plans. I want to talk about them because they can be really, really confusing. And hopefully me recording this video will help you understand exactly what’s going on with them. Now, they’re only available in SSMS 18. So if you aren’t using SSMS 18, I actually understand why because it’s really buggy. crashes more than normal SSMS. But this is a great new feature for especially unemployed query tuners who, you know, need to make a buck here and there, spare changing outside bodegas and, you know, trying to get some money up for a beer and a beer and a banana or something. But yeah, these things are weird and I’m going to try to explain why. Now, in SQL Server, well, I mean, 2019 CTP3 batch mode is generally available for rowstore queries. You could still see this in SQL Server 2017 or 16 or wherever else, you know, batch mode is available or wherever you have chosen to sneakily introduce batch mode into your rowstore queries with the temp table trick or with the filtered index trick. But anyway, this gets really odd. Now, the first thing I want to explain is that in batch mode plans, the timing is per operator. But there are two things that suck. One is that there’s no general indicator of which operators ran in batch mode. There’s one operator in this plan, that window aggregate that can only happen in batch mode. So we know that’s batch mode.
But if you look at the index scan, the sort, the compute scaler, the filter, any of those other operators, there’s no visual indicator that they happened in batch mode. The other thing that sucks is that there’s no visual indicator when we switch between row mode and batch mode. There’s nothing that says, there’s nothing that says, hey, like there’s no, there’s no, there’s no like little like interruption in the arrow or like, you know, little like, like, like little flippy sign that says, hey, that we switched here. We made it, we made an adjustment. Now, I’m going to show you why this is important. So I run this, I run this query, and this query does run for about four and a half seconds that that timing isn’t up for debate. That did happen in about four and a half seconds.
But what you’ll see across the bottom of the execution plan is that each, like the operator times for each one of those operators looks funky. They don’t add up. So this ran for 1.2 seconds, this ran for 2 seconds, this ran for 0.15 milliseconds, this ran for 0.9, 900 milliseconds, or 157 milliseconds, 900 milliseconds, 0.37 milliseconds.
So all of these are individual times. And if you add them up across the line, they’ll add up to about 4.3. But what gets weird is this is batch mode, right? So batch mode, this is batch mode. In fact, all of these are batch mode up to right here. Where they stop being batch mode is that this gather streams. This is row mode. And this top is also row mode.
There’s a difference between batch mode and row mode here. And the way that these operator times operate. And that is, for batch mode, it’s per operator. For row mode, it adds up along the plan. I know that sounds confusing, so I’m going to change this query slightly and rerun it. And I’m going to show you the difference. So remember what this looks like. Each one of these operators does a thing, and we measure that thing separately until we get to the row mode part.
And the row mode part reflects an adding up of everything here, right? So when we get to that gather streams, we’re adding up all of the child operator times. Prior to that in batch mode, each operator time is individual. Now I’m going to run, I’m going to change the query a little bit, and I’m going to rerun it. And this is going to execute fully in row mode. So this index seek is row mode, this source row mode, segment’s row mode, this is row mode.
Nested loops, of course, is row mode. I wish bash mode nested loops would become a thing, but it just hasn’t yet. But what the difference here is that when we look across these query times, or when we look across these operator times, they add up. So we have 1.04, 1.84, 1.99, 2.16, 2.33, go up here to 2.6, 2.65.
They add up as we go across, right? So that top operator reflects adding up all of the child operators together because they’re all row mode, right? So each row mode operator is a reflection of it and whatever time the operator or operators before it took.
So if that’s not confusing enough, again, like I was saying, when operators in a plan might switch between batch and row mode, we don’t have an indicator of when that happens, right? So in a really complicated plan where there might be a lot of switches, this might be even harder to try and figure out. So rather than me saying, well, you need to get your times right, I think it just might be easier for us as query tuning people to have a visual indicator of when an operator is in batch mode and or when we flip or even if we had like a visual indicator of when we switch between batch and row mode.
Like maybe the arrow gets interrupted, maybe there’s something between the operators, like a little swirly thing that says, hey, we switched here. So you could at least have an indicator that one thing was batch or row mode and the other thing made a switch to batch or row mode from whatever the previous operator was. Another place where this can get kind of confusing is in plans that look like this.
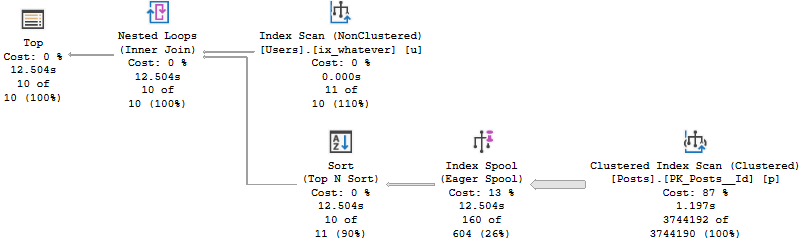
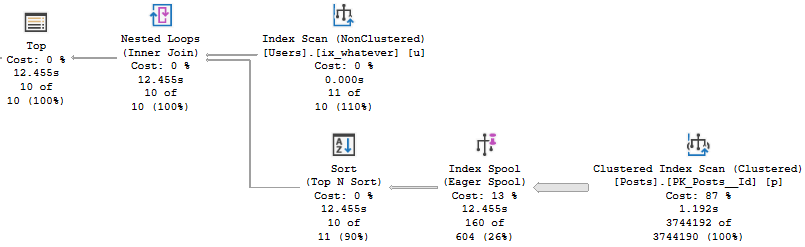
Now, this plan is all row mode. All of these operators are row mode. There is no batch mode happening in any of these, I promise you. But what happens is at the very end, gather streams, finish it.
Well, it says 11.242, but that nested loop says 11.499. So where these pretty accurately add up across the whole thing, they sort of get funky at the gather streams. So gather streams says it finished about, I don’t know, 300 or so milliseconds before the nested loops did, which is a little awkward.
Again, this isn’t like a big query tuning dilemma. It’s just sort of an oddity. And it’s happened across multiple queries for me.
I have another example of it happening over here where, again, all of this stuff happens. Well, I can’t say that’s entirely true. Anyway, all of this stuff happens in row mode.
Where it’s supposed to add up, it doesn’t quite add up because we have this oddity over here where the hash join says that it finished in 5.572 seconds. And then the gather stream says it finished in 5.132 seconds. This is also a little bit of a weird plan because even though it’s in row mode, at least last I checked it was all in row mode.
Who knows what happens between runs? It looks like it’s still in row mode to me. But this stream aggregate.
So these two operators are killing me. So we have this stream aggregate that ran in 1.83. And then this repartition streams that ran in 1.73. So this was supposed to add up, but it didn’t add up for some reason.
So that’s another thing that’s kind of odd. Sometimes, despite your best efforts to understand these things, you run a demo and then you look a little more closely while you’re recording a video. And you spot something even stranger.
So now I have to go figure out just what that was about. But that’s going to require a lot of day drinking. So I need to go get started on that. Anyway, I do think this is incredibly valuable.
As query performance tuners, usually when we’re looking at an execution plan, it’s a lot of guesswork as to, okay, let’s figure out what went wrong here. Let’s figure out what we need to focus on. Let’s figure out what’s bad.
This does help us focus quite a bit of our efforts on, okay, which operator really did take a long time to run? What’s sticking out like that awful sore thumb? Anyway, I’m Erik Darling with Erik Darling Data.
Still haven’t fired myself, and I will see you around in another video when it’s less hot and wearing headphones doesn’t make my ears sweat. Have a lovely Saturday. Can you talk to me today?
Have a lovely night. Hi. Hi. Thank you.
Going Further
If this is the kind of SQL Server stuff you love learning about, you’ll love my training. Blog readers get 25% off the Everything Bundle — over 100 hours of performance tuning content. Need hands-on help? I offer consulting engagements from targeted investigations to ongoing retainers. Want a quick sanity check before committing to a full engagement? Schedule a call — no commitment required.
In this video, I delve into a critical issue related to QueryStore and its impact on CmemThread weights in SQL Server. Initially, my investigation led me to incorrectly attribute the problem to the plan cache, but further analysis revealed that it was actually due to QueryStore being enabled. I walk through setting up various configurations, including turning QueryStore on and off, optimizing for ad hoc workloads, and forcing parameterization, to demonstrate how these settings affect CmemThread weights and query store size. The video highlights the potential pitfalls of relying solely on QueryStore without proper management, emphasizing that optimized for ad hoc workloads does not address this specific issue. I also provide practical solutions and insights into managing query store effectively to avoid excessive memory grants and plan cache bloat.
Full Transcript
Hello! Erik Darling here with Erik Darling Data and I am here to apologize and make right on a video that I recorded yesterday about CmemThread and the plan cache. I was devastatingly, horribly, horribly wrong. And I didn’t realize it until later that I had a setting on on my server, on my laptop, on my database called QueryStore turned on. And the CmemThreadWeights were not the fault of the plan cache, they were the fault of QueryStore. And I’m going to show you exactly what happened. So right now, I’ve got some queries up on the screen. This query here will tell me if I have optimized for ad hoc workloads turned on, if I have parameterization set to forced or not, and the state of my QueryStore thing for the Stack Overflow 2013 database. I’ve also got some queries here to turn QueryStore on and off and to clear it out. So my capture mode is going to be read-write, my max storage size is going to be 100 megs, my capture mode is going to be auto, meaning I don’t capture absolutely everything. I only capture stuff that SQL Server thinks is important. And I’ve got size based cleanup mode turned on, meaning when QueryStore hits 100 megs, size based cleanup should kick in and clear everything right out. I’ve also got some queries here to look at how many cached plans I have, and to look at if I’m hitting CmemThreadWeights, and to look at the current size of QueryStore for the Stack Overflow 2013 database. I’ve got some other utility queries down here. This is to clear out the plan cache and to clear out weight stats on my server so that I can refresh things and between runs to show you differences. I’ve got my O stress command here set to run 20 copies of my randomizer store procedure, which I’ll talk to you about in a minute. And that does some stuff over there. And then I’ve also got queries to turn optimized for ad hoc workloads on and off and just set parameterization to simple and forced. My randomizer query looks like this. It grabs some weird values from the sys.messages table, six minute cursor, six minute cursor, and basically iterates over that cursor. And depending on what seed value this thing has, let me stick a semicolon there to make sure that I have everything correct. I would hate to not terminate a statement properly.
But depending on what number comes up here, I’m going to select from a different table in the Stack Overflow database, depending on that. So if it’s one, badges, two comments, three posts, four users, five votes. And I’m going to pass the two little funny values that I get from sys.messages up here, which looks something like this, into the end clause down here. So that’s what that randomizer store procedure does. It’s pretty simple. Pretty simple stuff, right? Good stuff there.
If we come back over here, what I’m going to do is I’m going to look at what I currently have going on. And in my data’s, various data’s, I have 169 plans in the cache. I have no seam emptied weights. And query store, because it’s off right now, has a size of zero megs. Now what I’m going to do with query store off, and this is to set up a baseline, clear that out.
And what I’m going to do is I’m going to kick off that O stress command, and I’m going to look at what happens. Now we’re running that query across 20 threads, just to simulate like, you know, sort of a heavy ad hoc workload. And as we hit F5 on these, the plans in the cache will start going up, and Cmem thread weights will stay relatively low.
Right now we have 10,000 plans in the cache and no Cmem thread. So if I keep running this and looking at things, I don’t know why that changed context, Tommy. That was a little bit weird. But if I keep running these, now I have 51,000 plans in the cache.
21 things have waited on Cmem thread, and that’s not a lot. I go over here and I keep running these. 80, about 73,000 plans in the cache. Still relatively low Cmem thread.
Only 70 things have waited. I’m not worried about this kind of Cmem thread weight. If I just keep doing this, Cmem thread is not going to go up a whole lot. That’s the baseline. That’s to show you that it’s not the plan cache’s fault that our ad hoc workload is generating a bunch of Cmem thread.
It’s not the plan cache. Whoever says it’s not the plan cache out there, I agree with you 100%. It’s not the plan cache’s fault. Now, I want to show you what happens that’s different when I turn query store on.
So I’m going to hit this, and I’m going to set query store to on for this database. And so we are now capturing data. If we go back up here and rerun this query, we will see that query store is set to read write.
And so the desired and the actual state are both in read write mode. So cool, we have query store turned on. We should be rocking and rolling at this point.
Let’s go rerun our workload again. F5 there. Not F5. Hit enter there. Sometimes I get confused.
But now when I start running this, Cmem thread weights are going to start jumping up really, really quickly. So I hit this, and we’re at 12,000 plans. And as we go up, Cmem thread weights are going to go up and up much faster than they do without query store turned on.
So you can see that I’m hitting some weights here. I’m already up to 1,000 Cmem thread weights. And you can see the size of query store steadily increasing.
We’re up to 63 megs. We’re up to 69 megs. And as we keep going up here, Cmem thread is going to keep increasing. Cmem thread is going to keep going up and up and up.
So this was not happening with the plan cache. This is only happening with query store turned on. So now I’m running all this stuff. Now we’re up to 4,200 Cmem thread weights. And now the query store size is bigger than the max size that I set it to.
If I keep hitting this, query store is going to keep getting bigger and bigger and bigger. And our Cmem thread weights are going to keep going up and up and up. Right now the current size of query store is 166, 173.
This is just going to keep going up. And Cmem thread weights are going to keep going up with it. Query store is now at about twice the max size that I set it to.
Size-based cleanup should be kicking in and clearing stuff out. I just don’t think it can keep up right now. So I’m sticking all these queries in.
I’m hitting this. And you can just see everything piling up. Query store is now nearly 250 megs. And Cmem thread weights keep on going up and up and up and up and up and up.
Now, this can be a real problem for a lot of people. If you have an ad hoc workload like this, you might be very concerned that, you know, the query store is going to overfill, that, you know, cleanup is never going to quite catch up.
And now you’re going to have all these funky Cmem thread weights going on in your server. At this point now, query store is nearly three times the size of the max size that I set it to. And cleanup doesn’t really seem to be doing its thing.
We’re getting up really close to 300 megs there. So what I’m going to do is I’m going to kill off of this. And I’m going to talk about a couple options that I thought I would walk through to try and fix this.
Now, the first one that I tried was optimized for ad hoc workloads. Now, if we look at, to turn optimized for ad hoc workloads on, if you’re in Azure SQL DB, you can do this with a database scope configuration.
If you’re on regular SQL Server, you can. It would be nice if that made it there. I tried it last night and I just kept getting errors. And then I looked more closely at the documentation. It was like, oh, yeah, only for Azure SQL DB.
So right now we can only turn this on at the server level for SQL Server 2017. So I’m going to do that. I’m going to turn on optimized for ad hoc workloads. And I’m going to give one more check-in up here to see what things look like.
And you’ll see that now that our query store size is nearly 400 megs, size-based cleanup is not doing its thing. So we’re going to do its job for it.
And hopefully this will work. Hopefully. We might be sitting here for a while. Oh, there we go.
That only took 13 seconds. Good for us. Okay. So let’s see how big query store is currently. All right. Zero megs. Good. We cleared all that stuff out. And let’s go check our stuff over here. So now we have optimized for ad hoc workloads turned on.
That is at 1. Sweet. Now, with that at 1, let’s go clear out all that stuff that we had before. And let’s check back in.
Let’s make sure our queries are returning close to zero. All right. So four plans in cache. I can live with that. That’s some system stuff going on in the background. See memthreads at zeros across the board. And query store is off.
So we’re at zero there. Because we have a baseline with the ad hoc, with the workload running without any special settings and see memthread being low, I’m not going to repeat it with query store off and ad hoc turned on.
There’s no point. That’s not helping us here. That’s not helping the effect that we’re having. The effect that we’re specifically having is that with query store turned on, we hit a lot of cmemthread weights.
So I’m going to turn query store back on. So now if we go check in on this, we should see query store set to read write. And we should see the value in use set to 1 for ad hoc workloads.
Okay. With that in place, let’s go back over here. Let’s hit F5. Let’s see. We have 10 plans in the cache now. Good heavens. We still have no cmemthread.
And, of course, query store size is zero. Because why would it be anything else? We just turned it back on. Let’s hit F5 there. Or enter or up arrow, enter or whatever you want to call it. Whatever.
O stress. And then I’m going to start running these. And when I run these, plans in the cache are going to start piling up. And so is cmemthread.
And so is the size of query store. And if I keep doing this and we keep looking at stuff. And, again, this just keeps bizarrely changing context on me. We’ll see kind of the same pattern start to happen.
Where my mouse refuses to click and work in the right way. I don’t know what it is. I’m going to stop spending $100 on mice that stop working after a few months. It’s pretty ridiculous.
But if I keep running these queries, we’re going to keep seeing. We’re going to see the number of plans in the cache pile up. We’re going to see the cmemthread weights pile up. And we’re going to see the size of query store just keep going up and getting bigger and bigger. The two important things to take away from here is that optimized for ad hoc workloads is not fixing this specific problem.
Where we’re hitting cmemthread weights. And the size of query store is going up way above the max that we set it at. Size-based cleanup is also not doing its job in cleaning this thing up fast enough.
So we’re actually facing the exact same problem. Optimize for ad hoc workloads isn’t helping us here. I’m not going to let that run for as long because we already know kind of what’s happening.
So let’s get rid of query store. We already killed our workload. Going to get that off. Okay, cool. Now let’s turn off optimized for ad hoc workloads. I want to make sure that I have a fresh start here.
And let’s turn on forced parameterization. So forced parameterization is turned on. And let’s clear out all of this stuff. And let’s see what we have here.
Oh, wrong button. It’s a morning of wrong buttons. All right. So four plans in the cache. No cmemthread weights. Query store is, of course, at zero megs because we have it turned off right now. So I’m going to go turn query store on.
Bada bing, bada boom. Let’s go make sure that we have all the stuff we want here. Perfect. So read, write, read, write. Parameterization is set to forced.
All right. Let’s check in on these numbers. Make sure we don’t have anything too weird. We don’t. Nine plans in the cache. No cmemthread. Query store is at zero because we just turned it on. And we’re going to go hit whatever damn, whatever you want to call that button, we’re going to hit it.
I’m going to run this thing. Run it. Come over here. Highlight you. And let’s start running this thing.
All right. So what we’re going to notice with forced parameterization turned on, at least if this demo works as it has worked all morning, which it very well may not. Who knows?
As soon as you’re recording, every bad thing happens. Everything goes wrong when you start recording. Anyway. So what we see here is the number of plans in the cache is skyrocketing. We’re up to 100 and something thousand, 157,000, but very low cmemthread.
The other thing I want you to notice is that the size of query store is zero megs. It’s not that we’re not collecting anything. It’s just that when SQL Server is doing a pretty good job of only putting one copy of the parameterized plan in there.
So as we go through and we look at this, we can see that query store size is not ballooning. Cmemthread weights are staying relatively low compared to other times when we ran this. But the number of plans in the cache is sort of astoundingly high.
Now, I’m going to keep running this. And basically what we’re going to see here is that forced parameterization does help us avoid the majority of the cmemthread weights and the ballooning size of query store. For some reason, that’s not helping us with the plan cache.
With the plan cache, we’re still not getting very good plan reuse. So that’s an issue, but that’s an issue for another day. This video is pretty specifically aimed at cmemthread weights as they relate to the query store and how big the query store gets and how it doesn’t clean up and all the other kind of crazy stuff.
I had a much, much worse time with this last night when I was originally running through the demo trying to get it worked out. At one point, query store was 700 megs, and the only way I could get it to turn off and clear out was by restarting my entire laptop. And that was not pleasant because in my head I’m thinking, my God, if you’re doing this in production, you don’t want to have to restart production just to get query store to clean out.
Anyway, my name’s Erik Darling, that one, with Erik Darling Data. And thank you for watching. I hope you got some useful information out of this.
And I will see you, I don’t know, maybe in a week or so because it’s the weekend and I feel like doing other things. Goodbye.
Going Further
If this is the kind of SQL Server stuff you love learning about, you’ll love my training. Blog readers get 25% off the Everything Bundle — over 100 hours of performance tuning content. Need hands-on help? I offer consulting engagements from targeted investigations to ongoing retainers. Want a quick sanity check before committing to a full engagement? Schedule a call — no commitment required.
Last week’s thrilling, stunning, flawless episode of whatever-you-wanna-call-it.
Video Summary
In this video, I dive into some of the challenges and quirks that come with working in SQL Server, particularly focusing on entity framework queries and parameter sniffing issues. I share my experiences dealing with an entity framework-heavy workload and discuss how custom types can sometimes cause more problems than they solve. The video also delves into a question from a DBA who is outnumbered by web developers using entity framework and struggling to balance their approach. I offer advice on supporting new developers while guiding them toward best practices, emphasizing the importance of letting people learn through experience. Additionally, I address live query plans, sharing my limited but positive experiences with them, especially in demos where they can help identify bottlenecks. The video concludes with a few miscellaneous questions and observations, including some humorous remarks about technology and personal quirks like waking up at 4 AM to watch videos.
Full Transcript
All right. So… apparently YouTube decided to change which microphone it would use for no reason. You know, why not? Why… why? why not just leave a good thing alone just mess with it right mess with it the fun thing is once you’re alive you can’t apparently switch which microphone you want to use you can hear me good wonderful apparently youtube’s definition of live is far different from my definition of live my definition of live is i can be seen and heard and poked and prodded and hugged and loved but according to youtube apparently if i’m just babbling to nothing i’m still live i don’t know why my my webcam has a microphone built in so at bare minimum you should have been able to hear extreme potato quality audio from me but now we’re we’re back here back with a good one all right so now that i’ve accomplished my mission you should accomplish your mission and ask a question any of you because i know i know that there are a lot of people out there who are varying degrees of new to sql server and you probably have really interesting fun questions and i’m willing to come come out here and and answer those questions in exchange for no upvotes whatsoever so that’s fun it’s fun i get no upvotes for this youtube thumbs don’t count they’re meaningless no one’s no one’s um uh no one’s gonna care about youtube thumbs up anyway i finally did get a question via another means over over the past week uh it’s from uh a dba who will remain anonymous from new zealand uh and they had they had a fun question and it’s it’s a question that actually strikes pretty close to home this week because uh i’ve been dealing with an entity framework heavy uh sql server workload and if i can tell you one thing about entity framework queries it’s that whatever mechanism generates those things was i mean it can really only have been conceived by satan himself there’s no other way to explain it ordering things by a row number rather than just saying order by a column doing a left self join left outer self join with a where clause that led to this weird row count spool like this the things that i’ve seen this week are baffling and what’s what’s even more fun is that because uh no one who uses entity framework has any self-control whatsoever they’ve managed to select every single column in every single table and so every memory grant is nine ten sometimes 15 gigs and only like 128 megs get used it’s like every time someone threatens me with a self-tuning database i i see entity framework queries and i’m like we’re going to europe next summer and the summer after that you can escape people will find the worst possible way to use a technology every single time i i just if you start designing your applications assuming that users are both stupid and malicious i’m a stupid user i will do dumb things and i will find weird things that happen when when people do dumb things like oh i’m kind of dumb so that makes sense but malicious users people like paul white will go out of their way to find bugs that you should have been smart enough to not not have in there in the first place so there’s that to look forward to anyway peter says custom type question i spammed at you in chat with that obvi parameter sniffing otherwise caused by local vars in a proc nope nope custom types uh don’t help they are just like and var cars or bar cars or whatever like when you make a custom type it’s quite often like you don’t want people messing with it i see this a lot in applications where um well actually in one particular application i see this quite a bit but the whole point is that you know they have very um strictly defined types for their data types and so they’ll create custom types that are like far car 11 or car 15 or in decimal 18 2 so that people when they need to like like uh operate with columns and tables that you know have have those that match up to those those uh those custom types they know exactly which one to use so no unfortunately oh boy there’s a bunch of emails coming in all right all right okay i gotta get rid of those don’t want you reading those emails in my glasses zooming in anyway uh so back to entity framework what a nightmare it is and all that other stuff uh a dba who will remain anonymous we’ll call him uh no let’s just say anonymous i like that one anonymous is okay by me i’m a dba in a small town in a small island country that is quite frequently left off maps because people forget it exists i watch your your uh your videos on saturday mornings but i don’t want to get up at 4 a.m to ask a question i understand i don’t want to get up at 4 a.m for anything yet i end up getting up at 4 a.m quite often i don’t know why no matter what time i go to bed i tend to wake up at 4 a.m and feel the urge to start working i think of something i want to do and i can’t fall back asleep anyway the question says i’m the only dba in a team working working on a team working with a team of eight web developers you sir are outnumbered in a terrible way and i i i just i don’t want to answer this question as much as i want to send you weapons i want to send you lawyers guns and money to fight off these these eight criminal elements uh but anyway he’s saying they use entity framework and store procedures so they don’t just beat the tar out of sql server with with entity framework queries there’s some some sanity involved here uh and the team is usually reasonable when it comes to changing over from entity framework to store procedures when it’s appropriate because there’s just no way to get any framework to do what you want it to do uh but there’s a new developer starting there’s a new kid in town and uh the new hire feels very strongly that as much of the database model as possible should be generated generated by entity framework he’s about to be responsible for redesigning one of our databases and i’m worried he will use this as a push for poorly designed entity framework generated database schemas and not be receptive to feedback i plan to discuss my concerns with the development team lead is this something you’d be concerned about well of course of course that’s something that i would be concerned about and it’s i would be but here’s the thing you need to let people fail you need to let people try and fail and you need to not sabotage them and you need to not root for them to fail but you need to be supportive when they do and that’s the only way that you’re going to get people over to your side which is a reasonable side that you know people that the entity framework is not a panacea for database problems entity framework is not the end-all be-all of working with the database it’s great for developers who don’t know sql and don’t want to learn sql and they just want the things that they put into code to show up in an application in a reasonable amount of time so with this new new person who’s going to redesign things you should be supportive if they want to if they want if that’s how that’s the road they want to go well sometimes the only lesson learned is through experience which is which is a shame but sometimes that’s the only way to do it i wouldn’t start off arguing with them i wouldn’t start off uh trying to dissuade them from things i would just i would let them work and make progress and if they hit road bumps be there to help them get over those bumps maybe show them a way to get over those bumps that’s not entity framework then who knows maybe maybe they’re an excellent developer maybe they are the world’s foremost entity framework developer on a small island nation that of that frequently gets forgotten from maps and maybe maybe they can do this whole thing without without you messing with them it’s an entirely plausible scenario. I mean, I know it’s not going to happen, but you know, whatever. Anyway, that’s my answer for it. I think that it’s going to be a, I mean, just don’t make it a touchy political issue. Just say it’s a technology issue. People have to be aware of the limits and the good uses and bad uses of a technology. And, you know, if they try to start square pegging stuff, just say they’re square pegging stuff. Help them out.
Help them come to a reasonable place in the world. That’s the way I’d do it, you know? Anyway. Someone else from a small island, from that same small island nation that frequently gets forgotten from maps has asked a question. How useful do you find live query plans?
Not so much. You know, I, I, I’ve never used a live query plan to troubleshoot a problem. Mostly because the people who I work with are not on a version of SQL Server that has live query plans in them. I, I would use them. The only time I’ve really used them to any great extent is locally when I’m trying to write a demo demo and I’ve wrote, I’ve written too good of a demo and it’s dragged on for like five minutes or so. And I’m thinking, well, what is this plan doing? Cause I want to see, I want to see what, what’s happening in here. And so I’ll rather like live query plans are pretty useful for just seeing like, okay, where, where are we held up here?
What, what do I need to do to make this demo a little less good? And, you know, that’s about where I stick with them. I re I really like the, the new management studio version 18 query plans because they have the, I mean, they don’t have, they don’t show you the query as it progresses.
Right. They’re not, you’re not seeing the plan. You’re not like you don’t hit F5 or whatever button combination you choose and see like the execution line doesn’t immediately pop up and start running. And you don’t see like rows as they flow through and do things. And as parts get completed, the little, little, the little line arrows turn into like solid. You don’t get all that.
You don’t, you don’t get all that. But when the, when the query is done, you do get, um, uh, you do get the final plan with mostly coherent operator times attached. Of course, if you, that varies a bit between row mode and batch mode. If you’ve watched my 10 minute video that, uh, a certain intergalactic celestial being from a small island nation that frequently gets left off maps had pointed out is well worth the 10 minutes of your time. Then you may be, maybe, maybe, maybe.
Well, no, no. Why? Uh, anyway, the thing I really hate about live query plans is how often they crash management studio, but that might not be a live, live query plan problem. That might be a management studio problem. Sometimes I’m like you hit it. You get the query running and then you hit cancel and you’d like, can’t do anything to that window.
If you try to close the window, management studio crashes. If you let it go, it’ll go on forever. And like you’ll wait until you restart. It’s a nightmare. Not, not my favorite way to spend time interacting with SQL Server management studio. God’s favorite 32 bit application. I hear, I hear management studio was God’s 30 favorite 32 bit application. Marcy asks, are you wearing Swannies? Marcy, I’m going to level with you.
I don’t know what a Swannies is. Enlighten me. What is a Swannies? Darren Scott says those scope identity in the where clause were from EF as well. Good heavens. One of my favorite things that I see in some applications is where, um, when you, uh, when certain people, so like if you have an application that needs to deal with people who access things from multiple sites, right? Like say you have sites A, B, and C. And you will have, uh, a column in the table that denotes site A, B, and C. And when different users connect in, they generate context information so that the application knows which site to point them to. And so none of the tables are directly referenced in the queries. Every single table is wrapped in a view with where column equals context info, the little context info function. So user, every single user before they touch it, like they have to get routed sort of via this function to which part of the table they should be looking at. It’s a very weird way to see things. Very strange. Anyway, uh, Paul something or other says people wouldn’t use EF if it weren’t for good stuff. Yeah. Would they? Yeah. I know a fair amount of people who use heroin. I mean, I know that’s an extreme example. I know a fair amount of people who like country music. That’s an even more extreme example. You know, a fair amount of people who wear flip-flops to walk around New York City.
Jandals, if you will, if you haven’t been wiped off the map yet. I know a fair amount of people who have made very, very dumb decisions in life. I have hand and neck tattoo. That was also a weird idea, weird choice. Anyway, what can you do? What can you do at this late stage? I can only go further. I can only wait for my mother to die so I can get face tattoos.
Otherwise she’d kill me. Let’s see. Forest, Forest of McDaniel says, when do you find CPU stats from query stats DMVs the least trustworthy? Before a query has finished. Soon nothing is there. It’s lying to you. I don’t know. I’ve never, I mean, I take, I take it all with a grain of salt. You know, I know when I write blog posts and when I write training material and, you know, talk about SQL Server generally, it’s, you know, you have to correlate things a little bit.
Right? Like you don’t want to just point to one thing and say, this is the God’s honest truth about what happened. You want to look at, like, I always want to look at a few different, this is why I’m such a big fan of new query plans, getting the operator times and the CPU time and all the other kind of cool lightweight profiling stuff that we’re getting in newer versions of SQL Server and management studio.
Because it gives you multiple sources of truth, right? You can multiple sources to check, to verify, to make sure that the thing you’re seeing holds up. All right? So there’s lots of different places that you can, you can look to validate things.
You know, it’s like, it, like, there’s no reason right now. There’s no, like, unless you, like, pull the crap out of that query profile DMV that does the live query plan thing, you can’t really validate, like, the per operator stuff too easily. You can validate, like, the overall plan time stuff pretty easily. But that’s, that’s, that’s about it.
But I, I really, I really like generally the, the amount of new feedback that we’re getting, even if it’s not all down to the microsecond or whatever new unit of time Microsoft has invented to measure things to confuse us. I hear that they’re going to invent satya seconds, which are sub nanoseconds that are only, they’re only, they’re only reliable to the closest microsecond.
That’s that. I don’t know. I think everything’s unreliable. Look, even YouTube’s unreliable. YouTube screwed me here.
Change my microphone over at the beginning of a webcast. Why would you do that? Why would you do that? I’d say audio settings have changed. Why? Dummies. Marcy says, Swanwick blue light blocking glasses. No, no. These are, these are Ray-Bans. They’re a little bit old. I should probably get a new pair of glasses soon. I just particularly like these.
I’ve grown used to them. I’ve grown fond to them on, on, on being on my face. Unlike this beard. This beard’s gone. No more of that. Max Vernon says, the tats lend a bit of a cachet. I bet people tend to listen to you in person.
I don’t know. It’s, it’s, it’s funny. Like when I was younger and I hung out with people who had tattoos, having more tattoos gave you like sort of weird social status. Right. If you had, like, if you have more tattoos on someone, you, you can be like, yeah, when are you going to get that tattoo?
Like, if I, like, I was able to do my neck tattoo, be like, well, when are you going to get your neck tattoo? Wimp, you know, like make point, like, I don’t see you with hand tattoos. What’s up with that? Right. Like, there’s like some of that, like now that I hang out, a bunch of people who like, you know, tuck their t-shirt into their underwear. The, the social, social ladder is all flipped around. I’m like no one in some of these conversations, you know, you get, you get a bunch of people sitting around a table and they want to talk about, you know, something other than the, the, the small chunk of query tuning that I enjoy.
No one’s listening to me. No one wants to hear me talk about containers. No one wants to hear me talk about availability groups. No one wants to hear me talk about taking backups. I don’t want to hear me talk about taking backups. You know how dull that is?
Ugh. Nothing to do with it. Let’s check TB scheduling. Get out of here. Talk to someone who cares. You know, the only time I care about that because.
Oh, screw it. There’s a, there’s another question here. What do you think about implicit conversions and plan warnings more generally? Well, golly and gosh. Eating a lot of dinner because of implicit conversions.
Can’t complain too much about those. A lot of dinners. A lot of dinners. A lot of wine because of implicit conversions. And I’m pretty sure you’ve gotten some wine because of implicit conversions. My friend. What do I think? What do I think? I mean, if, if someone, if, if you have people out in the world who can’t be bothered to, to match data types, like what, what, what, what help is there for them?
They like this pick something randomly and compare them to random things and compare them. Like, I want to know if this knife matches his pen. What do you tell those people? What can you tell them?
I want to know if this fork is a notebook. What do you tell them? There’s no sense. There’s no, if, if people are, are that dead set on not caring, I will happily take their money to tell them they should care. That’s it.
Plan warnings more generally. We get, we get warned about the wrong things. We get warnings. We get, first off, the, the, the, the implicit conversion warnings are sometimes full of dookie. Right?
Like if, like one example that I show when I talk about them is like, if you have an integer column and you say, like, select, I let’s, let’s call it ID. Select ID as VARCAR 10. You will get an implicit conversion warning saying that the cardinality estimate of your query is incorrect.
You’ll also get an implicit conversion warnings for seek plan when there’s no index that you could possibly seek into. Right? Like let’s just say that I have, for example, another column called reputation.
And I say, select star from users where reputation equals a variable that’s, and then VARCAR something. Right? And I don’t have an index on reputation. SQL Server will say, well, you could have done a seek plan, dummy. And you couldn’t because there was no index on it.
There was nothing for you to seek into. Nothing there. Another pet peeve is the no join predicate warning, which is that, would you get that big red, can you imagine the things that Microsoft should put a big red X over in query plans? Like every spool?
Like every single spool should just have a giant red X over it. But no, we get, we get warned when completely reasonably written queries with a join predicate. I say you don’t have a join predicate. Okay.
You win. And those memory grant warnings, which may affect the reliability of me to stay sober. Right? He’s like, you’re, you’re, you had a thousand and 24 KB memory grant and you only used 176 KB of it. May affect the reliability.
I love that. I love that sentence. You know what? If there’s one fragmentation that I worry about in SQL Server, it is, it is sentence fragmentation. And these warnings affect, it may impact the reliability. It’s just like, okay, tell me more.
Tell me more. I would love to hear more. Oh God. Where are some other ones? Where are some other funny ones? Oh boy. I don’t know.
I think spills are overrated. I think spills, I think, I don’t think you should get a spill warning unless you are like really spilling. You should. Yeah.
Unmatched indexes. That was a fun one. It was, it was fun to find out that if you have a plan that’s auto parameterized, you’ll get an unmatched index warning. When, even though, even if you use the index, like you can see the index being used in the plan. But if your plan is auto parameterized or simple parameterized, whatever you want to call it, you get a warning.
We couldn’t match that index to anything. But I see you. I see you. It’s aggravating.
Aggravating. It’s like, if you could, if you could go back and start over with like the query plan, XML. Hey, would you even use XML?
Use JSON. I would, I would much rather just get like a, like an MS paint. It’s like, give me a PNG of the plans. Don’t make me use the XML. It’s like, write everything down for me. Write everything down.
Marion asks if I think Paul is real. Well, he better be. Or else, someone else has my old laptop. As far as I know, he is. Yes, plans rendered by entity framework. That would be, that would be ideal.
Because then you would never get a query plan. And you would never be able to fix anything. And you would be able to happily learn how to do something else for a living. Go learn, go learn C sharp. Go learn, go write, write a great novel.
Go write the next great novel for your country. Where is it? Next great American novel, Canadian novel. New Zealand. I mean, let’s, no one in Australia is writing a novel. Get eaten by dingoes anyway.
Dingo ate my novel. I don’t know. I often think about what I would, things that I would much rather be doing than SQL Server. The list keeps growing long.
Fun. Marcy says, speaking of weird things and plans, is there a way to keep a detail pop-up open if I want to move my cursor to another screen? No.
No. Yes.
Of plan connecting lines and all that number of rose red malarkey. Yeah, that’s, you know. What bothers me is something that I learned from you about cash plans where they are just stitched together from many different plans. So, like, when you have a plan, you see, like, a plan in your plan cache or, like, an estimated plan where you have, like, thin lines and thin lines and thin lines.
And then you hit one operator and there’s a very, very thick line coming out of that operator for some reason. And the estimate goes from, like, three rows to, like, 40 billion rows. That’s just the optimizer being kooky.
Putting the plan in cache that might have been a few other plans stapled together. Dreadful. Marcy says, I don’t know how to get a screenshot of those. They disappear as soon as I click anywhere else, like on the snipping tool.
So, I use Snagit. S-N-A-G-I-T. I use Snagit. And when I have my cursor hovering over an operator so I get the tooltip, I can just hit the print screen button. And that’ll trigger the screenshotting of my screen.
And I can zoom in on the tooltip. Snagit is great for that. It’s well worth, I forget, like, 25 bucks or something. And then, like, the occasional maintenance contract so that you get updates. Well worth it.
The other upside of Snagit is that it has, like, all sorts, like, it has, like, an editor built in. So, you can do all sorts of cool stuff with things you take pictures of. You can, like, do, like, the crop where, like, you cut out, like, a certain part either horizontally or vertically. You can draw shapes.
They have the most accusatory built-in arrows. So, if you really want to call attention to something and be like, this sucks, the arrows they have are wonderful for that. Like, some of them, like, get bigger. They, like, taper out and, like, get huge arrowheads. Awesome with that.
Good accusatory arrow really makes for a good presentation. Snagit’s good. They don’t even pay me to say that. I won’t get a coupon. No coupons for me, unfortunately.
I am surprisingly, I have never been asked to be, like, a brand evangelist. Oh, yeah. That’s my story.
Anyway, we have hit the 30-minute mark. I have babbled at you long enough. It’s getting hot in here again. I haven’t, I might have noticed I haven’t complained about it being hot this week because I plugged my air conditioners in. But the air conditioners are out there. When my door is closed, this room just slowly gets hotter and hotter because I have, like, 90 inches of screens hanging around me.
Anyway, I’m going to get going. I’m going to go get back to work. Hopefully make some money. And I will see you next week. Thank you for coming. I hope you enjoyed it.
Thank you for the great questions, and I will see you next time.
Video Summary
In this video, I dive into some of the challenges and quirks that come with working in SQL Server, particularly focusing on entity framework queries and parameter sniffing issues. I share my experiences dealing with an entity framework-heavy workload and discuss how custom types can sometimes cause more problems than they solve. The video also delves into a question from a DBA who is outnumbered by web developers using entity framework and struggling to balance their approach. I offer advice on supporting new developers while guiding them toward best practices, emphasizing the importance of letting people learn through experience. Additionally, I address live query plans, sharing my limited but positive experiences with them, especially in demos where they can help identify bottlenecks. The video concludes with a few miscellaneous questions and observations, including some humorous remarks about technology and personal quirks like waking up at 4 AM to watch videos.
Full Transcript
All right. So… apparently YouTube decided to change which microphone it would use for no reason. You know, why not? Why… why? why not just leave a good thing alone just mess with it right mess with it the fun thing is once you’re alive you can’t apparently switch which microphone you want to use you can hear me good wonderful apparently youtube’s definition of live is far different from my definition of live my definition of live is i can be seen and heard and poked and prodded and hugged and loved but according to youtube apparently if i’m just babbling to nothing i’m still live i don’t know why my my webcam has a microphone built in so at bare minimum you should have been able to hear extreme potato quality audio from me but now we’re we’re back here back with a good one all right so now that i’ve accomplished my mission you should accomplish your mission and ask a question any of you because i know i know that there are a lot of people out there who are varying degrees of new to sql server and you probably have really interesting fun questions and i’m willing to come come out here and and answer those questions in exchange for no upvotes whatsoever so that’s fun it’s fun i get no upvotes for this youtube thumbs don’t count they’re meaningless no one’s no one’s um uh no one’s gonna care about youtube thumbs up anyway i finally did get a question via another means over over the past week uh it’s from uh a dba who will remain anonymous from new zealand uh and they had they had a fun question and it’s it’s a question that actually strikes pretty close to home this week because uh i’ve been dealing with an entity framework heavy uh sql server workload and if i can tell you one thing about entity framework queries it’s that whatever mechanism generates those things was i mean it can really only have been conceived by satan himself there’s no other way to explain it ordering things by a row number rather than just saying order by a column doing a left self join left outer self join with a where clause that led to this weird row count spool like this the things that i’ve seen this week are baffling and what’s what’s even more fun is that because uh no one who uses entity framework has any self-control whatsoever they’ve managed to select every single column in every single table and so every memory grant is nine ten sometimes 15 gigs and only like 128 megs get used it’s like every time someone threatens me with a self-tuning database i i see entity framework queries and i’m like we’re going to europe next summer and the summer after that you can escape people will find the worst possible way to use a technology every single time i i just if you start designing your applications assuming that users are both stupid and malicious i’m a stupid user i will do dumb things and i will find weird things that happen when when people do dumb things like oh i’m kind of dumb so that makes sense but malicious users people like paul white will go out of their way to find bugs that you should have been smart enough to not not have in there in the first place so there’s that to look forward to anyway peter says custom type question i spammed at you in chat with that obvi parameter sniffing otherwise caused by local vars in a proc nope nope custom types uh don’t help they are just like and var cars or bar cars or whatever like when you make a custom type it’s quite often like you don’t want people messing with it i see this a lot in applications where um well actually in one particular application i see this quite a bit but the whole point is that you know they have very um strictly defined types for their data types and so they’ll create custom types that are like far car 11 or car 15 or in decimal 18 2 so that people when they need to like like uh operate with columns and tables that you know have have those that match up to those those uh those custom types they know exactly which one to use so no unfortunately oh boy there’s a bunch of emails coming in all right all right okay i gotta get rid of those don’t want you reading those emails in my glasses zooming in anyway uh so back to entity framework what a nightmare it is and all that other stuff uh a dba who will remain anonymous we’ll call him uh no let’s just say anonymous i like that one anonymous is okay by me i’m a dba in a small town in a small island country that is quite frequently left off maps because people forget it exists i watch your your uh your videos on saturday mornings but i don’t want to get up at 4 a.m to ask a question i understand i don’t want to get up at 4 a.m for anything yet i end up getting up at 4 a.m quite often i don’t know why no matter what time i go to bed i tend to wake up at 4 a.m and feel the urge to start working i think of something i want to do and i can’t fall back asleep anyway the question says i’m the only dba in a team working working on a team working with a team of eight web developers you sir are outnumbered in a terrible way and i i i just i don’t want to answer this question as much as i want to send you weapons i want to send you lawyers guns and money to fight off these these eight criminal elements uh but anyway he’s saying they use entity framework and store procedures so they don’t just beat the tar out of sql server with with entity framework queries there’s some some sanity involved here uh and the team is usually reasonable when it comes to changing over from entity framework to store procedures when it’s appropriate because there’s just no way to get any framework to do what you want it to do uh but there’s a new developer starting there’s a new kid in town and uh the new hire feels very strongly that as much of the database model as possible should be generated generated by entity framework he’s about to be responsible for redesigning one of our databases and i’m worried he will use this as a push for poorly designed entity framework generated database schemas and not be receptive to feedback i plan to discuss my concerns with the development team lead is this something you’d be concerned about well of course of course that’s something that i would be concerned about and it’s i would be but here’s the thing you need to let people fail you need to let people try and fail and you need to not sabotage them and you need to not root for them to fail but you need to be supportive when they do and that’s the only way that you’re going to get people over to your side which is a reasonable side that you know people that the entity framework is not a panacea for database problems entity framework is not the end-all be-all of working with the database it’s great for developers who don’t know sql and don’t want to learn sql and they just want the things that they put into code to show up in an application in a reasonable amount of time so with this new new person who’s going to redesign things you should be supportive if they want to if they want if that’s how that’s the road they want to go well sometimes the only lesson learned is through experience which is which is a shame but sometimes that’s the only way to do it i wouldn’t start off arguing with them i wouldn’t start off uh trying to dissuade them from things i would just i would let them work and make progress and if they hit road bumps be there to help them get over those bumps maybe show them a way to get over those bumps that’s not entity framework then who knows maybe maybe they’re an excellent developer maybe they are the world’s foremost entity framework developer on a small island nation that of that frequently gets forgotten from maps and maybe maybe they can do this whole thing without without you messing with them it’s an entirely plausible scenario. I mean, I know it’s not going to happen, but you know, whatever. Anyway, that’s my answer for it. I think that it’s going to be a, I mean, just don’t make it a touchy political issue. Just say it’s a technology issue. People have to be aware of the limits and the good uses and bad uses of a technology. And, you know, if they try to start square pegging stuff, just say they’re square pegging stuff. Help them out.
Help them come to a reasonable place in the world. That’s the way I’d do it, you know? Anyway.
Someone else from a small island, from that same small island nation that frequently gets forgotten from maps has asked a question. How useful do you find live query plans?
Not so much. You know, I, I, I’ve never used a live query plan to troubleshoot a problem. Mostly because the people who I work with are not on a version of SQL Server that has live query plans in them. I, I would use them. The only time I’ve really used them to any great extent is locally when I’m trying to write a demo demo and I’ve wrote, I’ve written too good of a demo and it’s dragged on for like five minutes or so. And I’m thinking, well, what is this plan doing? Cause I want to see, I want to see what, what’s happening in here. And so I’ll rather like live query plans are pretty useful for just seeing like, okay, where, where are we held up here?
What, what do I need to do to make this demo a little less good? And, you know, that’s about where I stick with them. I re I really like the, the new management studio version 18 query plans because they have the, I mean, they don’t have, they don’t show you the query as it progresses.
Right. They’re not, you’re not seeing the plan. You’re not like you don’t hit F5 or whatever button combination you choose and see like the execution line doesn’t immediately pop up and start running. And you don’t see like rows as they flow through and do things. And as parts get completed, the little, little, the little line arrows turn into like solid. You don’t get all that.
You don’t, you don’t get all that. But when the, when the query is done, you do get, um, uh, you do get the final plan with mostly coherent operator times attached. Of course, if you, that varies a bit between row mode and batch mode. If you’ve watched my 10 minute video that, uh, a certain intergalactic celestial being from a small island nation that frequently gets left off maps had pointed out is well worth the 10 minutes of your time. Then you may be, maybe, maybe, maybe.
Well, no, no. Why? Uh, anyway, the thing I really hate about live query plans is how often they crash management studio, but that might not be a live, live query plan problem. That might be a management studio problem. Sometimes I’m like you hit it. You get the query running and then you hit cancel and you’d like, can’t do anything to that window.
If you try to close the window, management studio crashes. If you let it go, it’ll go on forever. And like you’ll wait until you restart. It’s a nightmare. Not, not my favorite way to spend time interacting with SQL Server management studio. God’s favorite 32 bit application. I hear, I hear management studio was God’s 30 favorite 32 bit application. Marcy asks, are you wearing Swannies? Marcy, I’m going to level with you.
I don’t know what a Swannies is. Enlighten me. What is a Swannies? Darren Scott says those scope identity in the where clause were from EF as well. Good heavens. One of my favorite things that I see in some applications is where, um, when you, uh, when certain people, so like if you have an application that needs to deal with people who access things from multiple sites, right? Like say you have sites A, B, and C. And you will have, uh, a column in the table that denotes site A, B, and C. And when different users connect in, they generate context information so that the application knows which site to point them to. And so none of the tables are directly referenced in the queries. Every single table is wrapped in a view with where column equals context info, the little context info function. So user, every single user before they touch it, like they have to get routed sort of via this function to which part of the table they should be looking at. It’s a very weird way to see things. Very strange. Anyway, uh, Paul something or other says people wouldn’t use EF if it weren’t for good stuff. Yeah. Would they? Yeah. I know a fair amount of people who use heroin. I mean, I know that’s an extreme example. I know a fair amount of people who like country music. That’s an even more extreme example. You know, a fair amount of people who wear flip-flops to walk around New York City.
Jandals, if you will, if you haven’t been wiped off the map yet. I know a fair amount of people who have made very, very dumb decisions in life. I have hand and neck tattoo. That was also a weird idea, weird choice. Anyway, what can you do? What can you do at this late stage? I can only go further. I can only wait for my mother to die so I can get face tattoos.
Otherwise she’d kill me. Let’s see. Forest, Forest of McDaniel says, when do you find CPU stats from query stats DMVs the least trustworthy? Before a query has finished. Soon nothing is there. It’s lying to you. I don’t know. I’ve never, I mean, I take, I take it all with a grain of salt. You know, I know when I write blog posts and when I write training material and, you know, talk about SQL Server generally, it’s, you know, you have to correlate things a little bit.
Right? Like you don’t want to just point to one thing and say, this is the God’s honest truth about what happened. You want to look at, like, I always want to look at a few different, this is why I’m such a big fan of new query plans, getting the operator times and the CPU time and all the other kind of cool lightweight profiling stuff that we’re getting in newer versions of SQL Server and management studio.
Because it gives you multiple sources of truth, right? You can multiple sources to check, to verify, to make sure that the thing you’re seeing holds up. All right? So there’s lots of different places that you can, you can look to validate things.
You know, it’s like, it, like, there’s no reason right now. There’s no, like, unless you, like, pull the crap out of that query profile DMV that does the live query plan thing, you can’t really validate, like, the per operator stuff too easily. You can validate, like, the overall plan time stuff pretty easily. But that’s, that’s, that’s about it.
But I, I really, I really like generally the, the amount of new feedback that we’re getting, even if it’s not all down to the microsecond or whatever new unit of time Microsoft has invented to measure things to confuse us. I hear that they’re going to invent satya seconds, which are sub nanoseconds that are only, they’re only, they’re only reliable to the closest microsecond.
That’s that. I don’t know. I think everything’s unreliable. Look, even YouTube’s unreliable. YouTube screwed me here.
Change my microphone over at the beginning of a webcast. Why would you do that? Why would you do that? I’d say audio settings have changed. Why? Dummies. Marcy says, Swanwick blue light blocking glasses. No, no. These are, these are Ray-Bans.
They’re a little bit old. I should probably get a new pair of glasses soon. I just particularly like these. I’ve grown used to them. I’ve grown fond to them on, on, on being on my face. Unlike this beard. This beard’s gone. No more of that.
Max Vernon says, the tats lend a bit of a cachet. I bet people tend to listen to you in person. I don’t know. It’s, it’s, it’s funny. Like when I was younger and I hung out with people who had tattoos, having more tattoos gave you like sort of weird social status. Right.
If you had, like, if you have more tattoos on someone, you, you can be like, yeah, when are you going to get that tattoo? Like, if I, like, I was able to do my neck tattoo, be like, well, when are you going to get your neck tattoo? Wimp, you know, like make point, like, I don’t see you with hand tattoos. What’s up with that?
Right. Like, there’s like some of that, like now that I hang out, a bunch of people who like, you know, tuck their t-shirt into their underwear. The, the social, social ladder is all flipped around. I’m like no one in some of these conversations, you know, you get, you get a bunch of people sitting around a table and they want to talk about, you know, something other than the, the, the small chunk of query tuning that I enjoy. No one’s listening to me. No one wants to hear me talk about containers.
No one wants to hear me talk about availability groups. No one wants to hear me talk about taking backups. I don’t want to hear me talk about taking backups. You know how dull that is? Ugh.
Nothing to do with it. Let’s check TB scheduling. Get out of here. Talk to someone who cares. You know, the only time I care about that because.
Oh, screw it. There’s a, there’s another question here. What do you think about implicit conversions and plan warnings more generally? Well, golly and gosh. Eating a lot of dinner because of implicit conversions.
Can’t complain too much about those. A lot of dinners. A lot of dinners. A lot of wine because of implicit conversions. And I’m pretty sure you’ve gotten some wine because of implicit conversions. My friend.
What do I think? What do I think? I mean, if, if someone, if, if you have people out in the world who can’t be bothered to, to match data types, like what, what, what, what help is there for them? They like this pick something randomly and compare them to random things and compare them.
Like, I want to know if this knife matches his pen. What do you tell those people? What can you tell them? I want to know if this fork is a notebook.
What do you tell them? There’s no sense. There’s no, if, if people are, are that dead set on not caring, I will happily take their money to tell them they should care.
That’s it. Plan warnings more generally. We get, we get warned about the wrong things.
We get warnings. We get, first off, the, the, the, the implicit conversion warnings are sometimes full of dookie. Right?
Like if, like one example that I show when I talk about them is like, if you have an integer column and you say, like, select, I let’s, let’s call it ID. Select ID as VARCAR 10. You will get an implicit conversion warning saying that the cardinality estimate of your query is incorrect.
You’ll also get an implicit conversion warnings for seek plan when there’s no index that you could possibly seek into. Right? Like let’s just say that I have, for example, another column called reputation.
And I say, select star from users where reputation equals a variable that’s, and then VARCAR something. Right? And I don’t have an index on reputation.
SQL Server will say, well, you could have done a seek plan, dummy. And you couldn’t because there was no index on it. There was nothing for you to seek into. Nothing there.
Another pet peeve is the no join predicate warning, which is that, would you get that big red, can you imagine the things that Microsoft should put a big red X over in query plans? Like every spool? Like every single spool should just have a giant red X over it.
But no, we get, we get warned when completely reasonably written queries with a join predicate. I say you don’t have a join predicate. Okay.
You win. And those memory grant warnings, which may affect the reliability of me to stay sober. Right?
He’s like, you’re, you’re, you had a thousand and 24 KB memory grant and you only used 176 KB of it. May affect the reliability. I love that.
I love that sentence. You know what? If there’s one fragmentation that I worry about in SQL Server, it is, it is sentence fragmentation. And these warnings affect, it may impact the reliability.
It’s just like, okay, tell me more. Tell me more. I would love to hear more.
Oh God. Where are some other ones? Where are some other funny ones? Oh boy. I don’t know.
I think spills are overrated. I think spills, I think, I don’t think you should get a spill warning unless you are like really spilling. You should.
Yeah. Unmatched indexes. That was a fun one. It was, it was fun to find out that if you have a plan that’s auto parameterized, you’ll get an unmatched index warning. When, even though, even if you use the index, like you can see the index being used in the plan.
But if your plan is auto parameterized or simple parameterized, whatever you want to call it, you get a warning. We couldn’t match that index to anything. But I see you.
I see you. It’s aggravating. Aggravating. It’s like, if you could, if you could go back and start over with like the query plan, XML.
Hey, would you even use XML? Use JSON. I would, I would much rather just get like a, like an MS paint.
It’s like, give me a PNG of the plans. Don’t make me use the XML. It’s like, write everything down for me. Write everything down.
Marion asks if I think Paul is real. Well, he better be. Or else, someone else has my old laptop. As far as I know, he is.
Yes, plans rendered by entity framework. That would be, that would be ideal. Because then you would never get a query plan. And you would never be able to fix anything. And you would be able to happily learn how to do something else for a living.
Go learn, go learn C sharp. Go learn, go write, write a great novel. Go write the next great novel for your country.
Where is it? Next great American novel, Canadian novel. New Zealand. I mean, let’s, no one in Australia is writing a novel. Get eaten by dingoes anyway.
Dingo ate my novel. I don’t know. I often think about what I would, things that I would much rather be doing than SQL Server.
The list keeps growing long. Fun. Marcy says, speaking of weird things and plans, is there a way to keep a detail pop-up open if I want to move my cursor to another screen?
No. No. Yes.
Of plan connecting lines and all that number of rose red malarkey. Yeah, that’s, you know. What bothers me is something that I learned from you about cash plans where they are just stitched together from many different plans. So, like, when you have a plan, you see, like, a plan in your plan cache or, like, an estimated plan where you have, like, thin lines and thin lines and thin lines.
And then you hit one operator and there’s a very, very thick line coming out of that operator for some reason. And the estimate goes from, like, three rows to, like, 40 billion rows. That’s just the optimizer being kooky.
Putting the plan in cache that might have been a few other plans stapled together. Dreadful. Marcy says, I don’t know how to get a screenshot of those.
They disappear as soon as I click anywhere else, like on the snipping tool. So, I use Snagit. S-N-A-G-I-T.
I use Snagit. And when I have my cursor hovering over an operator so I get the tooltip, I can just hit the print screen button. And that’ll trigger the screenshotting of my screen.
And I can zoom in on the tooltip. Snagit is great for that. It’s well worth, I forget, like, 25 bucks or something. And then, like, the occasional maintenance contract so that you get updates.
Well worth it. The other upside of Snagit is that it has, like, all sorts, like, it has, like, an editor built in. So, you can do all sorts of cool stuff with things you take pictures of.
You can, like, do, like, the crop where, like, you cut out, like, a certain part either horizontally or vertically. You can draw shapes. They have the most accusatory built-in arrows.
So, if you really want to call attention to something and be like, this sucks, the arrows they have are wonderful for that. Like, some of them, like, get bigger. They, like, taper out and, like, get huge arrowheads.
Awesome with that. Good accusatory arrow really makes for a good presentation. Snagit’s good.
They don’t even pay me to say that. I won’t get a coupon. No coupons for me, unfortunately. I am surprisingly, I have never been asked to be, like, a brand evangelist. Oh, yeah.
That’s my story. Anyway, we have hit the 30-minute mark. I have babbled at you long enough. It’s getting hot in here again. I haven’t, I might have noticed I haven’t complained about it being hot this week because I plugged my air conditioners in. But the air conditioners are out there.
When my door is closed, this room just slowly gets hotter and hotter because I have, like, 90 inches of screens hanging around me. Anyway, I’m going to get going. I’m going to go get back to work.
Hopefully make some money. And I will see you next week. Thank you for coming. I hope you enjoyed it. Thank you for the great questions, and I will see you next time.
Going Further
If this is the kind of SQL Server stuff you love learning about, you’ll love my training. Blog readers get 25% off the Everything Bundle — over 100 hours of performance tuning content. Need hands-on help? I offer consulting engagements from targeted investigations to ongoing retainers. Want a quick sanity check before committing to a full engagement? Schedule a call — no commitment required.
I know, you probably have questions about CXPACKET.
Maybe you look at a wait stats report and nod sagely at the caps lock extravaganza of variably descriptive names.
The unformatted numbers that you tally on your fingers, and then have to look up what 12 digits is.
When you search around, you can figure out what most of your waits are, and why they happen. You might even be able to figure out how to fix them.
(I know, you’re gonna read advice on a blog from 2003 telling you to set “MaxDOP” to 1, but forchrissakes don’t do it.)
What I’m looking for are waits that pop up, but you haven’t been able to find answers to. The real nut crackers.
If you’ve got those, leave a comment and let me know.
Going Further
If this is the kind of SQL Server stuff you love learning about, you’ll love my training. Blog readers get 25% off the Everything Bundle — over 100 hours of performance tuning content. Need hands-on help? I offer consulting engagements from targeted investigations to ongoing retainers. Want a quick sanity check before committing to a full engagement? Schedule a call — no commitment required.
In yesterday’s post, we looked at a clever way to reduce calls to a scalar UDF using APPLY.
Today, we’re going to see if 2019 changes anything, and if our old trick still tricks.
Because, you know, what else do you do when you need to write 5 blog posts a week?
LOVE YOU!
Don’t Be A Donkey
I’m going to abridge this a little bit, since all the code is referenced at the link up there.
I’m also going to show you some stuff using Plan Explorer.
Why?
Because SSMS kept opening the plan XML as XML, and that makes for crap screenshots.
Here’s the results for the plan with two function references. It runs for ~2.2 seconds.
Honesty, at last.
If you remember yesterday’s post (and why wouldn’t you, hm?) the query plans didn’t show us touching other tables at all.
Just seeking into the Users table and then magically computing scalars and filtering.
One of the nice things about scalar UDF inlining: honesty.
But, you know, the two where clause references end up expanding. We’re hitting pretty big tables, here, too.
Apply-ish-ness
Using APPLY has a similar *ffect here. The function is only referenced and filtered once, and the duration is cut roughly in half.
Now, I know you’re probably thinking, because YOU REMEMBER YESTERDAY’S POST!
Ming the Merciless
How come these queries are so much slower with the functions inlined?
Well, they’re not. With query plans turned off, the first one runs in ~900ms, and the second one runs in ~500ms.
Yesterday’s plans run for 1.6s and 600ms respectively with plans turns off.
Apparently observation has overhead. If only there were a clever phrase for that.
Not All Functions
The idea behind FROID is that it removes some restrictions around scalar valued functions.
They can be inlined into the query, not run per-row returned
They don’t force serial execution, so you can get a parallel plan
If your functions already run pretty quickly over a small number of rows, and the calling query doesn’t qualify for parallelism, you may not see a remarkable speedup.
That’s fine, though, because inlining has other benefits:
Query plans are honest about the work they do
Measuring the query will show you work that used to be hidden behind the function call(s)
Even if every query doesn’t magically finish before you run it, you’ll see pretty good gains.
Thanks for reading!
Going Further
If this is the kind of SQL Server stuff you love learning about, you’ll love my training. Blog readers get 25% off the Everything Bundle — over 100 hours of performance tuning content. Need hands-on help? I offer consulting engagements from targeted investigations to ongoing retainers. Want a quick sanity check before committing to a full engagement? Schedule a call — no commitment required.
The things I see people doing with them range from “you know there’s a system function that does that” to “oh wow, you wrote an entire program in here”.
I’m not kidding. I once saw a function that was a wrapper for ISNULL that returned the results of ISNULL. I have no idea why.
If I had to think of a DBA prank, writing scalar UDFs that are just wrappers for system functions would be pretty high up there.
Especially if they had the same names as the system functions.
Turning Down The Suck
A while back, Jonathan Kehayias blogged about a way to speed up UDFs that might see NULL input.
Which is great, if your functions see NULL inputs.
But what if… What if they don’t?
And what if they’re in your WHERE clause?
And what if they’re in your WHERE clause multiple times?
Oh my.
Tick, Tick, Tick
Here’s our function.
CREATE FUNCTION dbo.TotalScore(@UserId INT)
RETURNS BIGINT
WITH RETURNS NULL ON NULL INPUT, SCHEMABINDING
AS
BEGIN
    DECLARE @TotalScore BIGINT;
    SELECT @TotalScore =
    (
        SELECT ISNULL(SUM(p.Score), 0)
        FROM dbo.Posts AS p
        WHERE p.OwnerUserId = @UserId
    ) +
    (
        SELECT ISNULL(SUM(c.Score), 0)
        FROM dbo.Comments AS c
        WHERE c.UserId = @UserId
    )
    RETURN @TotalScore;
END
GO
What it does is go out to the Posts and Comments tables and sums up the Score columns for a user.
We’ll use it in our query like this:
SELECT u.DisplayName,
       u.Reputation
FROM dbo.Users AS u
WHERE u.Reputation >= 100000
AND dbo.TotalScore(u.Id) >= 10000
AND dbo.TotalScore(u.Id) < 20000
ORDER BY u.Id;
We want to find people with a total score between 10 and 20 thousand.
Right on.
When we run the query, the plan looks like this, showing 2 seconds of runtime.
Two seconds for 260 rows is kinda wack tho
Tock, Tock, Tock
I know, I know. Get to the point. Make it faster, bouncer-man.
Our goal is to get the function to run fewer times, so we’ll replace multiple calls to it with one call.
SELECT u.DisplayName,
       u.Reputation
FROM dbo.Users AS u
CROSS APPLY
    (
        VALUES (dbo.TotalScore(u.Id))
    ) AS t (Score)
WHERE u.Reputation >= 100000
AND   t.Score >= 10000
AND   t.Score < 20000
ORDER BY u.Id;
Using this technique, the query runs for about 780ms.
Check you out.
Tale of the XE
What happens that makes this faster is more evident if we use the XE session from Jonathan’s post for similar reasons, and look at how many times the function was called.
If we look at the activity sequence, it goes up to 1060 for the first query:
Moved Out The Hood
And only 615 for the second query:
Thinner~
Exeunt
Right now, if we want scalar UDFs to run faster, we can:
Tune the underlying query (if there is one)
Have them run fewer times
Wait for SQL Server 2019
In tomorrow’s post, I’ll look at the same scenario using CTP 3 of SQL Server 2019.
Thanks for reading!
Going Further
If this is the kind of SQL Server stuff you love learning about, you’ll love my training. Blog readers get 25% off the Everything Bundle — over 100 hours of performance tuning content. Need hands-on help? I offer consulting engagements from targeted investigations to ongoing retainers. Want a quick sanity check before committing to a full engagement? Schedule a call — no commitment required.
In query plans where an Eager Index Spool is directly after a data access operator, a missing index should be generated in the query plan, and/or missing index DMVs that describes the definition of the index needed to make the spool unnecessary.
I would not expect this to happen when a Lazy Index Spool occurs above a subtree.
I’d appreciate it if you’d consider voting for it. It’s something that I was able to implement pretty easily in sp_BlitzCache.
In query plans where an Eager Index Spool is directly after a data access operator, wait stats should be generated while the Spool is built. In a parallel plan, EXECSYNC waits are generated, but in a serial plan, you don’t see anything. Problem scenarios will become more common when FROID is released and adopted.
I would not expect this to happen when a Lazy Index Spool occurs above a subtree.
Thanks for reading!
And voting as many times as possible ?
Going Further
If this is the kind of SQL Server stuff you love learning about, you’ll love my training. Blog readers get 25% off the Everything Bundle — over 100 hours of performance tuning content. Need hands-on help? I offer consulting engagements from targeted investigations to ongoing retainers. Want a quick sanity check before committing to a full engagement? Schedule a call — no commitment required.
I’ve trademarked: Froidrage, Froidulent, and Froidpocalypse.
If you want to use them, you have to pay me $10,000.
Alright, I’m being told by my lawyer that writing them on cocktail napkins and showing them to confused bartenders doesn’t actually register a trademark.
Nevermind.
Here’s What’s Gonna Happen
And it’s not a problem that you need SQL Server 2019 to see. All you have to do is try to rewrite a function.
Here’s our Villain, a scalar UDF.
CREATE FUNCTION dbo.Villain (@UserId INT)
RETURNS INT
WITH SCHEMABINDING, RETURNS NULL ON NULL INPUT
AS
BEGIN

    DECLARE @Score INT
	SELECT TOP (1)
	         @Score = p.Score
	FROM dbo.Posts AS p
	WHERE p.OwnerUserId = @UserId
	AND   p.PostTypeId = 1
	ORDER BY p.Score DESC;

	RETURN @Score;

END
GO
Here’s the query that’s gonna call it:
SELECT      TOP ( 10 )
              u.DisplayName,
			  u.Reputation,
			  dbo.Villain(u.Id)
FROM        dbo.Users AS u
ORDER BY    u.Reputation DESC;
GO
I’m Going To Show You Two Things
The estimated plan, and the actual plan.
I need to show you the estimated plan so you can see what the function does, because that’s not included in the actual plan.
Yes, the estimated plan is more accurate than the actual plan.
Marinate on that.
On The Dancefloor
The important thing is the second plan, which is the function’s execution plan. Notice that it generated a missing index request, and doesn’t spool anything at all.
It handles the query logic with a Top N Sort.
Here’s the actual plan:
A NONCLUSTERED INDEX SCAN!!!
Let’s talk about a couple things:
A nonclustered index scan that costs 100% and runs for 0.000s
A compute scalar that costs 0% and runs for ~3s
The compute scalar thing is well documented by… Well, not by official Microsoft documentation.
Would say “I can rewrite that function and make things better”.
Because of course an inline function is always better than a scalar function.
Enter our Hero.
CREATE FUNCTION dbo.Hero (@UserId INT)
RETURNS TABLE
WITH SCHEMABINDING
AS
RETURN

	SELECT TOP (1)
	         p.Score
	FROM dbo.Posts AS p
	WHERE p.OwnerUserId = @UserId
	AND   p.PostTypeId = 1
	ORDER BY p.Score DESC;

GO
Here’s the query that’s gonna call it:
SELECT      TOP ( 10 )
              u.DisplayName,
			  u.Reputation,
			  h.*
FROM        dbo.Users AS u
CROSS APPLY dbo.Hero(u.Id) AS h
ORDER BY    u.Reputation DESC;
I Only Need To Show You One Thing
Since the function is an inline type, the query processor is honest with us about the full query plan.
Spiced Ham
Two things happened here:
The “function body” no longer goes parallel
The TOP (1) is run against an eager index spool rather than the clustered index
What’s The Point?
This is what FROID does for you without a rewrite. It’ll inline the scalar UDF.
The plan may be better, or it may be worse.
The scalar UDF plan ran for 3 seconds, and the inline version ran for almost 13 seconds.
Stay tuned for tomorrow’s post. I have a couple suggestions for how The SQL Server team can help end users stay on top of these problems in SQL Server 2019.
Thanks for reading!
Going Further
If this is the kind of SQL Server stuff you love learning about, you’ll love my training. Blog readers get 25% off the Everything Bundle — over 100 hours of performance tuning content. Need hands-on help? I offer consulting engagements from targeted investigations to ongoing retainers. Want a quick sanity check before committing to a full engagement? Schedule a call — no commitment required.
In a parallel plan with an eager index spool, we can observe EXECSYNC waits for the duration of the spool being built.
In a serial plan, we’re not so lucky. There’s no obvious wait that indicates we built an index.
Let’s run a familiar query:
SELECT      TOP ( 10 )
            u.DisplayName,
			u.Reputation,
			ca.*
FROM        dbo.Users AS u
CROSS APPLY
(
    SELECT   TOP ( 1 )
			   p.Score
    FROM     dbo.Posts AS p
    WHERE    p.OwnerUserId = u.Id
    AND      p.PostTypeId = 1
    ORDER BY p.Score DESC
) AS ca
ORDER BY    u.Reputation DESC;
The plan is fully serial:
Meat Lovers
It’s obvious looking at the actual plan in SSMS 18 what took a long time.
If we’re not so lucky, and we have a cached plan, it would be less obvious:
Back Like That
Look how bad scans are! Ha ha ha!
?
What’s A Wait?
If you wanna figure out the runtime, you have to do some math.
What times what?
If you take the SOS_SCHEDULER_YIELD waits and multiply them by 4ms, you can get about accurate runtime (12,444).
We’re lucky on my laptop that our query isn’t competing with other queries for processor time, so there’s not a long queue to get back on a CPU on each yield.
It’s nice to be able to see this while we’re watching a query, but if we come across it in the plan cache, or if we were looking at wait stats, what would we make of the problem?
Surely an operator that’s only 13% of the plan cost couldn’t be responsible for all that.
??
But There We Have It
A query that runs for a non-trivial amount of time, emits common wait stats, and doesn’t ask for an index when it’s creating one.
And that index creation is what makes up for 99% of the execution time.
Thanks for reading!
Going Further
If this is the kind of SQL Server stuff you love learning about, you’ll love my training. Blog readers get 25% off the Everything Bundle — over 100 hours of performance tuning content. Need hands-on help? I offer consulting engagements from targeted investigations to ongoing retainers. Want a quick sanity check before committing to a full engagement? Schedule a call — no commitment required.