sp_HumanEvents: Tracking Queries and Waits

Is It Really So Strange?


sp_HumanEvents

Video Summary

In this video, I dive into the fascinating world of SQL Server’s `sp_whoisactive` and its cousin, `SP_HumanEvents`, to explore how they can help us track down blocking, compiles, and recompiles. I also delve into their utility for analyzing queries and weights, showcasing examples where running similar statements in separate batches versus within a stored procedure yields different insights. By using `SP_HumanEvents` to collect data over 30 seconds, I demonstrate how it can provide detailed execution plans, memory grants, and query metrics, even when run from a stored procedure like `sp_BlitzCache`. Additionally, I highlight the unique value of weight stats in identifying performance bottlenecks through page IO latch weights and SOS scheduler yield weights, emphasizing the importance of setting appropriate thresholds to avoid overwhelming data.

Full Transcript

Mmmhmm. My wife tells me that I get to have champagne after I finish this video, so I’m going to make sure this one’s real good. Now, we talked about how SP underscore human events can help you track down blocking, compiles, and recompiles. Next, we’re going to talk about how it can help you with queries and weights. Now, there are some second samples in here that are 30, and when we hit those, I’m going to hit pause while this runs, because I don’t want to sit there going like this with you as much as I love you. I don’t want to sit there staring at you while this thing runs for 30 seconds to collect data. So, without further ado, let’s talk a little bit about what happens when statements run in different ways. So, the first thing I have, you see there’s two batches here. There’s no goes in this one. This one’s all goes. And this is the same five or six queries that repeat one after the other. You can see there is, let’s see, greater than 10. We have this batch of queries that run, and then this batch of queries that run. They’re all technically the same thing, except this one which has a different at ID, because I got errors when I tried to declare the same ID. Well, when I tried to do it down here. So, I just used the second one.

You can cut the irony with a knife there. Anyway, so what I’m going to do is kick SP underscore human events off to run for 13 seconds and collect information about queries that run in the Stack Overflow database. And then I’m going to come over here and run this bunch of separate statements. Now, human events isn’t going to collect information about all of them. There are certain default values for parameters that not all of these queries will meet the barrier for entry on. So, we won’t collect information about every single thing that runs here.

We will collect some about a couple of queries that ran, or a few queries that ran here, that did meet our criteria. So, we have this one here where we selected something. Well, let’s just not talk about what the query did. It doesn’t matter what the query did. But in this case, when they’re all separated by goes, this batch of statement text column will be the same thing as this column.

And I haven’t figured out, like, long term, if I want to figure out a way to, like, say, hey, if this text column equals that text column, then just show one of them. Because quite frankly, we’re going to end up getting some big text back. I don’t know if that’s how I want to spend my CPU cycles in here. But we get back, again, some commensurate information with other stuff. We get the database name.

This is obviously not dynamic SQL. This is obviously regular SQL. But it’s not coming from the stored procedure, so we don’t have a legit object name there. We have the text of the queries that come back. We get their execution plans.

We see how many times they were executed. I guess we used a cached plan for that other ZZ thing. And we get to see some blitz cache-ish information about the queries that ran. So we’ll get total and average CPU, total and average logical reads, physical reads, duration, writes, bills, if available, memory, a whole bunch of stuff about memory grants.

None of these got memory grants, apparently. We’ll see how many rows they returned. We’ll get the DOP. And then I’ll give you some, you know, sort of forensic information in case you want to go digging about looking for more stuff on these. So I’m going to go to the query plan hash, the query hash, and the plan handle.

So you can go off and try to find more stuff there. Since this is v1, I just wanted to, like, like, yeah, I could go to the plan cache to try and find more stuff. But I don’t really see the point since everything I would go out to the plan cache for I get pretty well here.

I don’t really know. Like, I might try to add more stuff in later. But I think for now this is a kind of a good enough report. Now, where this is, why I’m showing this to you in two separate runs is because if we run this with all the GOs, these each register as a separate statement.

If I run all of this as one big monolithic chunk, so I’m going to come back over here, I’m going to run the same thing. And now I’m going to run this all as, again, one big monolithic chunk. The results are going to be a little bit different.

And I think it’ll help explain why I did things the way that I did things. Maybe, maybe not. We’ll see. So this time we get back four queries. Yeehaw. Lucky us. And now we’re going to see that things are slightly different here.

So this did just give us the individual query text, which is what we want. This is good. This is like good information to have. But this gives us back the entire text of what ran.

So this is all of those selects at once. This is different because with all the GOs in there, these were, this matched here. But without this, this, we got blah, blah, blah.

You understand what I’m saying. Anyway. We also get back the sort of the same information. We get back the XML. We get back the query metrics. And going on over here, the same stuff.

Cool. You understand that. That’s great. I’m happy for us. I’m happy for us all to be able to hang out together. Now, this is going to run for 30 seconds. So I am going to hit pause now, run this.

And what I’m going to look at now is how things look when they come from a store procedure. I’m just using Blitzcache here because I had it available and I know it does some crazy XML stuff. There are a lot of different statements in there.

And I think that’s a little bit more of a challenge. So here we go hitting pause. And I’ll be back in 30 seconds with some results for you. I missed you so much.

I missed you so much. So it is 30 seconds later. I have run SP underscore human events for 30 seconds to collect information about queries that are running inside of SP Blitzcache.

Now, hmm, hmm, hmm, hmm, hmm. What I see is something helpful and then, well, I mean, it’s all generally helpful. So we get the database.

We get the object name back this time. There’s actually something in there. And now this is where things get a little bit more interesting for store procedures because now we get back the statement text of the part of the store procedure that ran. So we get the exact statement that was running that generated those metrics.

And now SQL text shows us the command that we ran when this thing happened. So this is where things can get really helpful because a lot of times when I’m trying to troubleshoot a problem with a client, what will happen is we’ll be like looking at something and be like, okay, cool, store procedure.

But now we need to figure out how it ran and you can’t figure out what happened. I don’t know. This helps you figure it out.

So then we get the execution plan for what happened. And we also get the metrics here. So we get the total and averages again, like you’ve seen before. We get how many rows, estimated rows.

And I’m going to do a little work to put like some, maybe like a warnings column in here to help deal with, you know, if row, if actual row counts are way different from estimates or if, where is it? Here we go.

Used memory or used memory and granted memory are off in some weird way. Blah, blah, blah, blah, blah. So you understand that. Not a whole lot new to here to show you with that.

Cool. Let’s move on and let’s look at queries. I mean, let’s look at weights. Because I did some, I think I did, I think I did some kind of cool stuff in here.

So again, this is going to run for 30 seconds. And while that runs, I’m going to run this query. But first I’m going to drop clean buffers so that I have to read a bunch of stuff from disk so that I generate some page IO latch weights.

Because that just makes this thing a little bit more interesting. So I’m going to run this and run all of this and I will see you back in 30 seconds. So this is the part that I’m like really excited about with this store procedure.

So again, I ran and I collected weight stats for 30 seconds. And I collected weight stats, well I mean not specifically for this query, but you know, this was the only thing really running at the time. So that’s the only thing that we’re going to get any information back.

Now this returns three result sets. This was total weights, total weights by database, and then weights by query. And then we’re going to run the total weights, which is fantastic.

Now you can see from the total weights that we generated a whole lot of page IO latch weights. And so this looked insane to me when I first saw it. I said, I am screwing something up.

I did something royally awful. I mangled this calculation somehow. But then I opened up the event XML and it turns out I was 100% right. CX packet logged one weight for almost 21 seconds.

It’s not me messing anything up. You can go look at the XML if you want. You can do that by using the debug parameter. It’ll show you the XML as it lives and breathes.

So there’s that. And then next section down, you know, not terribly interesting pattern here. Database name, the weight type, and then some more information about the total weights and all the average milliseconds per weight, which is one of my absolute favorite things to measure with weight stats to see if there’s any, like, like, you know, there’s like the two different sort of issues you can hit with weights.

There’s like the lots of little weights that add latency. And then there’s like the really long weights that add weird latency. But here is my absolute tutti frutti favorite part of this whole thing.

Getting weights per query. So what we’ll have here is not only because this is one of those things that like, you know, you get, you sample SQL Server, you look at weight stats, you’re like, cool, but what query caused them?

This can correlate that a bit sometimes. So we’ll get the, again, the same weights as before, but now we will also get the query that caused them with the query plan. So we get the text and the query plan.

Now this is a bit repetitive. In the future, I might like do some string ag work on this to sort of make this all one line rather than have a whole bunch of things here. Because, you know, I mean, showing you the same execution plan four times is maybe not the greatest look in the world, but it’s probably not the worst thing either.

Now, where weight stats get kind of complicated, at least with extended events, is with SOS scheduler yield weights. Now, I have this other, I have this sampling down here. And what I’m going to do is I’m going to come back to the queries.

And I’ve set up some things here to collect information that I normally wouldn’t. So the weight duration here is 0 milliseconds, and I have to use the gimmeDanger parameter to grab this stuff. And so I’m going to run this, and I’m also going to run all of these.

So I will be back in 30 seconds to show you the insanity of this. All right. We are back 30 seconds into the future. And so what I did was, again, just to recap, I ran sp underscore human events for 30 seconds.

And I set my weight threshold to 0 milliseconds, and I had to use gimmeDanger to get that information back. And I ran all of these queries. I ran them, like, twice, actually, to fill up the sample time.

But that’s not really the important thing. The important thing that I want to show you, excuse you, is SOS scheduler yield and some limitations of the ring buffer. Now, every time I run this, I get 1,000 lines back from this, meaning that I filled up the ring buffer got full after 1,000 lines of this nonsense.

And, you know, I’m not sure if that’s, I’m not fully sure if that’s because the ring buffer has some limitation of 1,000 lines or if it’s because of the size that I chose for the ring buffer and the size of the data that I’m putting in there. I’m not fully sure on that, but kind of second to the point that it’s not always helpful to get more and more information back.

Now, you can see that the weight stats that I got back, I got back 1,000 weights on SOS scheduler yield, but they didn’t have any real duration to them. And that shows per database, and that also shows at the query level where we have a bunch of SOS scheduler yield weights, but all the durations on here are zero. So, in some cases, it is very unhelpful to set the milliseconds down this low.

You just don’t get really good information back. You can see that there are some different queries here that all generated SOS scheduler yield weights, but nothing really beyond that that’s all that helpful. So, I guess if there is a moral to this story, it’s maybe the really fast weights are not where you should be focusing 100% of your time on here.

Like, if it’s zero, maybe leave it alone. We don’t really need zero here. So, be careful with that.

I’m not saying never, just, you know, be nice to your server. Be nice to your ring buffer. Anyway, that is all I had for now to show you about SP underscore human events. After this, I’m going to go drink my celebratory champagne and begin my weekend of turning into a useless puddle.

So, I hope that you enjoy this door procedure. I hope that you learn some stuff. I hope that you can use it to fix some problems or find some problems or maybe find some problems and call me to fix some problems.

Because you’re like, ooh, this is hard. We should call Eric. He seems nice. That nice fellow from YouTube. Anyway, that’s it for now.

I will see you in some other video some other time. Thanks for watching. And that’s it for me.

I will see you in some other video some other time. Thanks for watchin’.

Going Further


If this is the kind of SQL Server stuff you love learning about, you’ll love my training. Blog readers get 25% off the Everything Bundle — over 100 hours of performance tuning content. Need hands-on help? I offer consulting engagements from targeted investigations to ongoing retainers. Want a quick sanity check before committing to a full engagement? Schedule a call — no commitment required.
sp_HumanEvents: Tracking Blocking, Compiles, and Recompiles

First Day Angry


sp_HumanEvents

Going Further


If this is the kind of SQL Server stuff you love learning about, you’ll love my training. Blog readers get 25% off the Everything Bundle — over 100 hours of performance tuning content. Need hands-on help? I offer consulting engagements from targeted investigations to ongoing retainers. Want a quick sanity check before committing to a full engagement? Schedule a call — no commitment required.
sp_HumanEvents: Getting Help

All I Wanted Was A Pepsi


sp_HumanEvents

Video Summary

In this video, I introduce SP_human_events, a stored procedure designed to make extended events more accessible for SQL Server users. I delve into the help parameter and how it can be used to get additional support or clarification on specific issues. The video covers various parameters and their default values, limitations such as memory constraints and compatibility requirements, and provides example calls to demonstrate its usage in different scenarios. While this procedure aims to simplify extended events for you, I emphasize that proper use is crucial to avoid potential problems with your SQL Server. If you need more detailed assistance or have specific questions, the video encourages viewers to visit my GitHub repo where they can ask questions, submit issues, and even contribute code fixes if needed.

Full Transcript

Et voila! Here we are with the second video to introduce SP underscore human events, my stored procedure to help make extended events a little bit more accessible to the fine people of Planet SQL Server. And this video is just going to be a short one about the help parameter and how you can use it to get more help. Now, if you are watching this video, pay careful attention to the upload information on the YouTube. If you are watching this video far into the future, there’s a pretty good chance this stuff has changed. Actually, there’s a pretty good chance this stuff will change like tomorrow. Because I’m, I’m, I am always working on this thing to make it better for you fine people. And, um, yeah, so there’s that. Uh, anyway, it, it, this is just about getting help. And if you’re here, I assume you need help or want help or I don’t know, there’s something wrong in your life.

Maybe this stored procedure will fix it. Maybe it won’t. I don’t know. But anyway, uh, the first thing that I have to start off with here is a warning. If you misuse this thing, you can cause problems. If you do something terrible with this stored procedure, you can harm your precious SQL Server. So don’t misuse it. If I give you a car and a bottle of whiskey, it is up to you as an adult, probably human being to make a sane and rational choice with what to do with that combination of items. Just like it is up to you as a sane and rational human being to, um, make a sane and rational choice about what to do with the combination of parameters that you feed in to SP human events.

So, that is the warning. If you need additional support, there is a very helpful, I promise not spam bit.ly link. Uh, there, where that’ll, that’ll bring you right to my GitHub repo where you can ask questions, um, create issues, submit code fixes. Just, just please open, open an issue first so we can at least talk about whether this is a good idea for you or not, or a good idea for the procedure or not. Um, and then the second section down is just a short sort of introduction. Uh, tells you what sort of issues we can, uh, track down using SP human events.

And then if we go a little bit further, we, I discuss some of the limitations. Uh, first is that you need to be on at least SQL Server 2012 or higher. That does not set a very high bar. Um, but if you’re on SQL Server 2008, you are out of luck. You better call Saul. Um, the second is that, uh, this is designed to make things easier. And, uh, one way to make things hard is to present someone with many, many options.

And I do not want to make extended events harder for you. I want to make them easier for you. So, some customizations are limited. Um, you know, also the more customizations I offer, the more complicated dynamic SQL gets, and the more time I spend drinking and the more chances there are of there being bugs. And I just don’t want that for you.

Um, a couple of things down here are, I don’t want to create files. Uh, one of the chief things that extended events do or can do is create an event file to track, uh, information into stored data in. And I just don’t want to do that. That introduces, um, the potential to, uh, you know, write a, you know, big, big files out to your SQL Server somewhere. And there’s not an, there’s not a good, easy way to clean them up unless I use XP command shell.

And I just don’t like it. Uh, I don’t want to check file path validity. I don’t want to have to deal with Azure file paths that start with HTTP. It’s not, it’s not, it’s not, not fun. I did that with SP blitz lock, not doing that here. Um, so with the use of the ring buffer, which I am using, which is just an in memory, um, chunk of information, there are some limitations.

You may not see full event information and, uh, we may wrap around, uh, during the time that we choose to collect information because I am choosing intentionally not to use more than one gig of memory in order to store this data in. Um, I will perhaps make that configurable someday, but today it is not.

Uh, the other thing is that if you want to use the blocking event, you will need to turn on the blocked process report. If you try blocking, if you try to view blocking and you don’t have that turned on, you will get, um, uh, an error and you will get the code needed to turn on the blocked process report.

You can also get it from this URL or URI depending on, uh, how much of a geek you are, whatever you want to call it. The next section down describes some of the parameters in this fine store procedure. Uh, we have event type, which you use to choose which session you want to spin up.

You can use blocking, query, weights, recompile, compiles, and cert, excuse me, certain variations on those words. So you can just put in block, query, queries, wait, weights, recompiles, recompilations, uh, compiles, compilations. There’s a, we, we account for a lot of different things in there.

I, I don’t expect you to be exactly on top of the wording here. Um, and then a little bit over, we see the default values for things. So then we have some other filters, uh, query duration.

We have a query sort order for which way you want to order data. If you do choose the query event, um, how long things would have to block for in order to qualify, um, weight type. So this can either be a single weight that you want to monitor, or it can be a CSV list of weight types.

Uh, the minimum duration for a weight, uh, if you want to capture execution plans. And then some other filters for, um, if you want to filter to a specific client or host or database or session ID. Or if you want to sample a workload.

So you’re probably wondering why session ID isn’t in VARCAR. And I bet you’re sitting there gritting your teeth and saying, Eric, you’re not following best practices.

You’re storing a number as a string. You’re a bad person. Well, that’s because you have choices. You can either put in a number, which I will dutifully check using, not using is numeric to make sure that you have entered a valid number. Or you can put in the word sample or sampled.

And you can put in a divisor. And what this will do is allow you to sample an entire workload by, uh, figuring out which session IDs, uh, evenly divide by the number you choose as a divisor and only getting information for those. So if you have thousands of sessions and you say, I want only want sessions that divide evenly by a hundred, we can narrow down the amount of data we’re collecting for.

We can also filter to a username, an object name. And if you’re using the block, so this is where things get a little tricky. If you’re using the blocking session, uh, or the event session here, um, that it can, for some reason it doesn’t use, it can’t filter to an object name.

It can only filter to an object ID. So if you’re using blocking, or if you’re using blocking, you want to filter to a specific table, we also need the schema of that table. By, by default that goes to DBO.

But if you need a different schema, you can put that in there. If you’re just searching for a store procedure name, you don’t need to put that in there. Uh, then we also have some filters for, um, excuse me, my mouse wheel is all amok, uh, for how long you want to run the session for. And, like a lot of things, I don’t want to put in, I don’t want to allow you to put in what I think are bad idea, parameters, without some warning.

So, uh, there are some values for some of those filters, especially like very low millisecond weights on things, where, um, if, if you, if you put in values that I deem, whack-a-do, then you will have to use the gimmeDanger parameter set to one in order to use those. Otherwise, I will set them back to what I consider to be same values or throw an error, depending on what I care about most.

Uh, then we have this keep alive one. This isn’t functional yet. Um, I’m working on the ability to, uh, put data into the ring buffer, move it out and into real tables. And, uh, those were, that would, that would allow sessions to stay alive longer.

Um, but that is not functional yet. That will be something that happens in a future release. I wanted to get, uh, an MVP out there for people to start kicking around before I started adding more, uh, more involved features. Uh, the next section down is a list of, uh, example calls to the stored procedure.

So some different, so different ways to look at things in different scenarios. Uh, that’s all very useful stuff. I’m not going to read it all out loud for you because it’s all fairly self-explanatory once you get to reading it. And of course, like every, oh, well, I think like most of the code that I write, uh, this is MIT license.

It is completely open source. Uh, I don’t want to print the entire MIT license out here. I tried a few different variations on that and none of them were good. But if, uh, if you use help and you go over to the massages tab, uh, you will see the full MIT license printout in all its open source glory, making Richard Stallman a very happy person. I think maybe, I don’t know.

I am doing this on, on windows or SQL Server, which is decidedly not free software. So maybe, maybe not like happy, happy, maybe just like, I don’t know, a little bit less miserable. I don’t know. I don’t, I don’t know how to predict that.

Anyway, um, I think that’s it for the help section. Uh, yeah, that, that, that about wraps it up. That’s, that’s all I have in here for now, but I hope that, uh, you found this useful and informative and that, um, me, me rambling on and on in this short video. Uh, helps you learn a few things about how the proper use and functioning of, um, sp underscore human events.

Uh, I’m going to start recording some other videos about actual use cases. So I will see you in those. Au revoir.

Going Further


If this is the kind of SQL Server stuff you love learning about, you’ll love my training. Blog readers get 25% off the Everything Bundle — over 100 hours of performance tuning content. Need hands-on help? I offer consulting engagements from targeted investigations to ongoing retainers. Want a quick sanity check before committing to a full engagement? Schedule a call — no commitment required.
Introducing sp_HumanEvents: Making SQL Server Extended Events Easy For Everyone

Put Up Or Shut Up


Video Summary

In this video, I introduce a new stored procedure called SP_human_events that aims to make extended events more accessible and user-friendly for SQL Server administrators and developers. Extended events are powerful tools but often come with a steep learning curve due to their complex setup and the need to work with XML data. This stored procedure simplifies the process by allowing you to capture common performance tuning issues like blocking, query performance, query compilations, query recompiles, and wait stats in a more user-friendly manner. With SP_human_events, you can sample and collect relevant information for just 5 to 30 seconds, providing detailed insights into what was happening on your server during that period without overwhelming the system or requiring extensive setup.

Full Transcript

It’s another exciting, thrilling, scintillating Saturday. And here I am recording things that hopefully will meet your high standards of YouTube video watching, whatever that is. Some real crap on YouTube. I’m just kidding, YouTube. You’re great. You’re wonderful. You’re full of really wonderful people, really high quality. gear. Alright, so you’re probably wondering what the point of this video is. And this is a very exciting video for me. Because I am going to introduce a stored procedure that I’ve been working on lately called SP underscore human events. And I know that that sounds like a sort of ridiculous stored procedure to work with SQL Server for, but it is my attempt to make a extended events a little bit more accessible to you human beings out there. Now, with extended events as an end user, there are a lot of barriers to entry. You would have to, like, especially if you were trying to figure something out on the spot, you were probably, like, tanked. There was no way you were going to figure everything out fast enough to get it set up, running, getting the right stuff, all that. If you had, like, a lot of things that you could use, you could use it to get it to be.

If you had a lot of time ahead of you, or a lot of time beforehand, English-ing. If you had a lot of time beforehand to, like, research and test things and work with stuff, then sure, you could have an event session set up to get what you need to get. But if you were just, like, on the spot, like, ooh, I really need to go figure out this problem, you, it would be very difficult. You would have to know which events to collect, which information to collect. And if you wanted deeper information, you would have to query XML data. Yes, XML data. You would have to write XPath. And the year of, oh, I don’t know, how long, how old are extended events? 12 years old and haven’t figured out something better than XML for them? Yeah, I don’t know. You’re not getting past that one. If you want better, you need to mess with XML. And Microsoft never made your experience with extended events pleasant. They, sure, they put a lot of technical time into it, but there was no user experience time put into it. Everything about it just smelled like, yeah, just get something to work.

The extended events GUI is just pure misery for everyone to use. I’ve worked with clients who are just like, I can’t, you can’t do this. I don’t want to do this. This is, this is awful. No one likes it. It’s got really confusing Excel style aggregations. You have to like choose 40 different things to get it to group stuff together. And it’s really, really slow when you need to sort or filter large data sets. There have been times when like, you know, I’ve, I’ve run a session for a little while and, you know, because of my own, my own mistake, I captured a lot of data and I was like, oh, well, I just need to filter this by what used the most CPU.

It would sit there for two minutes and then SSMS would crash after trying to sort the data. So it was just not fun. And of course there was also the sort of crapshoot of choosing which columns to display because it would always be like, oh, get all of them. These are mostly no. Why are they all no? Why, why is there no information? He’s okay. Get rid of those. Okay. Wait, wait, wait, but what if there’s, what if we get information in those? You should keep those. And then this is like, you ended up with this like giant sort of clunky, hard to correlate data. And I mean, again, like Excel, Excel file. And that was just no fun either.

And if you wanted to query the DMVs, you had to be as smart as Jonathan Cahias. I mean, that’s tough to do. He wrote queries and there were and signs in them. And I was all freaked out, like capabilities and one equals something. And it’s hard. It’s hard work. I get, I’m like shell shocked from thinking about simple things that I’ve, I’ve tried to do querying the extended event data to try and like figure out what I need to go and look at and search on it, what’s valid and what’s not. It’s, it’s, it’s unpleasant experience. I mean, it’s contributed heavily to my drinking problem.

And a lot of the stuff in extended events was never terribly well documented. And the documentation always seemed to be a little bit lacking. Measurements could be in microseconds or milliseconds. Events sometimes had descriptions that were just the event name. There was no like further detail on them. And a lot of them just like didn’t return very helpful information.

You’d see these like very promising event names and they would return like, uh, op code. It’s like, okay, well, that doesn’t help me much. And there was always times when basic information was missing when you went to set up an event. You’re like, okay, well, I really want all this stuff. And what does this stuff mean? Cool, cool, cool, cool. Blank line.

So, I don’t like that. I am not a fan of that. I am not fan. And I’m not a fan of making technology harder to use. And that seemed to be the goal with a lot of this stuff.

And the way that I directed my frustration with SQL Server being harder to use was by contributing to the SP Blitz scripts, the open source first responder kit. And I think the one problem that I always faced when trying to troubleshoot performance issues on a server was, you know, we had the ability to analyze what’s there, right? We could very easily look at existing data.

We could look at what indexes are there and we could look at their usage metrics, all that good stuff. We could look in the plan cache and we could analyze that XML to death. We could look at wait stats aggregated since the last restart or since some nudnik cleared out wait stats on the server.

And we could also do a good job of seeing what’s currently happening, right? Like you could hit F5 and you could see what was executing. And there were a lot of times when that would be enough to catch issues.

We could also, with SP Blitz first, sort of do a sampling of performance counters. So, like, look at wait stats for a duration of time or look at perfmon counters for a duration of time. But the problem that I would always run into with that stuff is that we would get the before and after, but not really the during, right?

Like all the stuff, like you would get, like, let’s say you ran SP Blitz first and you did it for 10 seconds. You would start up, it would take a sampling of a whole bunch of performance counters. It would wait for 10 seconds and then it would take another sampling and kind of give you the delta.

That’s great. That’s really, really helpful. But you never saw what caused all this stuff in between, right? There was, like, that 10-second window of something happening.

But we didn’t know what. Like, we could see that, like, it caused certain wait stats. We could see that they caused certain perfmon counters to tick up. We could see a lot of things, but we could never see exactly what caused them.

Unless we got very lucky and we saw, like, the queries, like, they would take a snapshot with SP Blitz who at the beginning and end. We would see, okay, like, you know, are we, like, what was happening here, what was happening here, but not all the things that happened from one into the other. And clients, a lot of times, would have problems that were faster than hitting the, than you could hit the F5 button.

You would have to try to catch sub-second queries, and that’s very difficult. You could sit there hitting F5, but then if you hit F5 and you catch something and you’re, like, on a roll hitting F5, and then you hit F5 again when you get, and it goes away. Okay, and that’s, that’s tough too.

And, you know, even fancy monitoring tools have thresholds for, like, what they’re going to gather. And I don’t blame them. I wouldn’t want to see a monitoring tool that captured every single thing.

But sometimes you have to capture that really tough stuff in order to get the information that you need out of SQL Server to solve problems. Now, what I, what I wanted to do with the initial offering of SP underscore human events was to give you a sort of easy way to capture some common performance tuning issues. So, blocking, query performance, query compilations, query recompiles, and wait stats.

And what I do, it’s a little bit different from what the Blitz scripts do here, is not only do I let you set off and sample stuff for a period of time, but I capture all the stuff that you’re interested in for that period of time. Now, this is targeted.

You can only choose one thing at a time to collect information on right now, because I don’t want to overwhelm people with stuff. And, you know, I also don’t want you to overwhelm your server by collecting stuff. You know, any, any tool that you use to monitor performance is going to have what’s called observer overhead.

You’re going to introduce, you know, some, you know, some amount of overhead collecting the data that you need to find a problem. So, this tool is best run, you know, again, sort of like SP Blitz first, for around 5 to 30 seconds to capture very specific issues. It will help give you a much better idea of what’s happening on your server for that period of time, because it’s not just a before and after.

It’s all the stuff that we need to figure out what was going on while the thing ran. It has a lot of configurable options, but not so many that I think they are overwhelming. And it also works pretty well with the defaults, too.

I wanted to sort of make it like SP who is active, so you could just pop it out, hit F5, and collect some information without having to think too much up front about what you want to collect. And sometimes, you know, you would want to see the results before you decided what other stuff to collect or what different stuff to collect. So, there is that, too.

Anyway, that’s enough of this boring-ass PowerPoint. And I’m going to record some more videos where I am going to talk about, or we’re going to show you exactly how it works. So, I’ll see you there.

So, I’ll see you there.

Going Further


If this is the kind of SQL Server stuff you love learning about, you’ll love my training. Blog readers get 25% off the Everything Bundle — over 100 hours of performance tuning content. Need hands-on help? I offer consulting engagements from targeted investigations to ongoing retainers. Want a quick sanity check before committing to a full engagement? Schedule a call — no commitment required.
sp_HumanEvents: Usage and Guidelines

Yessaduh


I talked a little about why I wrote this procedure. In a nutshell, I think it’s absurd to expect people to adopt something that’s hard to use, and then wonder why no one’s using it. In general, I think SQL Server users deserve far better tools than we get. I understand that it’s difficult to balance “ease of use” with “depth of use”, but after 12+ years Extended Events is still a stink bomb for most people to untangle.

One thing I want to make very clear: If you’re reading this in March-ish of 2020, this is V1-ish of the public code. I expect people to find bugs and incompatibilities. I expect people to want additional features. If you fall into one of those categories, please open an issue on GitHub. Even if you have code you want to submit, open the issue first so I can track it easier.

The thing is, you probably have to use this in order to test it. So let’s make that easy for you.

First step: get it and install it.

I Know You’ve Got Problems


If you’re here, you’ve likely used some of the Blitz scripts over the years. They may have diagnosed some issues that were tough to really track down, too.

sp_BlitzIndex may have told you about Aggressive Locking, sp_BlitzCache may have told you about queries with high duration and low CPU, sp_BlitzFirst may have warned about compiles or recompiles, and so on. Now you’ve got a way to try to find those. You still need to be looking at the server, but it does make the process a little bit easier.

Here are some example calls to get you started.

To capture all types of “completed” queries that have run for at least one second, for 20 seconds, from a specific database

EXEC dbo.sp_HumanEvents @event_type = 'query', @query_duration_ms = 1000, @seconds_sample = 20, @database_name = 'YourMom';

Maybe you want to filter out queries that have asked for a bit of memory:

EXEC dbo.sp_HumanEvents @event_type = 'query', @query_duration_ms = 1000, @seconds_sample = 20, @requested_memory_mb = 1024;

Or maybe you want to find unparameterized queries from a poorly written app that constructs strings in ugly ways, but it generates a lot of queries so you only want data on about a third of them.

EXEC dbo.sp_HumanEvents @event_type = 'compilations', @client_app_name = N'GL00SNIFЯ', @session_id = 'sample', @sample_divisor = 3;

Perhaps you think queries recompiling are the cause of your problems! Heck, they might be. Have you tried removing recompile hints? ?

EXEC dbo.sp_HumanEvents @event_type = 'recompilations', @seconds_sample = 30;

Look, blocking is annoying. Just turn on RCSI, you goblin. Unless you’re not allowed to.

EXEC dbo.sp_HumanEvents @event_type = 'blocking', @seconds_sample = 60, @blocking_duration_ms = 5000;

If you want to track wait stats, this’ll work pretty well. Keep in mind “all” is a focused list of “interesting” waits to queries, not every wait stat.

EXEC dbo.sp_HumanEvents @event_type = 'waits', @wait_duration_ms = 10, @seconds_sample = 100, @wait_type = N'all';

Note that THREADPOOL is SOS_WORKER in xe-land. why? I dunno.

EXEC dbo.sp_HumanEvents @event_type = 'waits', @wait_duration_ms = 10, @seconds_sample = 100, @wait_type = N'SOS_WORKER,RESOURCE_SEMAPHORE';

C’mon Turn Me On


There’s a lot of possibilities here! If you think I’ve missed something, or if you run into an issue, let me know on GitHub. My goal is to make this nice and easy for people to use to find and fix problems with their SQL Servers.

If you need help with that, drop me a line. I do happen to enjoy my job.

Thanks for reading!

Going Further


If this is the kind of SQL Server stuff you love learning about, you’ll love my training. Blog readers get 25% off the Everything Bundle — over 100 hours of performance tuning content. Need hands-on help? I offer consulting engagements from targeted investigations to ongoing retainers. Want a quick sanity check before committing to a full engagement? Schedule a call — no commitment required.
Interpreting Key Lookups In SQL Server Query Plans Can Be Tricky

This Looks Bonkers!


SQL Server Query Plan
I’d cut mines off.

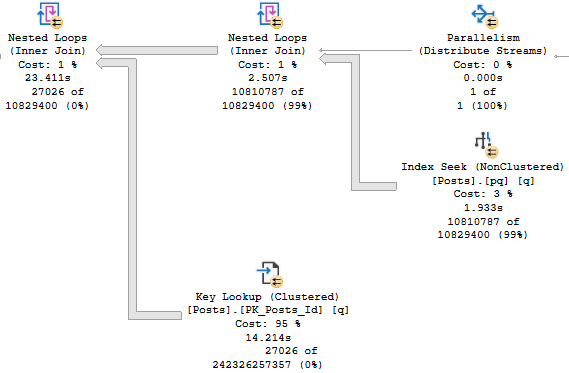
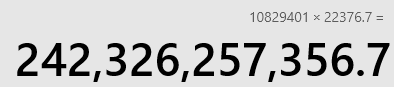
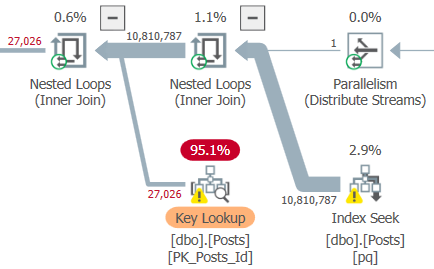
If you’ve ever read Kim Tripp’s wonderful post on tipping points, you’re probably staring at this Key Lookup and wondering why SQL Server would ever even consider it here. That’s like a 12 digit number. Twelve. That’s like a foreign phone number. That’s like what I spent on cheese plates last year.

I kid, I kid. Though I would not be opposed to that lifestyle.

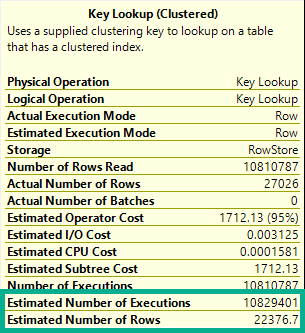
The thing is, what that number represents is a little different from what we might first expect.

That number comes from multiplying these two numbers:

SQL Server Query Plan Tool Tip
Medley
2020 02 19 18 41 49
Pass the brie

But Really


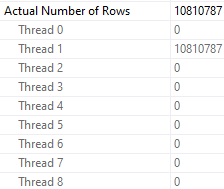
That’s how many rows we read. Which isn’t great, obviously. Look how long that thing runs for.

And it gets worse when we examine how rows were distributed on threads.

2020 02 19 18 49 55
[deep breaths]
We produced far fewer rows than that in all, because the Lookup is evaluating a predicate, which only produces ~27k rows.

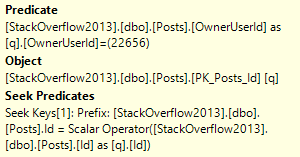
So for each of the ~11 million rows that comes out of the index seek of our nonclustered index, we:

  • “Join” it to the clustered index based on the clustered index key column
  • Evaluate if the OwnerUserId for that row is 22656
SQL Server Query Plan Tool Tip
“ONLY”

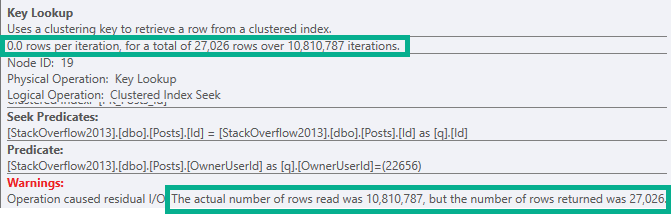
The 27,062 number is how many rows are produced after the filter is applied. That’s a bit more obvious when using Plan Explorer.

SQL Server Query Plan
I can’t go a day without my scotch.
SQL Server Query Plan Tool Tip
Do Be Real, Please

This lookup doesn’t produce any rows or columns, that’s why there are 0.0 rows per iteration.

It’s purely to filter data out, and it does that. Slowly.

Look, I’m not defending the choice, I’m just using it to teach you something.

How Can You Fix It?


In this case, it would probably be worth adding the OwnerUserId column to the nonclustered index we already have on Posts that’s being used in this query, assuming that it wouldn’t be disruptive to other queries. If that’s not possible, then a new index that satisfies the entire where clause would be a good solution.

If neither of those is palatable, then you might try some exotic rewrites to isolate those rows, correlate on a different column, or “persuade” the optimize to stop pursuing nested loops joins.

Thanks for reading!

Going Further


If this is the kind of SQL Server stuff you love learning about, you’ll love my training. Blog readers get 25% off the Everything Bundle — over 100 hours of performance tuning content. Need hands-on help? I offer consulting engagements from targeted investigations to ongoing retainers. Want a quick sanity check before committing to a full engagement? Schedule a call — no commitment required.
Why Index Tuning Is An Iterative Process In SQL Server

Here And There


For many people, index tuning means occasionally adding an index when there’s a report about a slow query. Those indexes might come from a query plan, or from the missing index DMVs, where SQL Server stores every complaint the optimizer files when it thinks an index might make a query better.

Sure, there are some people who think index tuning means rebuilding indexes or running DTA and checking all the boxes, but I ban those IP addresses.

Of course, there’s a whole lot more to index tuning. Adding indexes is fine to a point, but you really should spring clean those suckers once in a while, too.

Look for overlapping indexes, unused indexes, and check for any Heaps that may have snuck in there. sp_BlitzIndex is a pretty cool tool for that.

But even for adding indexes, sometimes it takes more than one pass, especially if you’re taking advice from query plans and DMVs.

How The What


Let’s say you’re looking at a server for the first time, or you’re not quite comfortable with designing your own indexes. No judgment, there.

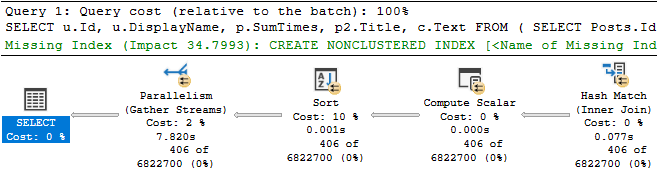
You see a query plan for some piece of code that’s running slowly, and it has a missing index request.

SQL Server Query Plan
Sugar Sugar Sugar

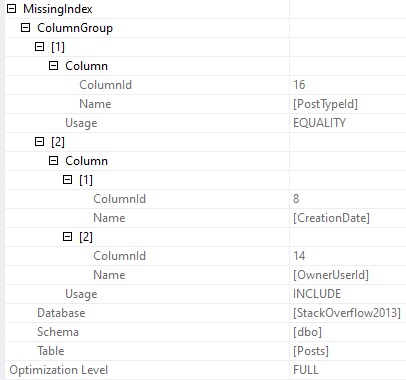
There’s only one missing index request — there’s not a bunch of hidden ones like in some plans — and it looks moderately helpful so you decide to try it.

SQL Server Missing Index Request
Treefiddy

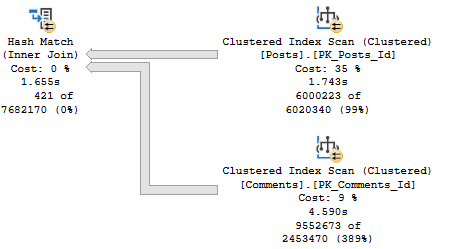
The thing is that as far as “stuff I want to go faster” in the plan, the clustered index scan on Posts is about 3x faster than the clustered index scan on Comments.

SQL Server Query Plan
Deal with it

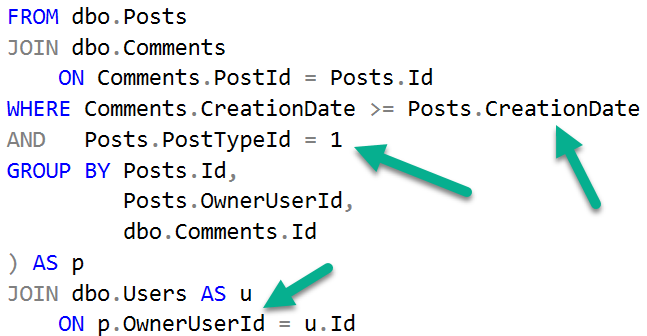
And the index that’s being asked for is only going to help us find PostTypeId = 1. It’s not going to help with the rest of or join or filtering very much.

CREATE NONCLUSTERED INDEX [<Name of Missing Index, sysname,>]
ON [dbo].[Posts] ([PostTypeId])
INCLUDE ([CreationDate],[OwnerUserId])
SQL Server Query
Una Posta

We still need to filter on CreationDate, and join on OwnerUserId later. Sometimes this index will be “good enough” and other times it “won’t”.

If PostTypeId were really selective, or if this query were searching for a particularly selective PostTypeId, then it’d probably be okay-ish.

But we’re not, so we may settle on this index instead.

CREATE NONCLUSTERED INDEX p
ON [dbo].[Posts] ([PostTypeId], [CreationDate], [OwnerUserId]);

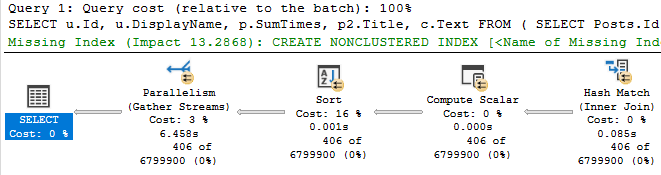
With that in place, we only get marginal improvement in the timing of the plan. It’s about 1.5 seconds faster.

Probably not what we’d wanna report to end users.

SQL Server Query Plan
Hella

But we have new green text! This time it’s for the Comments table, which is where our pain point lies time-wise.

CREATE NONCLUSTERED INDEX [<Name of Missing Index, sysname,>]
ON [dbo].[Comments] ([PostId],[CreationDate])

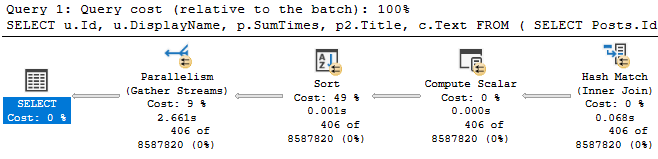
We add that, and reduce our query runtime to less than half of what it was originally.

SQL Server Query Plan
Babewood

Is 2.6 seconds good? Or great? All depends on expectations.

Could we keep going and experimenting? Sure.

It all depends what we’re allowed to change, what our skill level is (mine is quite low, ho ho ho), and what our priorities are (these are also quite low).

This Is Just One Query


And since we had the luxury of having it in front of us, running it, adding an index, running it again to test the index, etc., we were able to spot the second index request that ended up helping even more than the first one.

If you don’t have that luxury, or if you just poke around the missing index DMVs every 3-6 months, you could miss stuff like this. Sure, that first request would be there, and it might look tempting enough for you to add, but the second one wouldn’t appear until after that. That’s the one that really helped.

Whenever you’re tuning indexes, or releasing code that’s going to use existing data in new ways, you’d be doing yourself a big favor to check in on this stuff at least weekly.

You might be an index tuning wiz and not need to — if you are, I’d be amazed if you made it this far into my blog post, though — or you may catch “obvious” new indexes during development.

But I’m going to tell you something about end users: they’re devious, mischievous, and they’re out to make you look bad.

As soon as they start using those new features of yours, they’re going to abuse them. They’re going to do all sorts of horrible things that you never would have dreamed of. And I’ll bet some different indexes would help you keep your good name.

Or at least your job.

Thanks for reading!

As a postscript to this: I don’t want you to think that missing index requests are the end-all be-all of indexing wisdom. There are lots of limitations, and suggested column order isn’t perfect. But if you’re just getting started, they’re a great way to start to understand indexing, and see the problems they do and don’t solve. And look, the only way to make them better would be to spend longer during compilation thinking about things. That’s not how the optimizer should be spending its time. We’re lucky to get these for free, and you should view them as a learning tool.

Going Further


If this is the kind of SQL Server stuff you love learning about, you’ll love my training. Blog readers get 25% off the Everything Bundle — over 100 hours of performance tuning content. Need hands-on help? I offer consulting engagements from targeted investigations to ongoing retainers. Want a quick sanity check before committing to a full engagement? Schedule a call — no commitment required.
Using sp_tableoption To Store LOB Data Off Row In SQL Server

Crazy That Medulla Oblongata


Video Summary

In this video, I explore an interesting and underutilized SQL Server option that can significantly impact performance in certain scenarios. Specifically, I demonstrate setting the table option to store large value types out of row, no matter their length, using the `sp_tableoption` stored procedure on the Stack Overflow database’s post table. By creating a copy of the post table and enabling this setting, I observed substantial reductions in read operations from the clustered index when querying the data that was previously stored in-row. The performance benefits were evident, with fewer logical reads and reduced wait times for page I/O operations, especially when dealing with large amounts of max data types like `varchar(max)` or `text`. This video provides insights into how this setting can be leveraged to optimize table designs where large data fields are common.

Full Transcript

Erik Darling here to talk about a sort of fun, underutilized option when it comes to SQL Server. Now, the option that I’m talking about is one that you can set at the table level using sys.sp table option. And the option that I’m going to talk about today is setting the table so that large value types are stored out of row, no matter what their length is. And what that means is if you have a table with large data types in it, like max data types, SQL Server will store up to like 8000 bytes of them, I believe. If I remember the documentation that I read several hours ago correctly, then it’ll store a good chunk of that data in row. But only after it gets past a certain amount of data in row, it’ll store up to 8000 bytes of them. And then if you have a certain size, it’ll store that data off row. So if you have like an in varchar 4000 or a varchar 8000 column, then those will always get stored in row or something like that. I don’t know. It’s all a little bit foggy. Last night’s a little bit foggy, to be honest. But I wanted to mess around a little bit with this setting, specifically in the stack overflow database. The database, the post table has this column called body that’s a varchar max and or in varchar max rather. And it’s, it’s, I mean, it’s gigantic. It’s where the body of every question and answer lives. So it’s a lot of just like, you know, long, long rambling internet nonsense. People talking about, I don’t know, computer, computers, maybe, I don’t know, whatever.

We can pay attention. But anyway, I think this is an interesting setting because you can, if you have a lot of lobbish data, you can drastically reduce the number of reads that you do against the clustered index. If you, as long as you’re not selecting off row data. So to do that, I created a copy of the post table. It’s not just this column, but I created the entire thing. And I named it post off row. And then after that, I set the table option to store large data types out of row. And then I inserted every single row from the regular post table into this post table.

They both have the exact same number of rows in them. There’s no weird tomfoolery magic witchcraft, I don’t know, black arts or whatever they call them. None of that’s going on. They are, they’re equally sized tables. And we can validate that by running spblitzindex. And looking at size and, I mean, other stuff, I guess. So this top, this top line is the regular post table. And if we scroll a little bit over to the right, we’ll have, we’ll see, oh, the size column.

The size column will tell us it’s about 17.1 million rows. And the table itself is 36 and a half gigs. And that four, about four and a half gigs of it is lob data. So stored off row. And about one mega stored in row overflow. Or about 0.1 meg stored in row overflow. I can read today. It’s great. I’m having a wonderful time. And if we scroll down a little bit further, we’ll have the results for the post table with the data stored off row.

And if we do the exact same thing, and scroll over a little bit to the right and look at the results, we’ll see that it has the exact same number of rows, just like I said. That the table is 34.6 gigs and that 31.8 of those gigs is stored as lob data. So this is stored not in row, but off row. Cool. Right? Cool. So let’s go look at what the performance implications of that is.

R. Is R. R. Is R. Fewer, more, less? I don’t know. And we’re going to do that in a couple different ways. So first off, I’m going to drop clean buffers. And when that finishes, I’m going to talk for like two seconds. And then I’m going to turn on query plans or else we will have nothing to look at.

And I’m going to run this simple count query. There’s no where clause. There’s nothing going on here that would be of, that’s going to cause any weird performance stuff. Now this is SQL Server 2019. And I do have enough memory assigned A to this, I mean A in my laptop and B assigned to the SQL Server instance to hold the full post table in memory. Okay. So I have like 50-ish gigs of memory just for this SQL Server instance.

And when this thing runs, it takes about 20 seconds. And that 20 seconds is pretty much all spent reading data from disk into memory. All right. So we had to read all that in. If we look at two things. One, let’s look at the wait stats for this query. Let’s go over here. And let’s see. We spent a whole lot of time waiting on page IOLatchSH.

So that is all reading pages from disk into memory. There are some other less consequential waits like memory allocation and SOS schedule yield and blah, blah, blah. And now, so we know that we spent the majority of our time waiting on that. So reading pages from disk into memory. And even though this happened in batch mode, it doesn’t really affect that portion of the operation.

We still have to get stuff from disk into memory. And before you accuse me of having crappy disks, I have excellent disks in this laptop. They are like one terabyte Opal SSD, whatever they call them. You can go look them up, the P51 stuff on Lenovo. I have good drives in here.

And if we go to the properties of the index scan, we can look at actual I.O. statistics. And if we look at the reads over here, we’ll have two numbers of semi-note. There is actual logical reads and read-ahead reads.

So for the actual logical reads, that’s a 4178042. That’s a seven-digit number. So we did 4 million logical reads, 4.1 million logical reads. And just about the same number of those were read-ahead reads.

I should learn how to zoom it someday. So we did a bunch of read-aheads and we did a bunch of logical reads. Now, this is only really, really painful when data is not already in memory, at least from what I can tell. If I run this count query again, it’s not going to take anywhere near 20 seconds.

One stuff is already in memory. That count query finishes in just under two seconds. So 1.8 seconds there. The thing is, that’s a pretty dramatic departure from what happens when we select a count from the off-road table.

So now we’re going to do that. So we dropped clean buffers. So there’s no data in memory right now.

We’re going to start with a cold cache. The first time we did that for this, that took 20 seconds. So let’s run this query. Now that finished in 1.6 seconds.

And if we look at the wait stats for that, we’ll come over here and up at the top we have page.io.hsh, but instead of 20 seconds, it was 2 seconds.

Another cool thing is if we look at the IO stats for this, and we look at… Oops.

I didn’t go in the right thing. I didn’t expand the right thing. If we look at the logical reads and read-ahead reads, these are now only a six-digit number. These are not… We did not do millions of logical reads.

We did a few hundred thousand, so about 400,000. I want to say that’s like about 10% of the reads that we did on last time. There were like 4.1 million or something.

Now we’re down to 370,000. So a little under 10%. So we reduced that number by quite a bit because it didn’t have to read through all of that crazy in-row lob data, lob-ish data.

And now, of course, the second time we run this, this will be substantially faster as well. Now with this data already in memory, that takes about half a second. So we went from about 1.5 seconds down to about half a second just to read the data that was already in memory.

So pretty clearly here, that off-row option is helpful for the POST table. Now, like I was saying before, batch mode does not make any particular difference for this.

So again, if we clear data out and I run this query where I’m specifically telling SQL Server not to use batch mode at all for any operator in here.

In the previous queries, we did use batch mode on the clustered index scan. It’s not going to make any difference for how long it takes SQL Server to read the pages from disk into memory.

This is not something that I think batch mode has a side effect on. So this took just about 20 seconds as well without batch mode, just about half a second over there.

And of course, without batch mode, the second run of this will be pretty quick, still about 1.8-ish seconds, I believe, or two and a half seconds. So batch mode helped a little bit there.

But then if we get rid of everything in memory and we just go back to reading the off-road table, even without batch mode, this is still relatively quick as well, about 1.7 seconds there.

And then a second run of this once the table is already in memory is about one second. So yeah. Where this is interesting, and I mean, I’m dealing with a pretty specific case here where there is a lot of data stored in row for the post table.

And having that data stored in row means that we have, you know, a larger index altogether that we have to kind of read through to get information out.

With the data stored off-row, we have a much smaller index because that’s all over there. Now, yes, this, you know, I have to do some more testing on this, but this is what I could fit into, like, a 10-minute video for you goldfish out there.

But as well, yeah, I have some more testing to do on this to look at, you know, what happens when we do need that body column. What are the performance implications of if, you know, we select that or, you know, do something terrible with that data because it is max data type and it is fairly large.

So anyway, I’m going to end this video and then go back to tinkering with this set of fun stuff on a Monday. Thank you for watching, and I’ll see you soon-ish because I have to poke around a little and then whatever.

Goodbye. Goodbye.

Going Further


If this is the kind of SQL Server stuff you love learning about, you’ll love my training. Blog readers get 25% off the Everything Bundle — over 100 hours of performance tuning content. Need hands-on help? I offer consulting engagements from targeted investigations to ongoing retainers. Want a quick sanity check before committing to a full engagement? Schedule a call — no commitment required.
Why Filtered Indexes Are Broken In SQL Server

Fix Your Indexes, Pal


Video Summary

In this video, I explore the nuances of filtered indexes in SQL Server and why they might not always be used as expected. I set up a simple query to count posts based on certain conditions and created two indexes tailored to these conditions. However, when running the query, I noticed that SQL Server did not use one of the indexes designed specifically for filtering out null values from the community owned date column. This led me to investigate further and discovered that including the community owned date in the index definition was necessary for the filter to work as intended. The video delves into why this happens and provides a solution, which could be particularly useful for those working with filtered indexes to exclude nulls or other specific values. I also share a link to a related issue on Connect and mention Aaron Bertrand’s reference to Ladybug, hoping it might help others facing similar challenges.

Full Transcript

You know what would be fun if me writing demos were entertaining at all? I’ve seen Chrissy Lemair’s live streams of her coding things and me writing demos would not be entertaining at all to anybody. So I’m going to leave that. Leave that idea. Let that idea die. What I want to talk about in this video is where filtered indexes are broken. I don’t mean broken like they don’t filter data or something. I just mean filter like you might not see them used. So we have a simple query here. And I call it a simple query because I usually I try to write queries to be as simple as possible to get the point of the demo across. So we have a count in here. And this count is against the post table. And we’re counting where the parent ID in the post table equals the ID from out here and the score is greater than zero. And from the outer count, we are filtering on where community owned date is null. So fairly simple stuff. It’s a count with an account, sort of a join inside. And to satisfy this query, to make sure that this query is satisfied.

I have created two indexes. One index that satisfies, I think, fairly well the inner query where we need to hit, we need to see where parent ID is equal to q.id and score is greater than zero. And this other index on ID where community owned date is null to make sure that we can filter down to this. Now I should have already created these. It’s been a weird day. So yes, I did. Good job. What I’m going to do is turn on execution plans because without them we would not have much of anything to look at. And I’m going to run this query. And we are going to sit and wait. Why are we going to wait so long? I don’t know. I don’t know. Apparently we had a lot of stuff to count. And when I go look at the execution plan, we are going to see something kind of funny. SQL Server used this index down here to great effect, wonderful effect. Yes, wonderful effect. 1.7 seconds spent in that index. And up here though, we see that we did not use our filtered index. We read all 17 million rows of the post table. And because of that, we spent, I don’t know, 10 seconds there. And I don’t know, we just didn’t have a good time generally running this query.

Now what I want to do is tag this index back in. I want to say, SQL Server, please use this index regardless of what you think your best judgment is. And I’m going to run this query again. And I don’t know. It’s not going to necessarily do any better. Doing better is actually not the point. The point is to figure out why SQL Server didn’t use that index to begin with. We have a question of SQL Server. Why? I asked you, I’ve created this index especially for you and you didn’t use it and I feel neglected and alone. I don’t think you take our relationship seriously. When we go look at the execution plan for this one, which took just about twice as long. Ooh la la. Some funny things happened. What is new in this plan? Well, we still hit the goat. The goat was fine.

But now we see that we hit this index and we did fairly well here, but 13 seconds in a key lookup. Bugger, what happened? What did we key lookup? Well, sadly, we evaluated our predicate. Community owned date is null over here. Even though that index is filtered on where community owned date is null. We don’t have any of those null values in there. SQL Server didn’t believe us. I mean, I hate when people say literally, but literally this index filters out anything where community owned date is null. What predicate is there to evaluate?

What could possibly be happening in there? Well, what we need to do in order to get this to be functional is include community owned date in the definition of the index. So we will, and this is maybe something that should be, would be obvious to some people, but we, we got away up with score not being in the index. It was just where score equals zero. And SQL Server had no problem with that.

But in order to get this to work, we need to include community owned date in the index definition. Why? I don’t know. It’s been called a bug. It’s been called an oversight. It’s been called a mistake. But I’ve been called all those same thing. So I don’t, I don’t really, I don’t really know what to think there. But now when I run this query, we will get our, I mean, it’s going to use our index because I’m telling SQL Server to use our index. And we’ll finish a few seconds faster than our previous time. But more importantly, we use our index and there is no, no key lookup malarkey or shenanigans.

So with creation date included in the index definition, we no longer have to do that. Now, this is, this seems to only happen with is null, is null filters. So if you are the type of person who creates filtered indexes to, to screen nulls out or, or whatever, then you may find this to be useful information. There is a link to fix this thing. And I think this thing has been hanging about since connect with a thing.

Aaron Bertrand recently referenced something called ladybug, which I am not, I’m not nearly old enough to recall. So best of luck there, Aaron. But there’s a shortened bit.ly link that goes to this link. So bit.ly forward slash uppercase B, uppercase F broken filters. These links are case sensitive. So if you do care enough to go and vote on things, you will have to type that in the, the, the long way, but I will put links to them in the video description so that you can exert minimal effort in your life.

It’s like with everything else. Anyway, that does it for me today. I am, I am done recording stuff. It is about 4 p.m. Eastern. And I am going to go drink now. I’m going to go enjoy my day. I’ve done enough for you. Anyway, thanks for watching. Hope you learned something. See you tomorrow. Maybe. I hope not. Goodbye.

Going Further


If this is the kind of SQL Server stuff you love learning about, you’ll love my training. Blog readers get 25% off the Everything Bundle — over 100 hours of performance tuning content. Need hands-on help? I offer consulting engagements from targeted investigations to ongoing retainers. Want a quick sanity check before committing to a full engagement? Schedule a call — no commitment required.
Rewriting Multi Statement Table Valued Functions To Fix SQL Server Performance Problems

Hey You Should Do This


Video Summary

In this video, I dive into the world of multi-statement table-valued functions and why they can be a performance nightmare in SQL Server. I share my experience of rewriting these functions to inline table-valued functions using startup expression predicates, demonstrating how to handle complex logic within them without compromising performance. I walk you through the process step-by-step, showing that even if your function has conditional blocks like `IF` statements, there are ways to refactor it into a more efficient form. By leveraging Common Table Expressions (CTEs) and careful predicate handling, we can achieve significant improvements in execution plans and overall query performance. So, whether you’re dealing with simple or complex logic within these functions, this video will equip you with the knowledge to tackle them head-on!

Full Transcript

I’m so ready. So ready to leave. I just have two videos left. After this one, there’s one video, but I have succumbed to my weaknesses, and it is champagne time at Shea Darling. And so, because it is champagne time, we should get this before it’s too much champagne time. So I wanted to talk about rewriting multi-statement table-valued functions, because they are generally bad for performance, even if the query that populates them is fairly simple. You just have like the goofy overhead of the table variable. On versions prior to SQL Server 2017, there was like almost no hope for these things. 2017 got something called interleaved execution, which gave you table cardinality for the, for like, cardinality estimates coming out of the function. Prior to that it was 100 rows for 2014 and one row for that. It was like a bad time. It was a bad time across the board.

The thing is when I talk to a lot of people, they’re like, I can’t rewrite this. It’s too complicated. There are if blocks. I’m like, yes, you can. Don’t be ridiculous. We can do this together. Hold your hand. Run through the, run, run through the field. Pick some flowers. I don’t know. It’ll be fun. Be romantic. So this is our multi-statement table-valued function. We have, it takes some stuff in here, user ID and a post type ID, and we declare a table variable with some columns in it. They’re all very, very useful, necessary columns. And then based on which post type ID we pass in, we will execute a block depending on, on that. And this is where people are often like, well, there’s just no way to do this. There’s no way to rewrite this.

I’m like, I’m very silly. Now, no, you, if, if you were to rewrite this, you couldn’t just do this, right? You couldn’t say this return table as, and then if blah, blah, do this, blah, blah, do this, blah, blah, do this. That will not work. There are red squiggles everywhere. We can see from the red squiggles that this will not work. This will not compile. If I try to create this, we’ll get, we’ll get some funk thrown at us. Incorrect syntax near the keyword if. Sorry to hear that. But what you can do inside of an inline table-valued function that does not require an if branch is take advantage of startup expression predicates.

And what I mean by that is we can stack some CTE. Now, this is a good use for CTE. I mean, granted, we could have used derived tables here or something too, but whatever. So what we’ll do is we’ll still pass in a user ID and a post type ID.

And what we’ll do is we’ll have a CTE called questions, and that’ll take care of the post type ID equals one stuff up here. And we’ll add a filter inside of here and say you only fire off if post type ID equals one. And we’ll do the same thing for answers and say you only fire off if post type ID equals two.

And we’ll do the same thing for other where if post type ID is greater than two, then we’ll fire this off. And then we’ll have a third CTE that is a union all of those three, right? So we have questions, answers. I don’t know why I put that in the kind of funny order, but questions, answers, and other.

And then we’ll just select the top one from that order by score descending. And this will work just fine, and it will work just wonderfully. And something that I think is nice about this is that even if we don’t need data from one of them, they won’t fire.

So the execution plan will be complicated. But if we look at it kind of closely, we’ll see that we only fired off and hit the post table the once. The rest of the time we got constant scans from the other two accesses there.

Now, oh rather, sorry, we have to quote this one out. That’s what I was doing wrong. Ha ha ha. If we quote this out, ooh la la, and we zoom out a little bit, we can see that we only touched the post table once.

We did not touch it three times because of the startup expression predicates. The three other times we got, or the two other times, rather, we got these constant scan operators. What I messed up before is that, you know, I ran the cross-apply part.

So even with this quoted out, that did happen. But if I flip things around and I bring this in and I bring this out and I get rid of you, and actually I should probably get rid of you too. There we go.

And we run this, the same thing will happen where SQL Server will look at what was going on and say, oh, I don’t need that first one. I’m only going to use that second one this time. And then if I need both, of course, then we’ll run both and we’ll get stuff from both, I guess. Lucky us.

All right. We got all that good stuff there. Yep. So we hit things twice because we had the two applies run. But anyway, that’s not really the point. The point is that there are ways to write more complicated multi-statement table-valued functions as inline table-valued functions.

It does take, you know, some practice. It does take some getting used to. But you can do it.

And you can often get much better performance from them in general. So that’s that. I don’t know. If you don’t like it, you don’t have to. Just do whatever you want.

It’s your life. Anyway, I’ll drink to that. I will see you over in the next video. We will talk about where filtered indexes are still broken.

See you there. Thanks for watching.

Going Further


If this is the kind of SQL Server stuff you love learning about, you’ll love my training. Blog readers get 25% off the Everything Bundle — over 100 hours of performance tuning content. Need hands-on help? I offer consulting engagements from targeted investigations to ongoing retainers. Want a quick sanity check before committing to a full engagement? Schedule a call — no commitment required.