The fleet wall is the screen the whole product opens on: one card per monitored server, banded green, amber, or red, with the sick ones sorted to the top. Its job is to answer “which server do I click” in one glance, whether you’re watching five servers or five hundred.
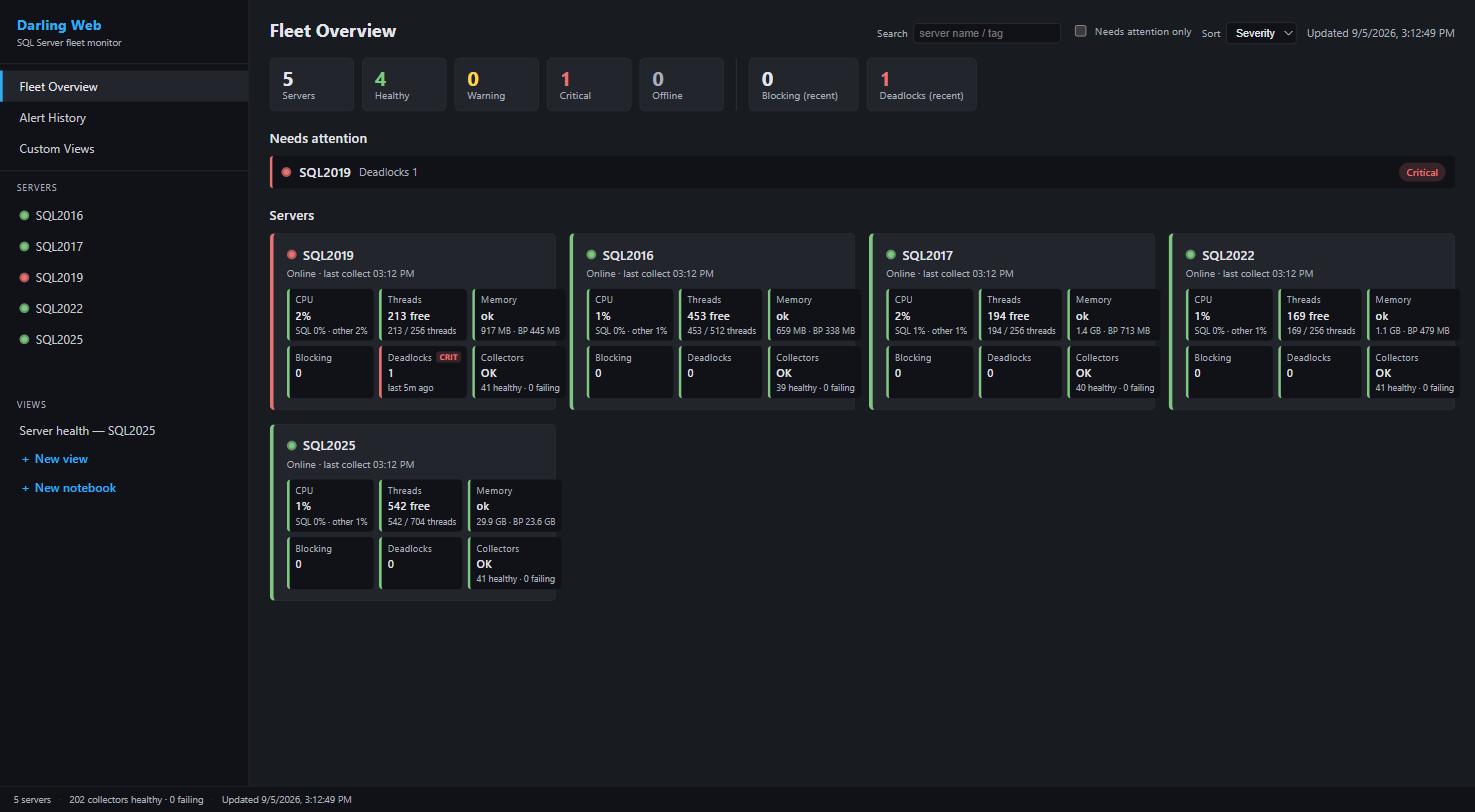
The web dashboard’s Fleet Overview. SQL2019 is flagged Critical for a deadlock, so it’s first.
What’s On a Card
Each card carries a status dot and six per-metric health bands: CPU (total non-idle, with the SQL-only number alongside), worker threads, memory, blocking, deadlocks, and collector health, plus the last collection time. The banding happens server-side, so the browser only renders. Above the cards, a worst-first “Needs attention” list surfaces what to look at, or a single all-healthy line when there’s nothing to chase.
Status comes from collection freshness, not a live ping. The monitor never probes your servers to decide how to paint them: a server that reported recently is Online, one that’s gone quiet flips to Offline, and one that has never reported shows an amber “Awaiting first collection” instead of a fake red. When a server goes dark, that’s also an alert, not just a color.
Finding Things in a Big Fleet
The search box matches server names and tag names, so “prod” finds both sql-prod-01 and everything tagged Production. Tags render as colored pills on each card, and a Group-by-tag toggle rearranges the wall into a collapsible tag tree, nested tags included, which is how a 200-server fleet stays navigable. Tags are created and assigned in the desktop viewer or Lite; the web shows them everywhere they matter. A sort control orders the wall by severity or by resource use.
Click a card to drill into that server: overview stat cards, wait stats, CPU and memory trends, blocking, queries, configuration, and collection health, across twelve sections. See the blocking and deadlocks docs for the deep end of that drill-down.
Two Surfaces, Same Wall
The web dashboard’s Fleet Overview refreshes every 60 seconds and pauses while the tab is hidden. The desktop viewer has the same idea as its Overview tab: a card per registered server on a 30-second refresh, and double-clicking a card opens that server’s full tab set. The frontend ships fully self-contained, no CDN, no fonts, no remote anything, so it works on an air-gapped host.
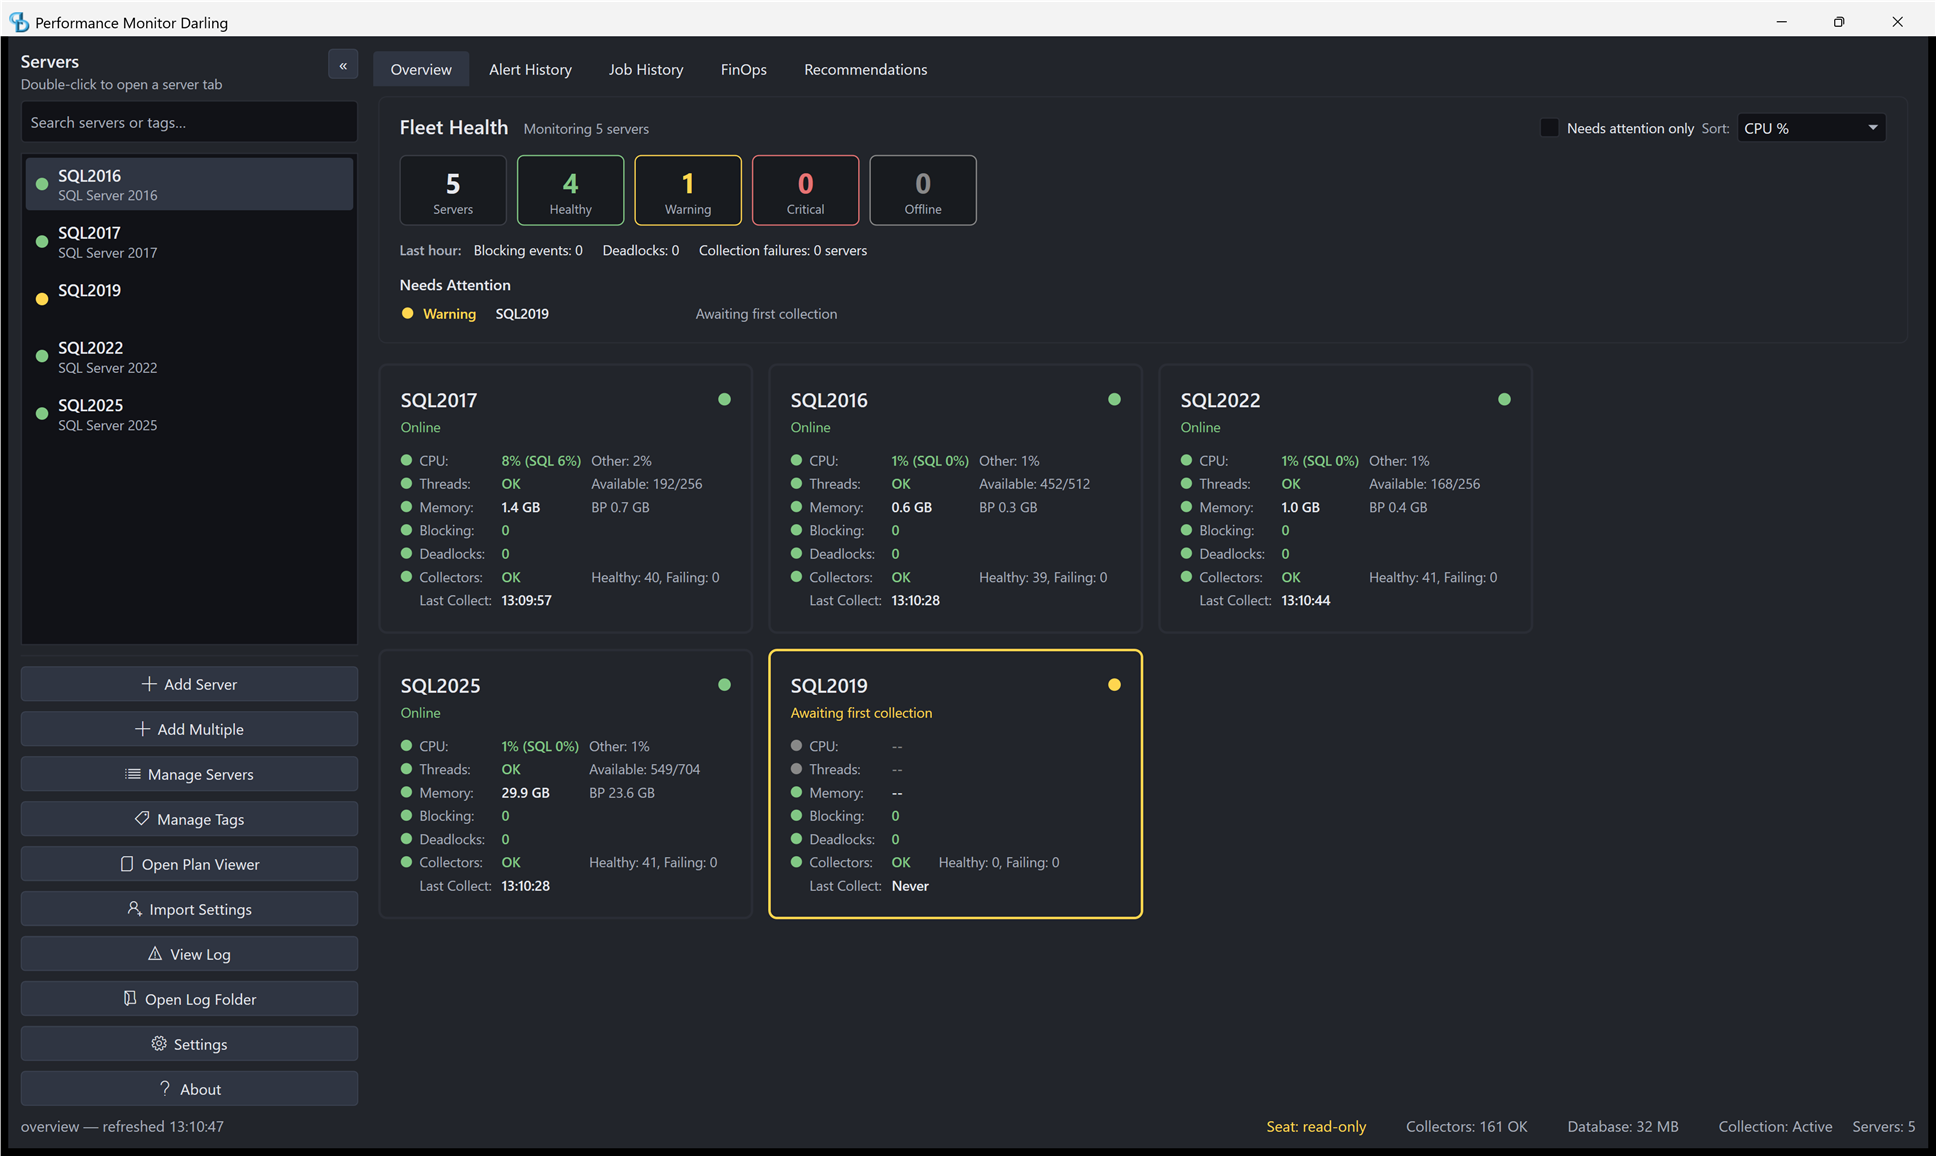
The desktop viewer’s fleet view: same store, same cards, plus the full per-server tab set.
Turning It On
The fleet wall is the web dashboard’s home page. The web endpoint is off by default; enable it in darling.json or with --enable-web, and expose it to your LAN with a token and a CIDR allowlist if the team should see it. The browser surface is read-only by design: no settings, no live-server queries, nothing an open tab can break.
PerformanceMonitor on GitHub has the operator guide. The monitoring overview page covers everything else it does.