Availability Groups fail in ways that look healthy from a distance: a secondary quietly suspended, a redo queue growing while every dashboard stays green, a failover nobody announced. The AG support here was built by measuring those states on live clusters, and in a couple of places the measurements disagree with the documentation, so the alerts trust the measurements.
What Gets Collected
Two collectors track replica states and per-database replica states: roles, connection state, synchronization health, send and redo queue sizes, and the suspend flag with its reason. The viewer’s Availability Groups tab and the web dashboard’s Availability Groups page (it appears in the nav as soon as AG data exists) lay out the topology with the queue and sync detail, as reported by every monitored replica separately, and the MCP surface serves the same read to an AI assistant as get_ag_health.
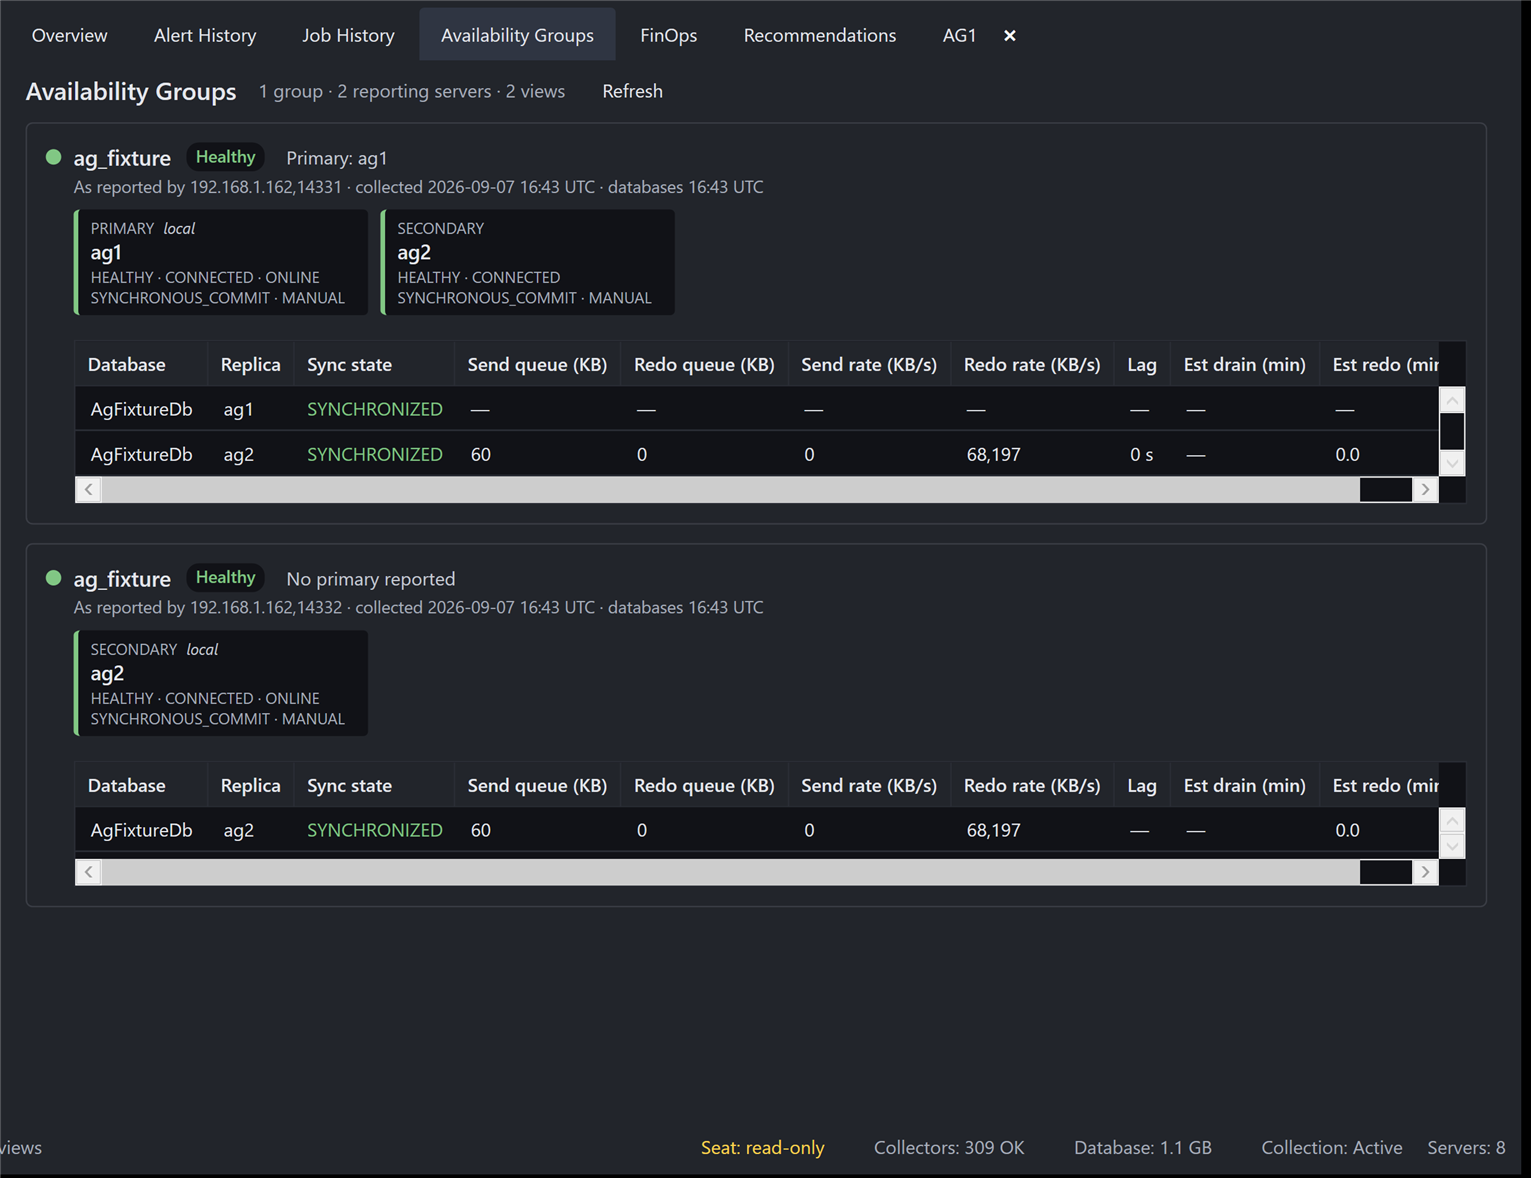
A healthy two-replica AG in the viewer: replica cards, per-database sync state, queues and rates, and each replica’s own view of the group. The secondary honestly reports “No primary reported” because that’s what its local DMVs say.
One grant trap worth knowing before your dashboards mysteriously show nothing: the AG catalog views require VIEW ANY DEFINITION on top of the usual VIEW SERVER STATE, and they enforce it by hiding rows rather than raising errors. A login missing that grant sees a cluster with no availability groups and no error anywhere. The permissions docs spell it out.
The Alert Family
Four conditions ride the per-server alert sweep: AG Failover (a replica’s role changed since the last sweep), AG Replica Disconnected (Critical, with a Reconnected notice on recovery), AG Sync Fell Behind (a secondary past your lag threshold, 300 seconds by default), and AG Database Suspended (with the suspend reason, and a notice when data movement resumes). State is tracked per AG grain, replica and database, so two lagging databases on one host fire and recover independently, and mute rules and history still correlate per server.
The Part Where the Docs Were Wrong
Microsoft’s documentation says secondary_lag_seconds reads zero while data movement is suspended. Measured on a live AG under write load, it does the opposite: lag accrues at wall-clock rate throughout the suspension. Measured on an idle group, it can also sit at zero for an entire outage while the last hardened log quietly ages. Both behaviors are real, so the alert logic carries an asymmetry instead of a bet: a suspended row may raise an alarm, but may never clear one. Whatever the counters read during suspension, they cannot resolve a standing alert, and only a secondary actually measured as caught up can. The same rule guards the redo-queue trigger, whose value freezes while suspended.
The redo-queue threshold ships off by default, deliberately: a healthy redo queue size is workload-specific, and a shipped guess would page half a fleet on day one. Set it when you know your number. The lag figure is also documented for what it is, staleness of the last hardened log rather than a volume of queued data, because on a quiet group a big number can just mean nothing has been written lately.
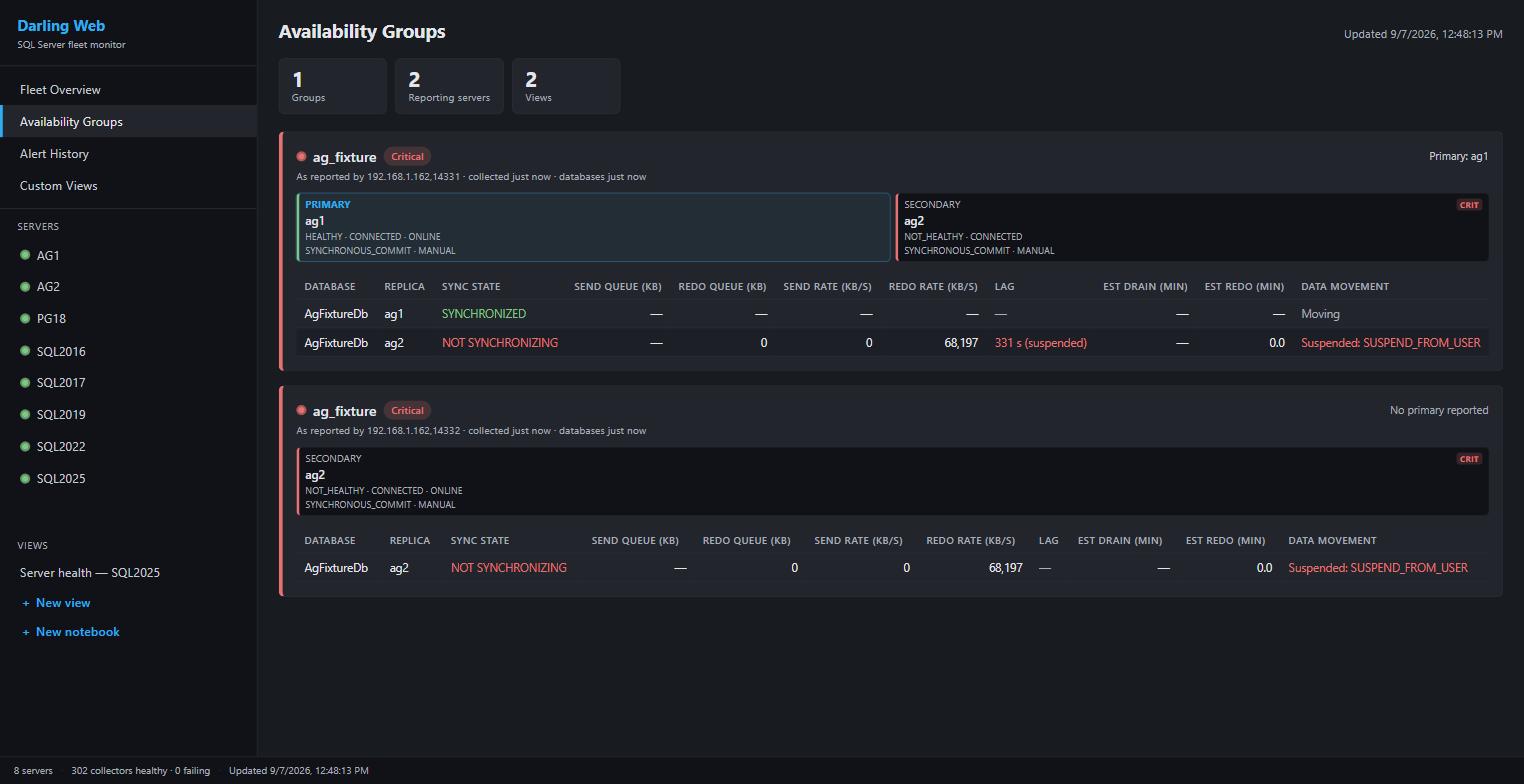
The same AG with data movement suspended on the secondary while the primary takes writes: the group goes Critical, sync state reads NOT SYNCHRONIZING with the suspend reason, and the lag is annotated as suspended instead of pretending to be a measurement.
Edition Notes
Connections support ReadOnlyIntent and MultiSubnetFailover for routing at monitoring time. Every replica is visible from every node, so a fully monitored 3-node AG reports a role change once per monitored server. Lite collects both AG grains but does not evaluate AG alerts; the alert family is the Darling service’s. Delivery and muting work like every other alert; see the alerts docs.
PerformanceMonitor on GitHub · monitoring overview