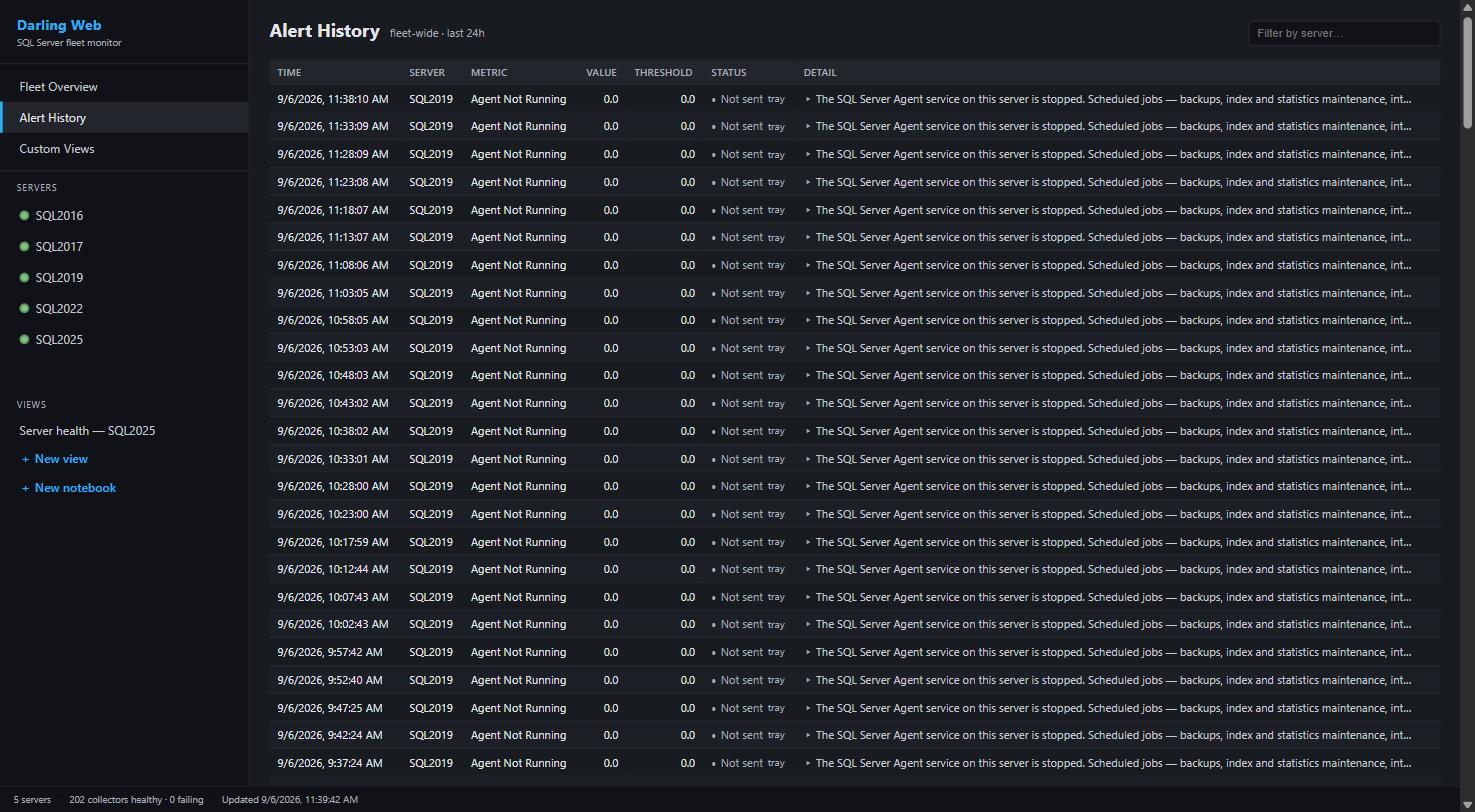
The alert engine watches continuously and tells you when something crosses a line you set. The design goals are boring on purpose: alerts carry their evidence with them, standing problems keep firing until someone fixes them, noise gets muted without being erased, and everything clears itself when the condition resolves.
What Can Fire
On SQL Server targets: high CPU (total or SQL-process-only, your choice), blocking by count and, separately, blocking by total wait time, deadlocks, poison waits (THREADPOOL, RESOURCE_SEMAPHORE, RESOURCE_SEMAPHORE_QUERY_COMPILE, judged on average milliseconds per wait), long-running queries with five noise filters on by default, TempDB space, low disk with independent percent and GB floors, SQL Agent jobs running long against their own history (3x average by default), recently failed jobs, the Agent service itself not running, a server going unreachable and coming back, and version store pressure on ADR databases. Availability Groups get their own family, covered in the AG docs. Scheduled-analysis findings above a severity bar deliver through the same pipe.
The blocking pair deserves a sentence, because it encodes a lesson: a count threshold can’t tell one session blocked for an hour from thirty blocked for a second, so there are two gates. The wait-time gate is level-triggered: it re-fires every cooldown while total blocked seconds stay over the line, and clears when they drop.
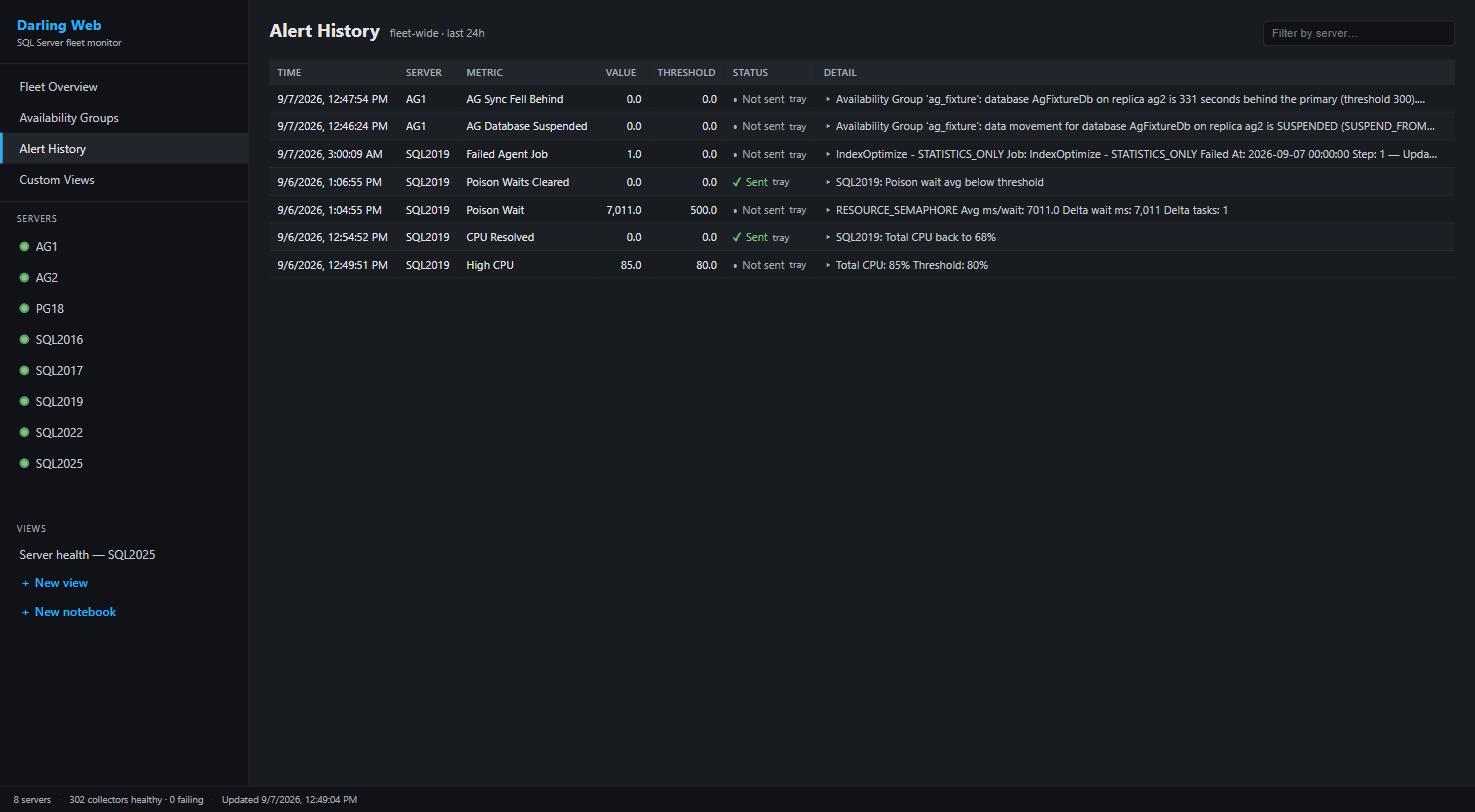
The fleet-wide Alert History over one real weekend: an AG suspension and the lag alert that followed it, a failed Agent job, poison waits with their Cleared notice, and high CPU resolving itself. Conditions that clear announce it; conditions that stand keep firing until someone fixes them.
How It Reaches You
Email is styled HTML with the query text, blocking chains, and deadlock graph XML attached, so the page you get at 2 AM contains the evidence. Webhooks POST to Slack, Teams, PagerDuty, or any endpoint that takes JSON. Lite adds system tray notifications. When a condition resolves, a Cleared notice follows the alert that opened it. Two cooldowns keep the volume sane: a per-condition one and a per-channel one, both configurable.
Mute Rules, Not Amnesia
Recurring noise gets mute rules, not deletion. A rule matches on server, metric, database, query text, wait type, or job name, with AND logic across fields and optional expiration (an hour, a day, a week, or permanent). Muted alerts still log and show grayed out, so the audit trail survives your triage decisions. Right-click any alert for Mute This Alert (server plus metric pre-filled) or Mute Similar (metric only, fleet-wide), and every alert’s detail view carries its context: values, thresholds, and drill-down data keyed to what fired.
Configuration
In Darling, thresholds live in the alerts block of darling.json and mirror Lite’s defaults exactly, so an empty block behaves like a fresh Lite install; after first start they’re store-managed and editable from the viewer’s Settings window, with changes hot-reloading into the running service. Excluded databases skip blocking, deadlock, and long-query evaluation without affecting collection. The operator guide has the full key table.
PerformanceMonitor on GitHub · monitoring overview