Most monitoring tools tell you blocking happened. This one shows you the blocked query and the blocking query side by side, with session IDs and databases, and parses every deadlock graph into rows you can read without opening an XML editor. The goal is that you never spelunk through Extended Events by hand to answer “who blocked whom.”
How the Data Gets Collected
Two sources, merged. Blocked process reports come from the Extended Events session the monitor manages, and an always-on DMV blocking snapshot runs alongside as a fallback, so you still see blocking on platforms or moments where the XE report isn’t available. Every row is badged with which source it came from. Deadlock graphs are captured whole, victim and survivors and resources.
The blocked process threshold is auto-configured to 5 seconds where the platform allows it. On AWS RDS that setting lives in a Parameter Group, and on Azure SQL Database it’s fixed at 20 seconds; the README’s platform notes cover both.
What You Get to Look At
The viewer’s Blocking tab has four sub-tabs. Trends charts lock-wait rate, blocking incidents, and deadlocks over time, so you can see whether tonight is unusual. Current Waits shows waiting-task duration by wait type and blocked sessions by database. Blocked Process Reports is the full grid, roughly 25 columns, filterable, with a time-range slicer, per-row report-XML save, and long-block highlighting. Deadlocks gives you one row per process parsed out of each deadlock graph, with the victim marked.
Two right-clicks are the point of the whole tab. View Block Chain reconstructs and draws the blocking chain a row belongs to, so a 14-session pileup becomes a picture with a root. View Deadlock Graph draws the deadlock, participants and resources and all.
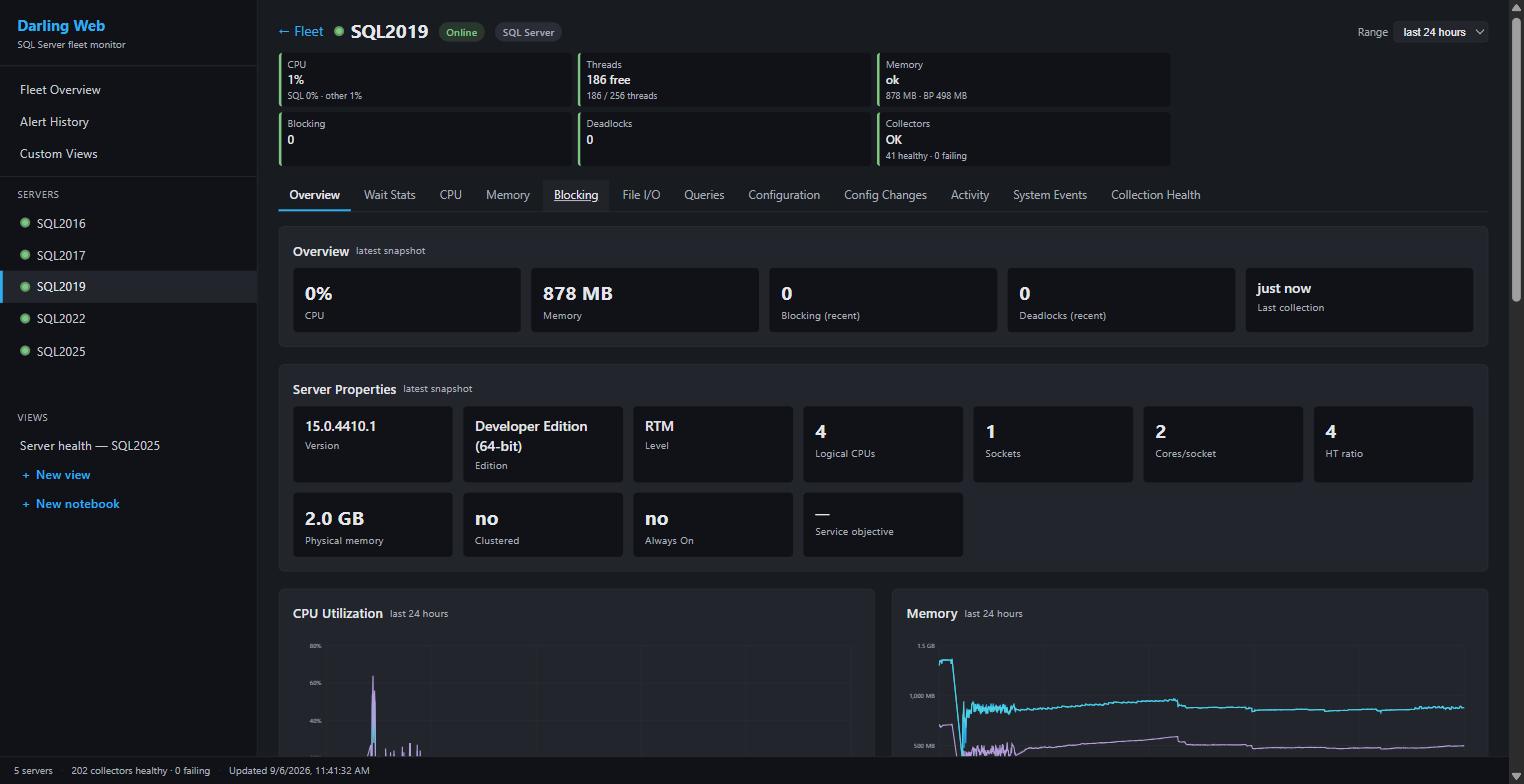
The web dashboard’s per-server drill-down. Blocking is one of twelve sections, next to waits, queries, memory, and configuration.
The Alerts That Go With It
Blocking alerts have two independent gates, because a count can’t tell one session blocked for an hour from thirty blocked for a second. The count gate fires when the number of blocked sessions crosses your threshold. The wait-time gate sums total blocked seconds across the latest snapshot, re-fires every cooldown while the condition persists, and clears when it drops. Deadlocks alert on occurrence. Alert emails carry the query text, the chain, and the graph XML as attachments, so the 2 AM page contains the evidence, not a link to go find it. See the alerts docs for delivery and mute rules.
Limits, Stated Plainly
Blocked process report rows and deadlock rows carry a sql_handle, not plan XML, so the viewer doesn’t offer a plan jump from those grids; resolving a handle to a plan needs a live connection the Darling viewer deliberately never makes. Query and Query Store grids do jump straight into the plan viewer.
PerformanceMonitor on GitHub · monitoring overview