Darling is the headless version of Performance Monitor. It is one Windows service that collects from your SQL Servers into its own bundled PostgreSQL and TimescaleDB store, and serves three ways to look at the data: a web dashboard, a desktop viewer, and an MCP endpoint you can point an AI client at. Nothing gets installed on the servers you monitor. One install watches 5 servers or 500.
This is the full install, start to finish, on a plain Windows Server 2022 VM. Including the part where one of my servers was dead when I installed, because one of yours will be too.
What you need
- A Windows box for the service. Mine is a small VM named DARLING01. It does not need to be big: the service and its store are light until you point hundreds of servers at it.
- The ASP.NET Core Runtime 10 on that box. The installer checks and refuses politely if it is missing. The .NET Desktop Runtime 10 gets you the bundled desktop viewer on the same box, but it is optional.
- A SQL login (or Windows account) with VIEW SERVER STATE and msdb access on each server you want to monitor.
Check the runtimes first:
dotnet --list-runtimesMicrosoft.AspNetCore.App 10.0.9 [C:\Program Files\dotnet\shared\Microsoft.AspNetCore.App]
Microsoft.NETCore.App 10.0.9 [C:\Program Files\dotnet\shared\Microsoft.NETCore.App]
Microsoft.WindowsDesktop.App 10.0.9 [C:\Program Files\dotnet\shared\Microsoft.WindowsDesktop.App]Download and verify
Grab the Darling zip from the latest release, plus SHA256SUMS.txt from the same page. Then make sure the bits are the bits:
Get-FileHash C:\PerformanceMonitorDarling-3.6.0.zip -Algorithm SHA256expected: 33a9f194e335d34f5d1e58be03f15aa6ef530ebf401297ff974bb78ccb974161
actual: 33a9f194e335d34f5d1e58be03f15aa6ef530ebf401297ff974bb78ccb974161
match: TrueExtract somewhere the service can live
Extract to a machine path like C:\PerformanceMonitorDarling. Not your Downloads folder, not anywhere under C:\Users. The service runs as an unprivileged virtual account that cannot read your profile, and the installer will refuse a profile path rather than let you install something that dies on first start.
Expand-Archive C:\PerformanceMonitorDarling-3.6.0.zip -DestinationPath C:\PerformanceMonitorDarlingConfigure darling.json
Copy darling.sample.json to darling.json in the same folder. The sample is heavily commented and worth reading once, but here is a working config: five servers, the store, the web dashboard, and MCP, all reachable from my LAN. Comments are allowed in the file, so you can keep notes in it.
{
  // The service runs its own bundled PostgreSQL + TimescaleDB on an
  // uncommon port so it coexists with anything already on the box.
  // The network block exposes the store to the LAN over TLS so the
  // desktop viewer can connect from your workstation, read only.
  "postgres": {
    "managed": true,
    "port": 5641,
    "connectAs": "admin",
    "network": {
      "listen": "192.168.1.205",
      "allowFrom": "192.168.1.0/24",
      "role": "viewer"
    }
  },

  // The servers to monitor. Encrypted passwords come from
  // --encrypt-password, run on this machine (the blob is DPAPI
  // machine-bound, so it only decrypts here).
  "servers": [
    {
      "name": "SQL2016",
      "host": "SQL2016",
      "auth": "sql",
      "username": "sa",
      "encryptedPassword": "AQAAANCMnd8BFdERjHoAwE...",
      "trustServerCertificate": true,
      "encryptMode": "Optional"
    }
    // ...and four more just like it
  ],

  // MCP endpoint: point Claude or another MCP client at
  // http://192.168.1.205:5152 with the bearer token.
  "mcp": {
    "enabled": true,
    "port": 5152,
    "network": {
      "listen": "192.168.1.205",
      "allowFrom": "192.168.1.0/24",
      "encryptedToken": "AQAAANCMnd8BFdERjHoAwE..."
    }
  },

  // Web dashboard: browse to http://192.168.1.205:5153/?token=...
  // from anywhere in the allowed range.
  "web": {
    "enabled": true,
    "port": 5153,
    "network": {
      "listen": "192.168.1.205",
      "allowFrom": "192.168.1.0/24",
      "encryptedToken": "AQAAANCMnd8BFdERjHoAwE..."
    }
  }
}
A few things worth saying about this file.
- Everything network-facing is off by default. If you leave the network blocks out, the store, MCP, and the dashboard bind loopback only and nothing is exposed. You opt in per endpoint, with a bind address, a CIDR, and a token.
- The tokens and passwords in the file are encrypted blobs, not plaintext. You make them on the service box:
Read-Host -Prompt 'password' | .\PerformanceMonitor.Darling.Service.exe --encrypt-passwordPaste the output line into the config. Same verb for the SQL password, the web token, and the MCP token. The blobs are machine-bound DPAPI, so a copied darling.json is useless on another box.
- Integrated auth works too (“auth”: “integrated”), and is the right answer on a domain. My lab VMs are workgroup machines, so SQL auth it is.
- trustServerCertificate true is for lab boxes with self-signed certs. Production servers with real certificates should leave it false.
Preflight: probe every server first
Before installing anything, the exe can validate the config and connect to every server in it:
.\PerformanceMonitor.Darling.Service.exe --test-connectionValidating connectivity to 5 server(s)...
[PASS] SQL2016: SQL major version 13, Enterprise, msdb access: yes
[PASS] SQL2017: SQL major version 14, Enterprise, msdb access: yes
[FAIL] SQL2019: A network-related or instance-specific error occurred while establishing
a connection to SQL Server. The server was not found or was not accessible.
[PASS] SQL2022: SQL major version 16, Enterprise, msdb access: yes
[PASS] SQL2025: SQL major version 17, Enterprise, msdb access: yes
One or more servers failed the connection pre-flight (see above).SQL2019 is dead. I knew that, and I left it in the config on purpose, because this is what real fleets look like: something is always down, and I want the monitor to tell me about it rather than pretend it is not there. It exits non-zero so you can use it as a deployment gate, and each PASS line tells you the version, edition, and whether msdb access works before you commit to anything.
Install
From an elevated PowerShell in the extract folder:
.\install-darling.ps1The installer runs the same preflight and stops to ask about SQL2019. I told it to carry on. Then it does the real work. The output is worth reading because it explains itself:
Created service 'PerformanceMonitor Darling' (NT SERVICE virtual account, automatic start).
Restricted 1 credential file(s) to SYSTEM, Administrators, and the service account
(they hold encrypted passwords and access tokens).
Reconciling the scoped Windows Firewall rules to match darling.json.
store: opened 'PerformanceMonitor Darling store (port 5641)' (TCP 5641, inbound, from 192.168.1.0/24).
MCP: opened 'PerformanceMonitor Darling MCP (port 5152)' (TCP 5152, inbound, from 192.168.1.0/24).
web dashboard: opened 'PerformanceMonitor Darling Web (port 5153)' (TCP 5153, inbound, from 192.168.1.0/24).

Done. 3 endpoint(s) exposed on the LAN; their scoped rules are in place.
Service is Running. First start does real work (unpack pg-runtime, initdb, store migration,
first collection cycle) - give it ~2 minutes.
Created 'Darling Viewer' shortcuts (2).
Points worth noticing. The service runs under a virtual account, never LocalSystem: the bundled PostgreSQL refuses to run with administrative privileges, which is the correct paranoia. The firewall rules are scoped to the CIDR from your config, not opened to the world. And the ACLs on darling.json get re-applied on every service start, so a loosened permission repairs itself.
First start
The first start unpacks the PostgreSQL runtime, initializes the cluster, runs every store migration, and starts collecting. About two minutes on my VM. The log at %ProgramData%\PerformanceMonitorDarling\logs tells you when it is done:
Postgres store ready (schema v104, 103 migration(s) applied)
TimescaleDB: 17/17 retention policies in place, 17 armed (raw 4 days, hourly history
CAGGs 90 days, baseline CAGGs 35 days)
PerformanceMonitor Darling collection loop started
That is a complete time-series store with retention tiers already armed. Nobody has to learn PostgreSQL administration to run this.
Open the dashboard
From my workstation, not from the server:
http://192.168.1.205:5153/?token=your-token-hereYou present the token once. It gets exchanged for a signed session cookie and stripped from the URL, so it does not sit in your address bar or your history.
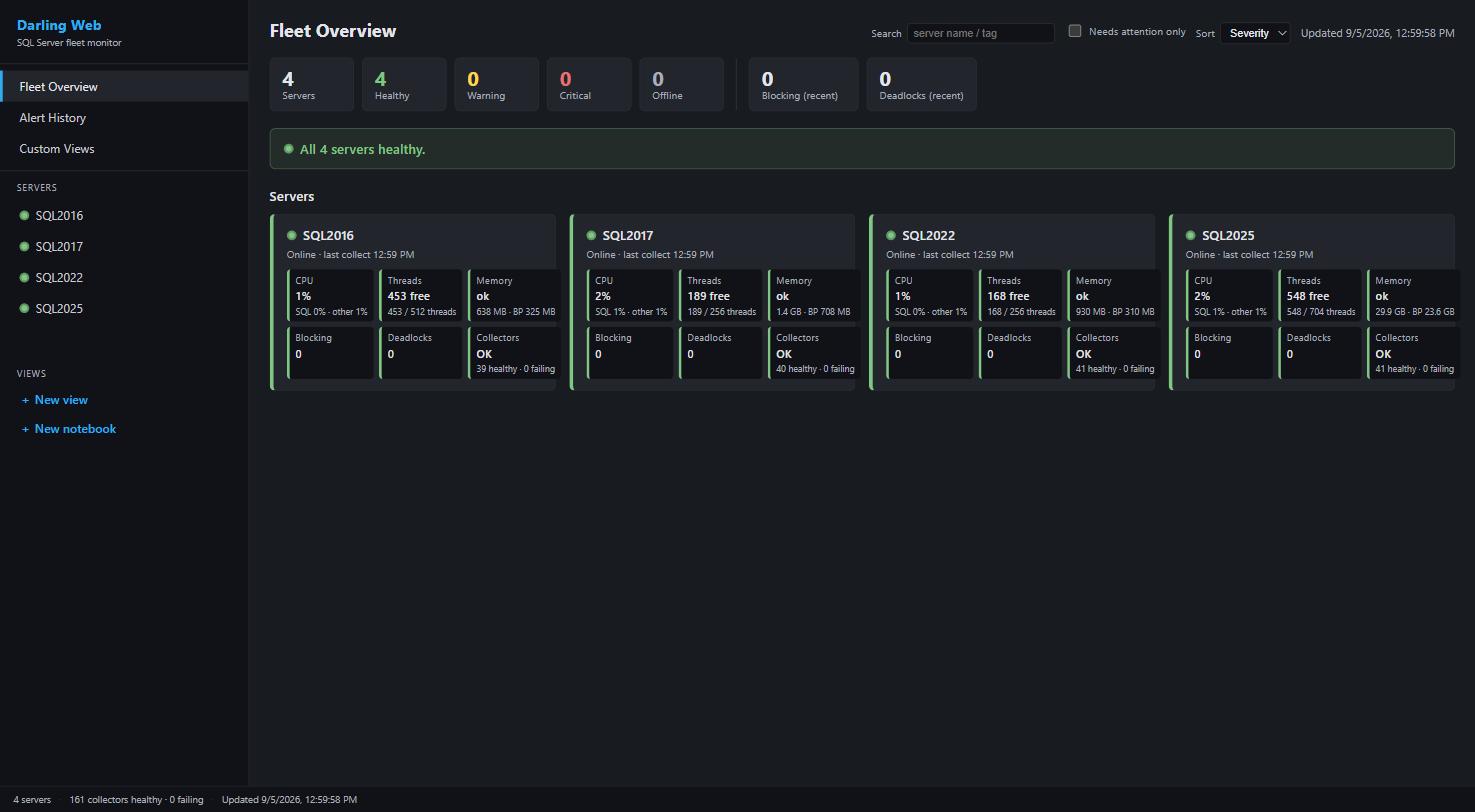
Servers join the wall as their first collection cycle lands, which took a couple of minutes each here. Click one and you get the full drill-down: wait stats, blocking, queries, file I/O, configuration changes, collection health, all of it already accumulating.

One honest warning from the service log that you should take seriously: without TLS, the token and its cookie cross your network in the clear. The dashboard takes a certificate from your internal CA in the config (a pfx or a PEM pair), or you put a TLS reverse proxy in front of it. On my lab LAN I have not bothered. On yours, bother. Either way, none of this belongs on the internet.
Connect the desktop viewer
The zip ships the viewer beside the service, and the installer put shortcuts on the desktop. For your workstation, install the viewer from the same releases page (PerformanceMonitorDarlingViewer-darlingviewer-Setup.exe, or the Portable zip if you do not want an installer), then have the service box write you a ready-to-copy config folder:
.\PerformanceMonitor.Darling.Service.exe --export-viewer-configThat writes a folder with a filled-in darling.json, the store’s TLS certificate, and a README. Copy it to your workstation and the viewer connects to the store over TLS as a read-only role. The store connection verifies the certificate (VerifyFull), which is why the export includes it.
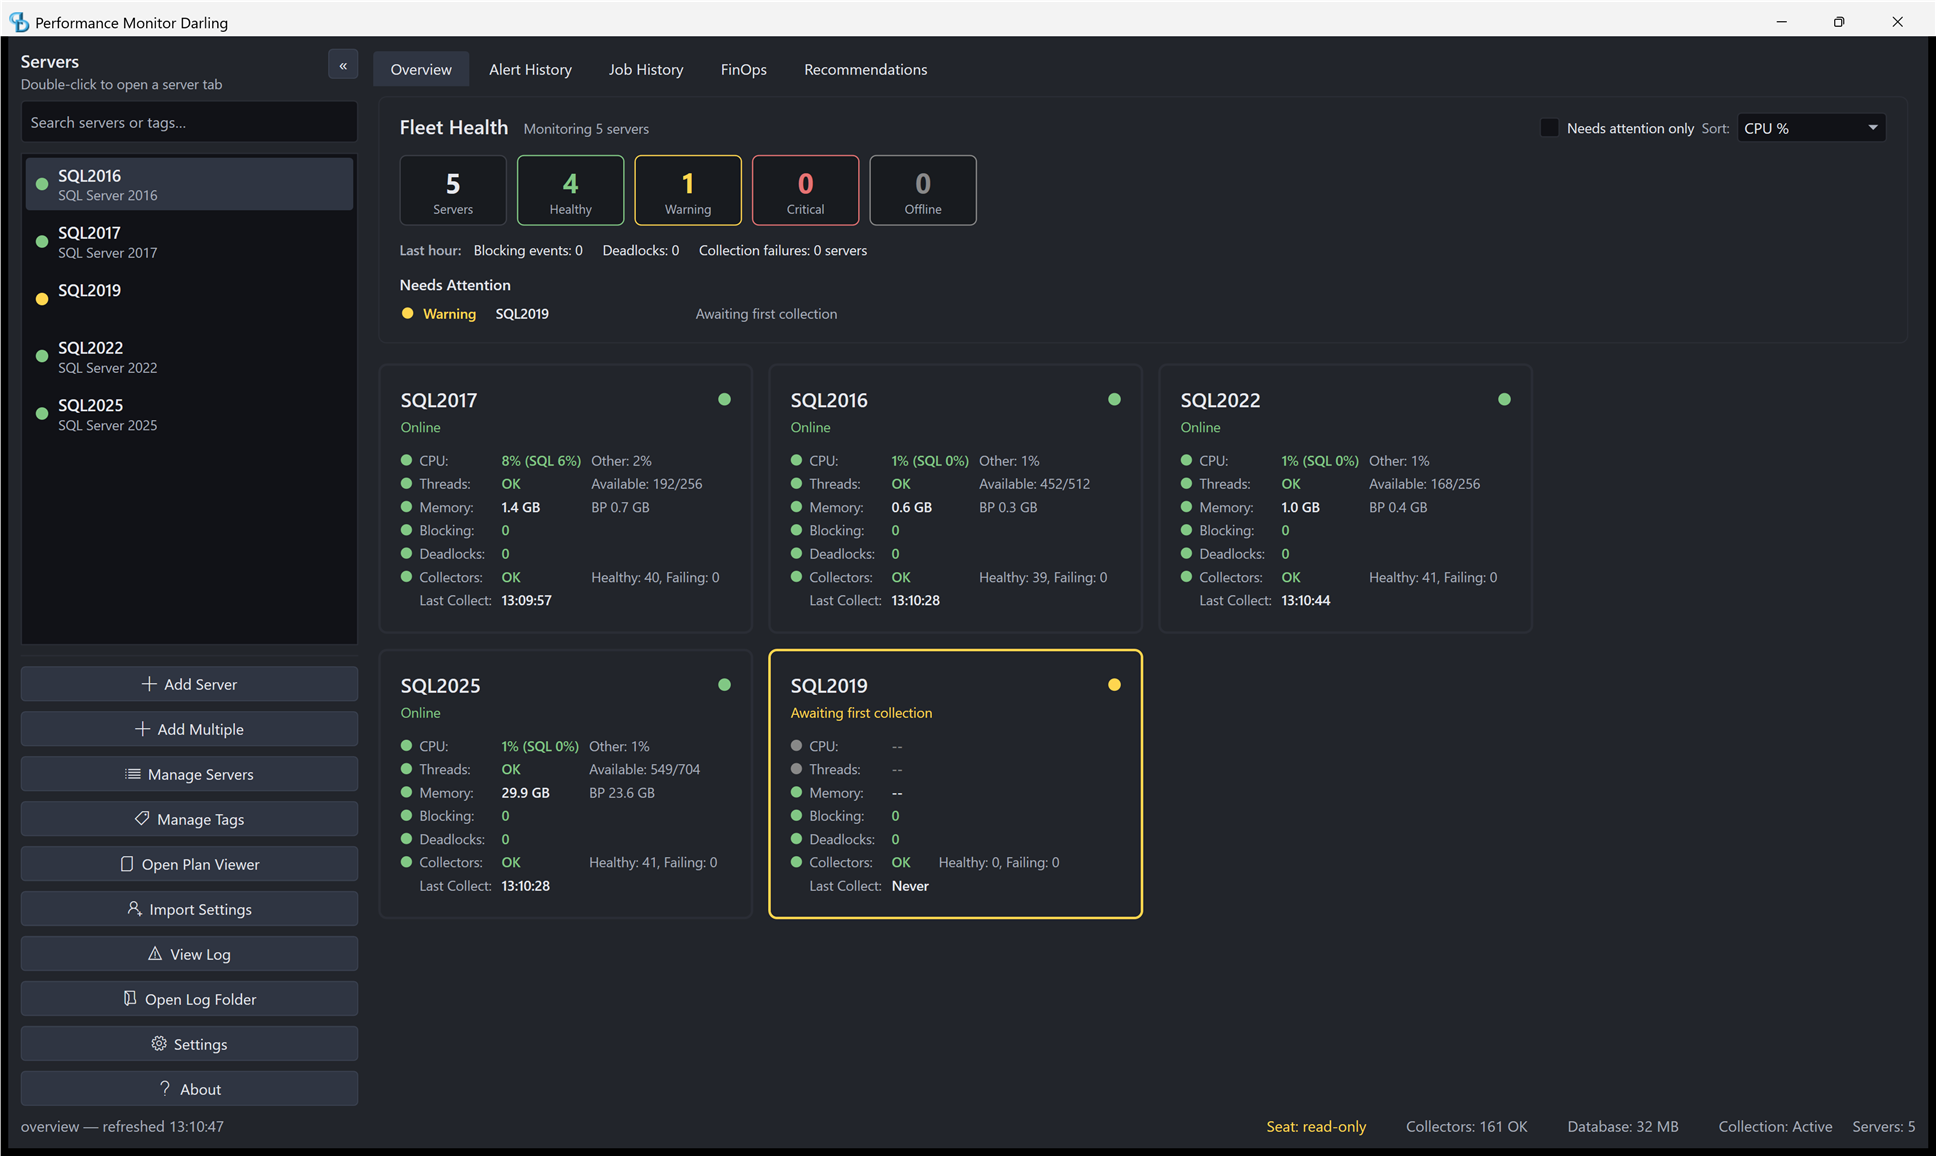
Same store the web dashboard reads, same read-only role, full desktop app. One difference worth knowing: the viewer lists every server in the config, so SQL2019 shows up here as Awaiting first collection instead of being absent. The web wall shows you who has reported. The viewer also shows you who should have.
Point an AI at it
The MCP endpoint speaks Streamable HTTP and carries the same tool surface the apps use: wait stats, blocking, deadlocks, query stats, plans, configuration, the analysis engine, all served from the collected store. Wire it into Claude Code like this, with the MCP token you minted earlier:
claude mcp add --transport http darling http://192.168.1.205:5152 --header "Authorization: Bearer your-token-here"Then ask it why the server was slow at 9am and watch it pull wait stats and blocking instead of guessing. The token gates the whole surface, and analyze_server opens live connections to your monitored servers, so treat the MCP endpoint as trusted-LAN only.
When something is down
SQL2019 was dead through this whole install, and I think the way that plays out is instructive. The preflight caught it before the monitor even existed, which is the right place to catch it. The fleet wall registers servers on first contact, so a box that has never answered does not get a card yet; the preflight output is your record of it. Once a server has reported even once, losing it flips the card to Offline in the needs-attention band and the alert engine delivers a server-unreachable alert. When someone finally starts SQL2019 back up, it registers itself on the next cycle and joins the wall with no work from me. Dead servers are a feature of production life; a monitor that only demos well against healthy fleets is a toy.
Uninstall
Also in the zip:
.\uninstall-darling.ps1That removes the service, the firewall rules, and the shortcuts, and deliberately leaves the store and config in place, so an uninstall is reversible by re-running the installer. If you want the collected history gone too, -PurgeData deletes it after a confirmation.
The whole thing
Download, verify, extract, edit one config file, run one script. On my VM that was about five minutes of typing and two minutes of the service doing its first-start work, and at the end of it I had a time-series store with retention policies, a web dashboard, a desktop viewer, and an MCP endpoint watching four healthy servers and correctly complaining about a fifth. Everything opt-in, everything scoped, nothing installed on the monitored servers.
Performance Monitor is free and open source. Releases are on GitHub.