Make ADS An Optional Install Alongside SSMS

Update Update!


Starting with SSMS 20, ADS is no longer bundled together with it.

From: Upcoming changes for SQL Server Management Studio (SSMS) – Part 3:

For SSMS 20 we have removed Azure Data Studio from the installation.  In addition to being a highly voted item (Make ADS An Optional Install Alongside SSMS · Community (azure.com)), this aligns with the future extension work for SSMS 21 and we decided to make the change in the current release.

I’m quite happy to be aligned with future extension work for SSMS 21 🥰

Update!


Starting with SSMS 18.8 officially, but available in SSMS 18.7 as well, if you install via command line, you can use the following switch to avoid installing Azure Data Studio (ADS).

SSMS-Setup-ENU.exe /Passive DoNotInstallAzureDataStudio=1

Odd Couple


SSMS 18.7 was released, with an announcement that whenever you install SSMS from here on out, you’d also be installing Azure Data Studio, along with whatever dependencies exist in there. Right now, there’s a short list, but that might change so I’m not going to get into it.

It’s an odd choice, and a bit forced. Sort of like whenever you go to update Java and it wants to install three toolbars and something to clean out your internet cache. But at least Oracle has the decency to ask first.

I’ve opened a UserVoice item to let ADS be an optional install, rather than forced.

The thing is, they’re tools for totally different people. If you look at the feature comparison sheet for ADS and SSMS, you can see what I mean.

Don’t You Read The Slides?


Mr. O has a great slide about the different kinds of DBAs you might meet in the world. If you pair that up with the features that are available in each tool, you can see where each one pretty neatly fits into different roles and the way they’d work.

If you need to work cross-platform, deal with source code, big data clusters, or more developer-related tasks, ADS is for you.

Go get it! After all, it’s still a standalone download, too ???

If you’re working with query plans in depth, AGs, Query Store, or about a dozen other tasks that are more DBA-focused, you still have to use SSMS, and it doesn’t make much sense to switch back and forth unless you specifically need something only ADS does.

Likewise, it doesn’t make sense to switch between ADS and SSMS if you don’t use any of the SSMS-specific functionality.

There’s totally part of the crowd that might need both. I get that, too. But bundling them together is sort of like selling someone a six pack of beer, where three of them are non-alcoholic.

I’ve nothing against ADS. I think it fits well into very specific workflows, just not enough to force everyone who needs SSMS to also install it.

Make ADS An Optional Install Alongside SSMS


From the UserVoice issue:

Starting with SSMS 18.7, Azure Data Studio is being automatically installed alongside SSMS with no option to not install it. ADS is still available as a standalone install, though.

I’d like a way to make the install optional for people who don’t need any ADS functionality.

Particularly for admins putting SSMS on their SQL Server for whom additional unknown dependencies might not be tolerable to security teams, not having to remember to uninstall additional items every time they update SSMS would be helpful. Even with an automated deployment, it requires an installation and then multiple uninstaller runs.

On top of that, ADS is updated monthly, and SSMS has a less frequent release cadence. That leaves most people juggling two installers anyway, or only updating ADS when they update SSMS. That seems an odd choice, especially given the lack of reciprocal bundling.

Thanks for reading!

Going Further


If this is the kind of SQL Server stuff you love learning about, you’ll love my training. Blog readers get 25% off the Everything Bundle — over 100 hours of performance tuning content. Need hands-on help? I offer consulting engagements from targeted investigations to ongoing retainers. Want a quick sanity check before committing to a full engagement? Schedule a call — no commitment required.
A SQL Server Parameterization Puzzle With TOP: Part 2

Up From The Floor


Now that we’ve covered what happened with our query, how can we fix it?

Remember when I said that this only happens with literals? I sort of lied.

Sorry.

Pants On Fire


Probably the simplest thing to do would be to set MAXDOP to 1 for the query. Avoiding the parallel exchanges avoids the problem, but the query does run longer than the original with a literal TOP. That being said, it may be the simplest solution in some cases for you if it stabilizes performance.

If you’re feeling as brave as Sir Robin, you can add an OPTIMIZE FOR hint to bring back the early-buffer-send behavior.

CREATE OR ALTER PROCEDURE dbo.SniffedTop (@Top INT)
AS
BEGIN
SET NOCOUNT, XACT_ABORT ON;

    SELECT TOP (@Top)
            u.DisplayName,
            b.Name
    FROM dbo.Users u
    CROSS APPLY 
    (
        SELECT TOP (1) 
                b.Name
        FROM dbo.Badges AS b
        WHERE b.UserId = u.Id
        ORDER BY b.Date DESC
    ) AS b
    WHERE u.Reputation >= 10000
    ORDER BY u.Reputation DESC
    OPTION(OPTIMIZE FOR(@Top = 1));

END;
GO

Are they always better? I have no idea, but if you’ve got long-running queries with a parameterized TOP, this might be something worth experimenting with.

Another rewrite that works is slightly more complicated. Though for maximum benefit, Batch Mode is necessary.

CREATE OR ALTER PROCEDURE dbo.SniffedTop (@Top INT)
AS
BEGIN
SET NOCOUNT, XACT_ABORT ON;

    SELECT TOP (@Top)
            u.DisplayName,
            b.Name
    FROM dbo.Users u
    CROSS APPLY 
    (
        SELECT *
        FROM 
        (
            SELECT *,
            	ROW_NUMBER() 
            	    OVER( PARTITION BY b.UserId
            		      ORDER BY b.Date DESC ) AS n
            FROM dbo.Badges AS b
        ) AS b
        WHERE b.UserId = u.Id
        AND b.n = 1
    ) AS b
    WHERE u.Reputation >= 10000
    ORDER BY u.Reputation DESC;

END;
GO

So that’s fun. We’re having fun. I like fun.

I’m gonna make a PowerPoint about fun.

Other Things, And Drawbacks


So like, you could add a recompile hint to allow the TOP parameter to be sniffed, sure. But then you’re sort of undoing the good you did parameterizing in the first place.

You could also write unparameterized dynamic SQL, but see above. Same problem, plus a blown out plan cache if people ask for different values.

Optimize for unknown, and OFFSET/FETCH also don’t work.

Of course, one thing that would help here is a more appropriate index leading with UserId. However, most good demos arise from less than ideal indexing, so you’re just going to have to deal with it.

Thanks for reading!

Going Further


If this is the kind of SQL Server stuff you love learning about, you’ll love my training. Blog readers get 25% off the Everything Bundle — over 100 hours of performance tuning content. Need hands-on help? I offer consulting engagements from targeted investigations to ongoing retainers. Want a quick sanity check before committing to a full engagement? Schedule a call — no commitment required.
A SQL Server Parameterization Puzzle With TOP: Part 1

The Gift That Keeps On Giving


I love when a demo written for one purpose turns into an even better demo for another purpose.

While working with a client recently, they ran into a performance issue when trying to promote plan reuse by parameterizing the user-input number for TOP.

In part 1, I’m going to show you what happened and why, and in part 2 I’ll discuss some workarounds.

Regresso Chicken Face Soup


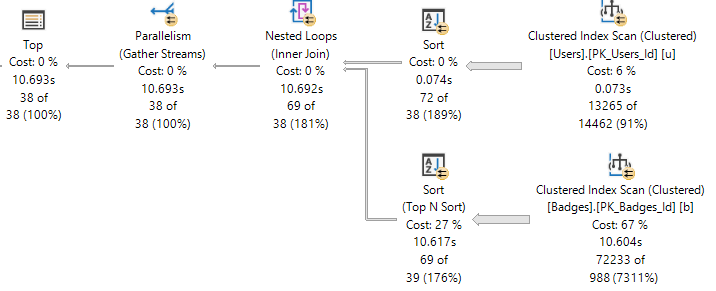
When executed with a literal value in the top, this query runs for around 10 seconds.

I’m not saying that’s great, but it’s a good enough starting place.

SELECT TOP (38)
        u.DisplayName,
        b.Name
FROM dbo.Users u
CROSS APPLY 
(
    SELECT TOP (1) 
            b.Name
    FROM dbo.Badges AS b
    WHERE b.UserId = u.Id
    ORDER BY b.Date DESC
) AS b
WHERE u.Reputation >= 10000
ORDER BY u.Reputation DESC;
SQL Server Query Plan
glamping

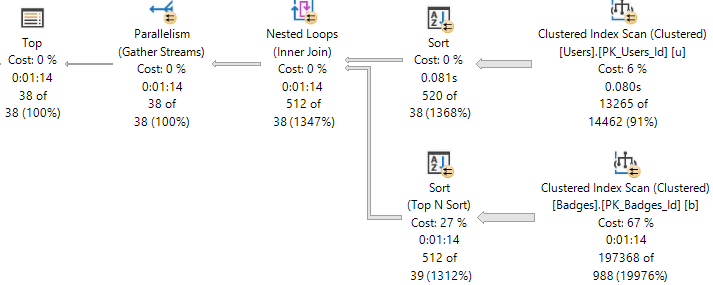
If we take that same query, put it in a procedure, and run it with an identical value in the TOP, things will turn out not-so-well.

CREATE OR ALTER PROCEDURE dbo.SniffedTop (@Top INT)
AS
BEGIN
SET NOCOUNT, XACT_ABORT ON;

    SELECT TOP (@Top)
            u.DisplayName,
            b.Name
    FROM dbo.Users u
    CROSS APPLY 
    (
        SELECT TOP (1) 
                b.Name
        FROM dbo.Badges AS b
        WHERE b.UserId = u.Id
        ORDER BY b.Date DESC
    ) AS b
    WHERE u.Reputation >= 10000
    ORDER BY u.Reputation DESC;

END
GO 

EXEC dbo.SniffedTop @Top = 38;

The query runs for a significantly longer amount of time.

SQL Server Query Plan
half-day

What Happened?


Unofficially, when TOP uses a constant and the constant is “small” (under 101), the exchange packets are allowed to send earlier than normal, as long as the exchange is below the TOP operator. They’re allowed to send as soon as they have a row, rather than waiting for them to fill up completely.

This can only happen with constants (or…!), and the behavior is true going back to 2005. It may change in the future, so if you’re reading this at some far off date, please don’t be too harsh on me in the comments.

When you parameterize TOP, it’s considered unsafe to send the exchange buffers early. After all, you could stick anything in there, up through the BIGINT max. In cases where you’ve got a BIG TOP, sending, say, 9,223,372,036,854,775,807 rows one at a time would be significantly ickier than sending over a smaller number of full exchange buffers.

If you’re surprised to hear that parallel exchange buffers can send at different times, you’re not alone. I was also surprised.

SQL Server: Full Of Surprises. Horrible surprises.

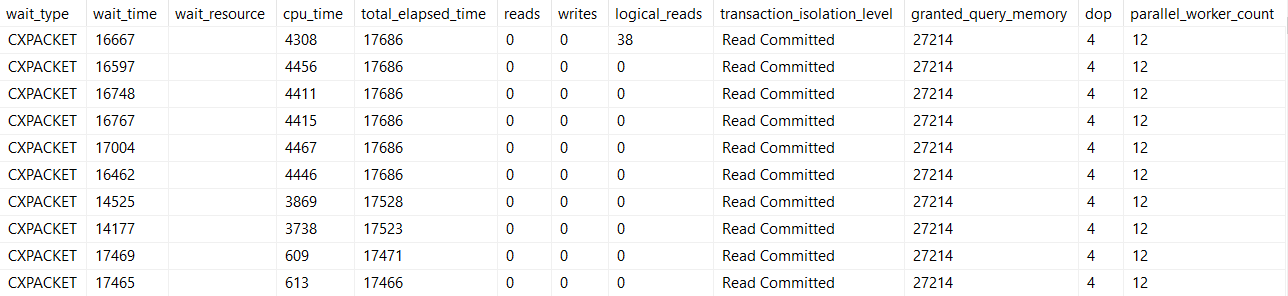
In the second query, where exchange buffers are sent when full, we spend a lot longer waiting for them to fill up. This isn’t exposed anywhere in the plan, and you’d need either a debugger or this blog post to figure it out.

Yep.

Yep. Yep. Yep. Yep. Yep. Yep.

Thanks for reading!

Going Further


If this is the kind of SQL Server stuff you love learning about, you’ll love my training. Blog readers get 25% off the Everything Bundle — over 100 hours of performance tuning content. Need hands-on help? I offer consulting engagements from targeted investigations to ongoing retainers. Want a quick sanity check before committing to a full engagement? Schedule a call — no commitment required.
A T-SQL Query To Get The Text Between Two Delimiters In SQL Server

I swear It’s Not String Splitting


I have to do this a fair amount, and I always go look at this little cheat sheet that I have.

Then it occurred to me that it might be worth sharing the details here, in case anyone else runs into the same need.

The way I learned to do it is with SUBSTRING and CHARINDEX, which is a pretty common method.

Why CHARINDEX? Because it accepts an optional 3rd parameter that PATINDEX doesn’t, where you can give it a starting position to search. That comes in really handy! Let’s look at how.

The first thing we need for our test case is the starting point, which I’ve arbitrarily chosen as a colon in error messages.

SELECT
    m.*,
    parsed_string = 
        SUBSTRING
        (
            m.text, /*First argument*/ 
            CHARINDEX(':', m.text), /*Second argument*/ 
            LEN(m.text)/*Third argument*/
        )
FROM sys.messages AS m
WHERE m.language_id = 1033
AND   m.text LIKE N'%:%:%';

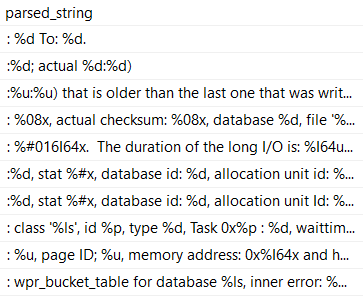
But the results aren’t exactly what we want! We can still see all the colons.

2020 10 08 15 36 04
colonics

What we really need is to cut out the semi-colon, which means we need to move one character over.

Keep in mind that this will change based on the length of the string you’re searching for. If you were looking for ‘Erik’, you’d need to move over four positions.

Sometimes it’s easier to remember that by calling LEN on the search string.

SELECT 
    m.*,
    SUBSTRING
    (
        m.text,
        CHARINDEX(':', m.text) + LEN(':'),
        LEN(m.text)
    ) AS parsed_string
FROM sys.messages AS m
WHERE m.language_id = 1033
AND   m.text LIKE N'%:%:%';

That’ll get us to where we need to be for the first position! Now we need to get the text up to the second colon, which is where things get a little more complicated.

Right now, we’re just getting everything through the end of the error message, using LEN as the 3rd argument to SUBTSTRING.

To start with, let’s establish how we can use the third argument in CHARINDEX.

SELECT 
    m.*,
    SUBSTRING
    (
        m.text, 
        CHARINDEX
        (
            ':', m.text
        ) + LEN(':'),
        CHARINDEX
        (
            ':', 
            m.text, /*!*/
            CHARINDEX
            (
                ':', 
                m.text
            ) + LEN(':')/*!*/
        )
    ) AS parsed_string
FROM sys.messages AS m
WHERE m.language_id = 1033
AND   m.text LIKE N'%:%:%';

The start of the third argument is going to look nearly identical to the first one, except we’re going to start our search in the string after the first colon.

The code in between the exclamation points is the same as the second argument to SUBSTRING.

That’s because it gives us the correct starting position to start looking for the second colon from.

But, you know, this still doesn’t get us what we need, exactly. We need to chop some characters off.

How many?

2020 10 08 15 47 10
1, 2, skip a few

I’ll save you some delicate CPU brain cycles: we need to subtract the length of the search string, and then subtract the number of positions in that the first search hit was.

SELECT 
    m.*,
    SUBSTRING
    (
        m.text, /*First argument*/
        CHARINDEX /*Begin Second argument*/
        (
            ':', 
            m.text
        ) + LEN(':'), /*End Second argument*/
        CHARINDEX /*Begin Third argument*/
        (
            ':', /*CHARINDEX of the first : after...*/
            m.text, 
            CHARINDEX /*The CHARINDEX of the first : in the string...*/
            (
                ':', 
                m.text
            ) + LEN(':')
        )
        - LEN(':') /*Minus 1, effectively*/
        - CHARINDEX(':', m.text) /*Minus the CHARINDEX of the first : in the string*/
        /*End Third argument*/
    ) AS parsed_string
FROM sys.messages AS m
WHERE m.language_id = 1033
AND   m.text LIKE N'%:%:%';

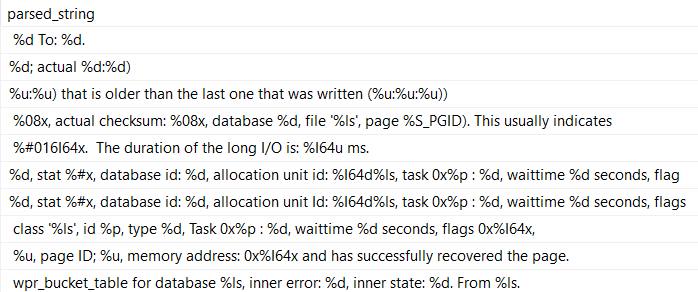
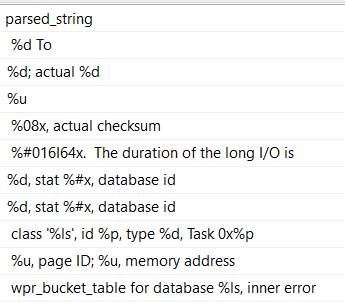
Which finally gives us what we’re asking for:

2020 10 08 15 49 15
all smiles

Now, this may not make you totally happy. After all, there are still leading and trailing spaces on each line.

If you want to get rid of those, you can either adjust your LEN functions, or you can call TRIM, LTRIM/RTRIM on the final result. I don’t care, really.

They’re your strings. They shouldn’t even be in the database.

Thanks for reading!

Going Further


If this is the kind of SQL Server stuff you love learning about, you’ll love my training. Blog readers get 25% off the Everything Bundle — over 100 hours of performance tuning content. Need hands-on help? I offer consulting engagements from targeted investigations to ongoing retainers. Want a quick sanity check before committing to a full engagement? Schedule a call — no commitment required.
Geek Talk #5 on Query Tuning by Erik Darling

Live Fish


I recently had the pleasure of appearing on Geek Talks! You can view the episode here:

And also on the SQL Server Geeks website.

Thanks for watching!

Going Further


If this is the kind of SQL Server stuff you love learning about, you’ll love my training. Blog readers get 25% off the Everything Bundle — over 100 hours of performance tuning content. Need hands-on help? I offer consulting engagements from targeted investigations to ongoing retainers. Want a quick sanity check before committing to a full engagement? Schedule a call — no commitment required.
Reasons Your Query Is Slow Right Now: Changes To SQL Server Settings

You And What Change Management Board?


I know, it sounds foolish. Trivial, even. Don’t let people make changes without permission.

But the number of times I’ve been reviewing server hardware and settings with people, and they’ve started head scratching about how something ended up the way it did is fairly astounding.

There’s almost no way to audit every since change, either.

Fun, right? SQL is fun. That’s why everyone acts like it’s terrible. We wanna keep the fun to ourselves.

Sticker Shock


There are a lot of things that can change under the covers.

One fairly sneaky thing is if someone makes sp_configure changes without running configure, that kick in after a reboot.

Unexpected failovers, patching cycles that require reboots, and all sorts of other bump-in-the-night incidents can lead to this.

On top of that, there are just so many settings that can cause erratic performance, it’d be disingenuous of me to list them all here, even though it’d probably be great for SEO.

Instead, have a scroll through this list. See what I mean?

You’re gonna have a hard time remembering to keep track of what all your settings are now, and if they’re different in the middle of a performance storm. I don’t usually tell people to run sp_Blitz when that’s going on, but it can be a good sanity check, too.

Not all performance problems are caused by the robots. Some are caused by the humans, too.

For a general check, I’ll run it like this:

sp_Blitz @CheckServerInfo = 1;

You might be able to get to the root cause of things pretty quickly.

Thanks for reading!

Going Further


If this is the kind of SQL Server stuff you love learning about, you’ll love my training. Blog readers get 25% off the Everything Bundle — over 100 hours of performance tuning content. Need hands-on help? I offer consulting engagements from targeted investigations to ongoing retainers. Want a quick sanity check before committing to a full engagement? Schedule a call — no commitment required.
Reasons Your Query Is Slow Right Now: A Bad Query Plan Appears

Update Stats, They Said


Okay look, you probably should update stats. At least when you do it, you have some control over the situation.

If you let SQL Server get up to its own devices, you might become quite surprised.

One after-effect of updated stats is, potentially, query plan invalidation. When that happens, SQL Server might get hard to work coming up with a new plan that makes sense based on these new statistics.

And that, dear friends, is where things can go bad.

New Contributor ?


Let’s say we have this query, which returns the average post and comment score for a single user.

CREATE OR ALTER PROCEDURE dbo.AveragePostScore(@UserId INT)
AS
BEGIN
SET NOCOUNT, XACT_ABORT ON;

SELECT u.DisplayName, 
       AVG(p.Score * 1.) AS lmao_p,
       AVG(c.Score * 1.) AS lmao_c
FROM   dbo.Users AS u
JOIN   dbo.Posts AS p
    ON p.OwnerUserId = u.Id
JOIN   dbo.Comments AS c
    ON c.UserId = u.Id
WHERE u.Id = @UserId
GROUP BY u.DisplayName;

END;
GO

Most of the time, the query runs fast enough for the occasional run to not end too poorly.

But then a recompile happens, and a new contributor decides to look at their profile.

Okay To Worse


What comes next you could fill a textbook with.

EXEC dbo.AveragePostScore @UserId = 3150367;

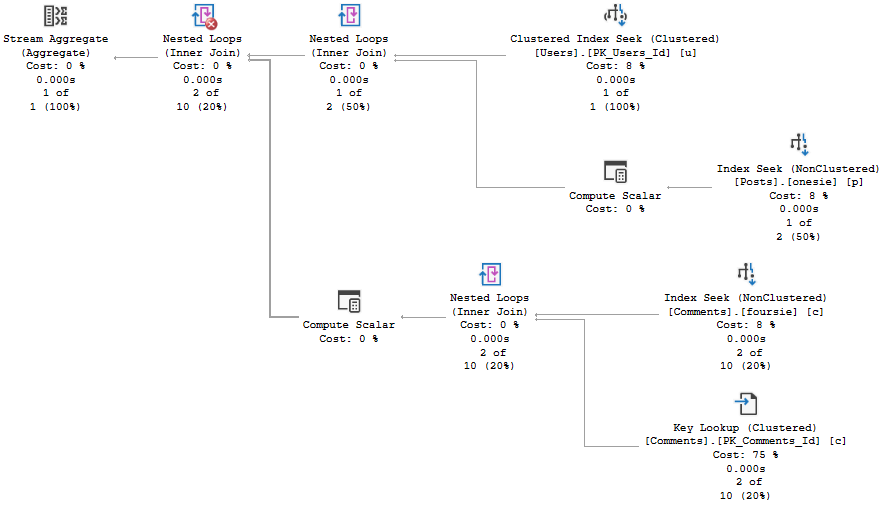
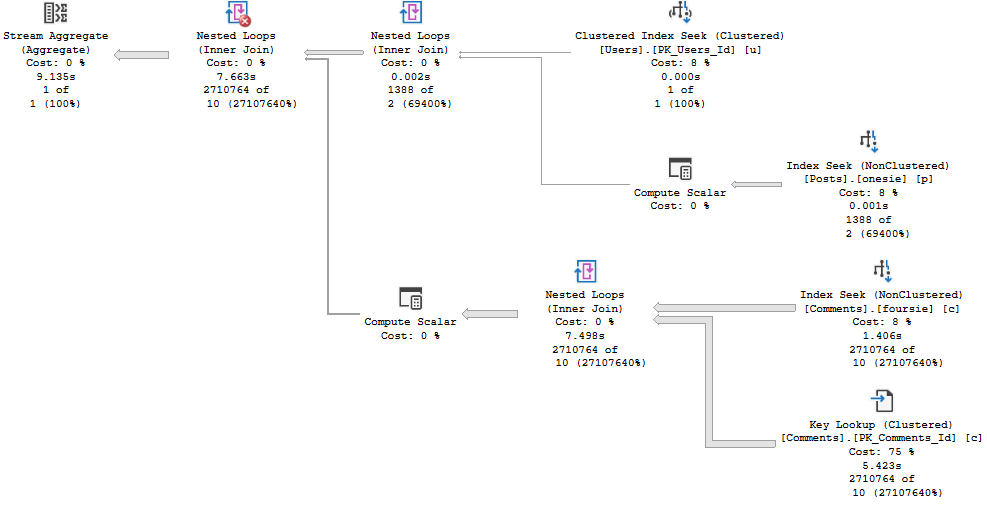
A new plan gets compiled:

SQL Server Query Plan
wouldn’t get far

And you know, it looks great for a new user.

And you know, it looks not so great for a slightly more seasoned user.

SQL Server Query Plan
you shouldn’t have!

So What Changed?


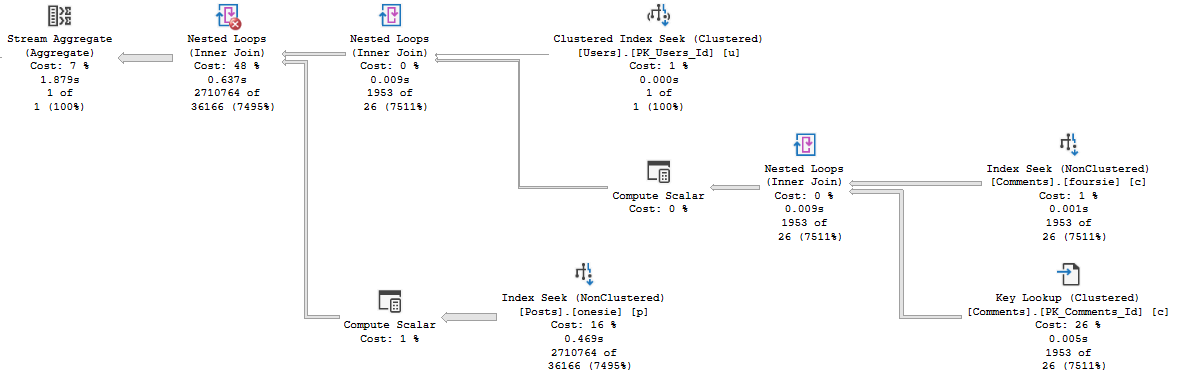
Running the query first for a user with a bit more site history gives us a plan with a very different shape, that finishes in under 2 seconds. Repeating that plan for less experienced users doesn’t cause any problems. It finishes in very little time at all.

SQL Server Query Plan
JERN ERDR

The plan itself remains largely more familiar than most parameter sniffing scenarios wind up. There are plenty more similarities than differences. It really does just come down to join order here.

Alright, now we know what happened. How would we figure out if this happened to us IRL?

I Shot The Trouble


We can do what we did yesterday, and run sp_BlitzFirst. That’ll warn us if stats recently got updated.

EXEC sp_BlitzFirst @Seconds = 10, @ExpertMode = 1;

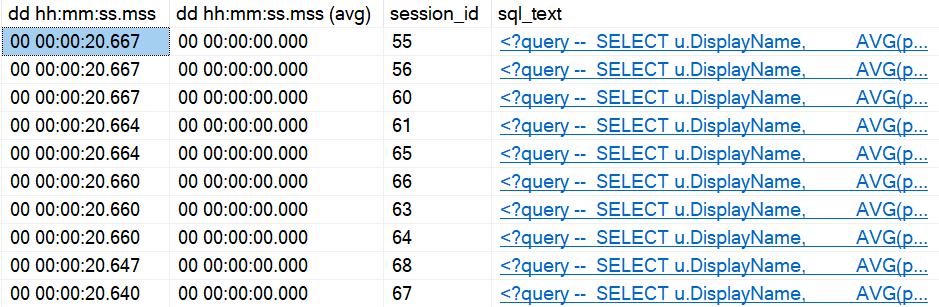
If we want to try to validate if that stats update messed with a plan, we can use sp_WhoIsActive:

EXEC sp_WhoIsActive @get_plans = 1, @get_avg_time = 1;

The get_avg_time parameter is one I’ve talked about before, and in this case it’s quite helpful.

We’ve got a bunch of queries that usually run in 0 seconds running for at least 20 seconds.

sp_WhoIsActive
bonked out

Fingerprinted


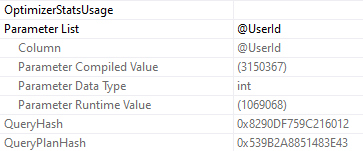
Since we used get_plans here too, we can grab the execution plan, and see which parameters were used on compilation and execution.

Get the properties of the select operator, either by right clicking and selecting properties, or hitting F4.

SQL Server Query Plan Properties
not yet

Now we know two things, and can test four things:

  • If we run this query using the compiled value, is it fast?
  • If we run this query using the runtime value, is it slow?
  • If we recompile and run it for the runtime value, is it fast or slow?
  • Is the compile time value still fast when it uses the “new” plan?

This is a little easier with stored procedures, because you can do something like:

EXEC sys.sp_recompile @objname = N'dbo.AveragePostScore';

To use DBCC FREEPROCCACHE to target a specific query, you need the sql handle or plan handle. You don’t wanna jump off and clear the whole cache here, unless you’re desperate. Just make sure you understand that you might fix one query, and break others, if you clear the whole thing.

It’s better to be targeted when possible.

And of course, if you’ve got Query Store up and running, you may do well to look at Regressed or High Variance query views there, and force the faster plan.

Thanks for reading!

Going Further


If this is the kind of SQL Server stuff you love learning about, you’ll love my training. Blog readers get 25% off the Everything Bundle — over 100 hours of performance tuning content. Need hands-on help? I offer consulting engagements from targeted investigations to ongoing retainers. Want a quick sanity check before committing to a full engagement? Schedule a call — no commitment required.
Reasons Your Query Is Slow Right Now: Unchecked SQL Server Maintenance

Chocolate Attack


I get it. You’re a good DBA.

No, you’re a great DBA.

You have alerts for when jobs fail, when they run long, and they’re all emailed to the ENTIRE COMPANY in beautifully formatted CSS.

Have a cigar.

But we all go on vacation sometime.

Overtime


One thing that can make a workload feel artificially sluggish is maintenance.

  • Index stuff: Lotsa work, sometimes blocking
  • Backup stuff: Native fulls of VLDBs, with compression
  • DBCC CHECKDB: Oh, you forgot to run this because you were busy rebuilding indexes

Darn. Gimme that cigar back.

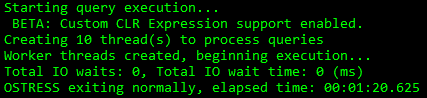
Right now, I’ve got a DBCC CHECK, and a query workload, that both run for one minute and 20 seconds when they run alone.

2020 10 07 12 42 47
Quick Queries
2020 10 07 12 43 46
Doublefast DBCC CHECKDB

Overlap


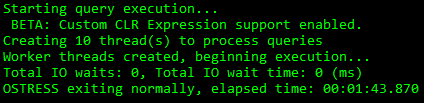
The problem becomes when I run them both at the same time. The query workload runs for about 25 seconds longer, and CHECKDB runs for two and a half minutes.

That’s like, almost twice as long.

2020 10 07 12 46 47
Ugly Queries
2020 10 07 12 46 58
Dusty DBCC CHECKDB

Now, it’s okay if you don’t have all those alerts set up. I guess.

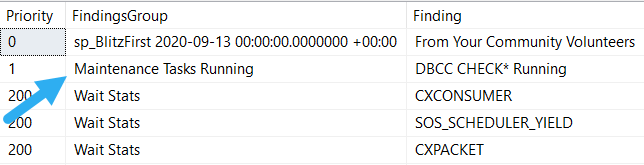
Because you can use sp_BlitzFirst to see what’s going on, and get warned:

EXEC sp_BlitzFirst @Seconds = 10, @ExpertMode = 1;
2020 10 07 13 00 56
Out of time

If you can end maintenance tasks and have performance go back to normal-bad, congratulations! You’ve solved today’s problem.

Have a cigar.

Thanks for reading!

Going Further


If this is the kind of SQL Server stuff you love learning about, you’ll love my training. Blog readers get 25% off the Everything Bundle — over 100 hours of performance tuning content. Need hands-on help? I offer consulting engagements from targeted investigations to ongoing retainers. Want a quick sanity check before committing to a full engagement? Schedule a call — no commitment required.
Reasons Your Query Is Slow Right Now: Blocking, Blocking, Blocking

Lockzilla


Blocking sucks. SQL Server should have used an optimistic isolation level by default.

Sure, writers would still block each other, but think of all the time people could have saved not explaining NOLOCK hints.

  • Yes, they still take locks
  • Yes, it’s the same as READ UNCOMMITTED
  • Yes, sometimes they make queries faster without blocking

Wait, what?

Moving Right Along


There are some interesting things to say about blocking, I suppose, aside from that it sucks.

For instance, it can look really weird when there’s parallelism. And read queries can block write queries.

There, I’ve said interesting things about blocking. It still sucks.

But how do you diagnose it?

First, close Activity Monitor.

Doctor, Doctor


My favorite tool for diagnosing blocking is sp_WhoIsActive, and I’m going to show you three different ways to look at it.

The safest way

EXEC sp_WhoIsActive @get_task_info = 2, @get_additional_info = 1;

This isn’t the way most people do it, but it is the least impactful.

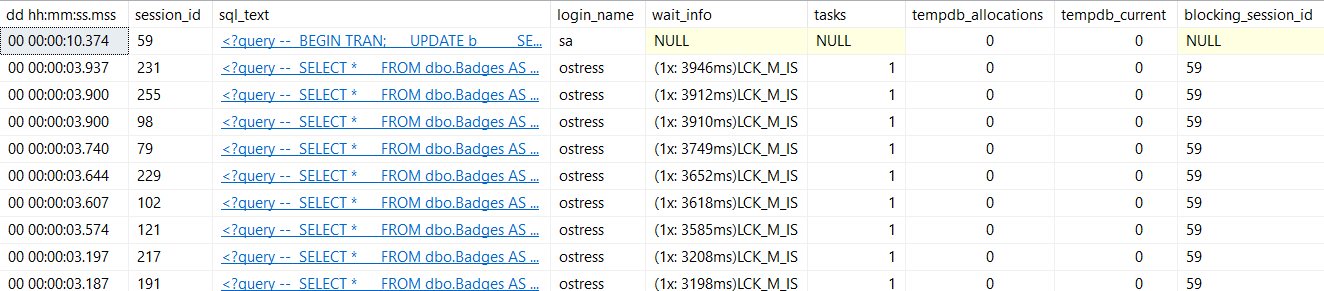
You get back the normal set of results:

sp_WhoIsActive
peachy

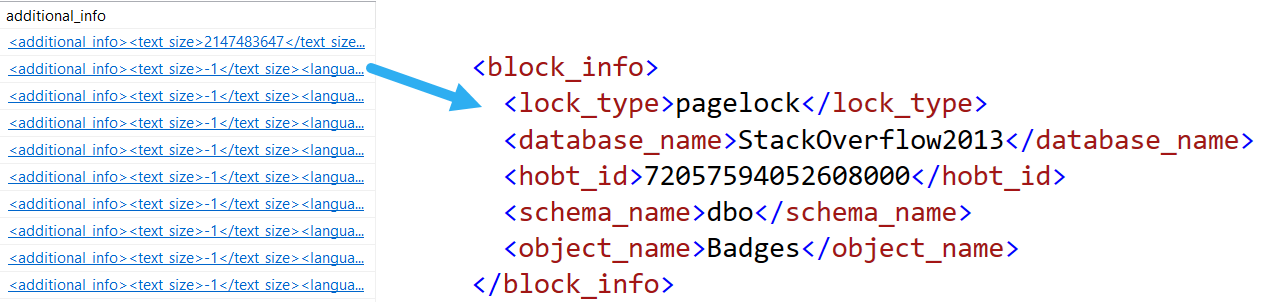
Cool, you can see queries, lock waits, and blocking sessions. But a short scroll to the right also brings you to this additional_info clickable column:

sp_WhoIsActive
oily water

It’s not so helpful for the query doing the blocking, but it’ll tell you what the queries being blocked are stuck on.

The usual way

EXEC sp_WhoIsActive @get_locks = 1;

This is the way I normally demo looking for blocking with it, because it is more useful to see what the blocking query is doing.

But I’ve also had it be slow. Really, really slow.

That can happen when there is JUST SO MUCH BLOCKING that it takes a long time to enumerate all of it.

But you’ll get back this lovely sort of detail:

sp_WhoIsActive
say it loud

Page locks. 102. Great.

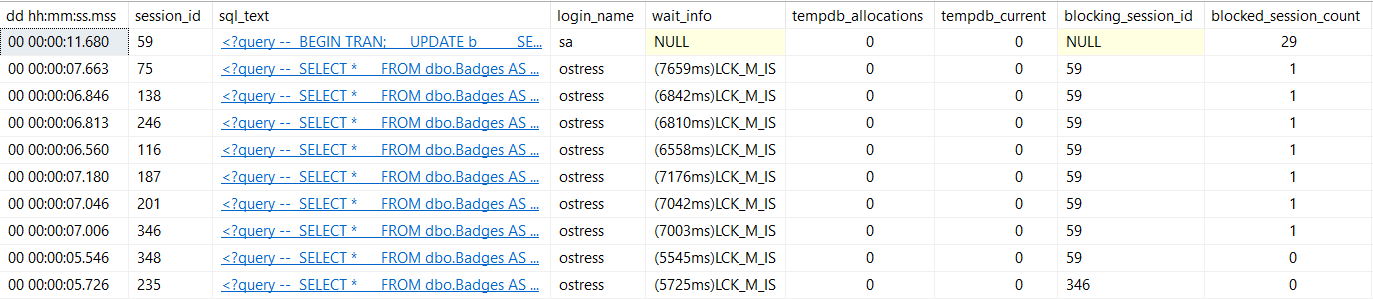
The smart way

EXEC sp_WhoIsActive @find_block_leaders = 1, @sort_order = '[blocked_session_count] DESC';

It’s not always obvious by runtime which session is causing blocking, so you can use this command to find blocking chains, and order output by who’s doing the most blocking.

sp_WhoIsActive
troubleshot

Fixins


When you need to troubleshoot live blocking, these are the ways I usually check in on things with sp_WhoIsActive. It’s hard to beat.

Of course, long term, a monitoring tool, or logging the blocked process report to a table can help you when you’re not there hitting F5 live and in-person.

We’ve peeled back a couple scenarios where oddball things can slow a server down. Tomorrow we’ll look at a new one!

What’ll it be?

Your guess is not as good as mine.

Thanks for reading!

Going Further


If this is the kind of SQL Server stuff you love learning about, you’ll love my training. Blog readers get 25% off the Everything Bundle — over 100 hours of performance tuning content. Need hands-on help? I offer consulting engagements from targeted investigations to ongoing retainers. Want a quick sanity check before committing to a full engagement? Schedule a call — no commitment required.
Reasons Your Query Is Slow Right Now: Your SQL Server Is Overloaded

Oh Baby Another Series


Don’t you love lists? I love lists. They’re so nice and tidy, like a RegEx. Just the other night I was thinking how nice it’d be to write a RegeEx to detect RegEx patterns.

I didn’t sleep.

Anyway, SQL Server. Things. Things running slowly. What’s up with that?

In these posts, I’ll walk through some common scenarios, and how to look for them.

It might even be in the EXACT SAME VERY ORDER I LOOK FOR THEM!

Put your money away.

Reason 1: The Server Is Overloaded


If you go to open a new tab in SSMS and you hear a creaking sound, it might be time to revisit some of your hardware choices.

But that’s a problem for future you. Your problem is right now.

  • How to check it: sp_PressureDetector
  • What to look for: Stuck queries, Resource Usage, Wait Stats

By default, it’ll look at both CPU and Memory counters. If you don’t know what’s going on, just hit F5.

EXEC dbo.sp_PressureDetector;

If you’re hitting memory limits, things will look like this:


SQL Server Query Results
are you ready?

Some queries will have requested memory, but it won’t have been granted.

SQL Server Query Results
payday

Waiting queries will be stuck in a queue, waiting on RESOURCE_SEMAPHORE.

SQL Server Query Results
we’re having a good time

A significant amount of memory will have been granted out, and available memory will be on the lower side. You’ll also probably see the waiter_count column

If you’re hitting CPU limits, things will look like this:


SQL Server Query Results
negative creep

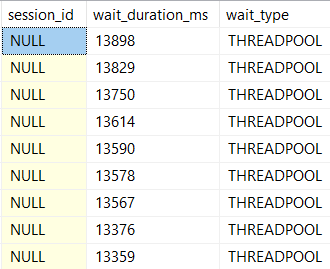
Available threads might be a negative, or very low number. Requests may be waiting on threads, and the number will pretty closely match the number of rows that are…

SQL Server Query Results
bum

Waiting in the pool.

SQL Server Query Results
she works hard for the money

This’ll also show you queries that are running, and which ones are using the most threads.

Can You Fix It Quickly?


Maybe, maybe not. If you’re allowed to kill off queries, you might be able to right the ship now. If not, you’re stuck waiting for queries to finish and give back their resources.

Longer term, you have a long checklist to go through, including asking tough questions about hardware, settings memory and parallelism settings, and your queries and indexes. This script will give you a lot of information about what’s going on. It’s up to you to figure out why.

If you need help with this sort of thing, drop me a line.

Thanks for reading!

Going Further


If this is the kind of SQL Server stuff you love learning about, you’ll love my training. Blog readers get 25% off the Everything Bundle — over 100 hours of performance tuning content. Need hands-on help? I offer consulting engagements from targeted investigations to ongoing retainers. Want a quick sanity check before committing to a full engagement? Schedule a call — no commitment required.