None of your stored procedures are a single statement. They’re long. Miles long. Ages long.
If you’re troubleshooting performance for one of those, you could end up really causing yourself some headaches if you turn on actual execution plans and fire away.
Not only is there some overhead to collecting all the information for those plans, but then SSMS has to get all artsy and draw them from the XML.
Good news, though. If you’ve got some idea about which statement(s) are causing you problems, you can use an often-overlooked SET command.
Blitzing
One place I use this technique a lot is with the Blitz procedures.
For example, if I run sp_BlitzLock without plans turned on, it’s done in about 7 seconds.
If I run it with plans turned on, it runs for a minute and 7 seconds.
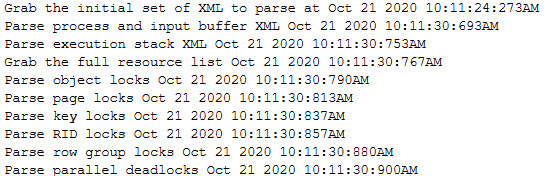
Now, a while back I had added a bit of feedback in there to help me understand which statements might be running the longest. You can check out the code I used over in the repo, but it produces some output like this:
Why is it always the XML?
If I’m not patient enough to, let’s say, wait a minute for this to run every time, I can just do something like this:
SET STATISTICS XML ON;

    /*Problem queries here*/

SET STATISTICS XML OFF;
That’ll return just the query plans you’re interested in.
Using a screenshot for a slightly different example that I happened to have handy:
click me, click me, yeah
You’ll get back the normal results, plus a clickable line that’ll open up the actual execution plan for a query right before your very eyes.
Thanks for reading!
Going Further
If this is the kind of SQL Server stuff you love learning about, you’ll love my training. Blog readers get 25% off the Everything Bundle — over 100 hours of performance tuning content. Need hands-on help? I offer consulting engagements from targeted investigations to ongoing retainers. Want a quick sanity check before committing to a full engagement? Schedule a call — no commitment required.
This a short post about a sort of quirky error message I got while trying to run the TPC-C load test against SQL Server’s in-memory tables.
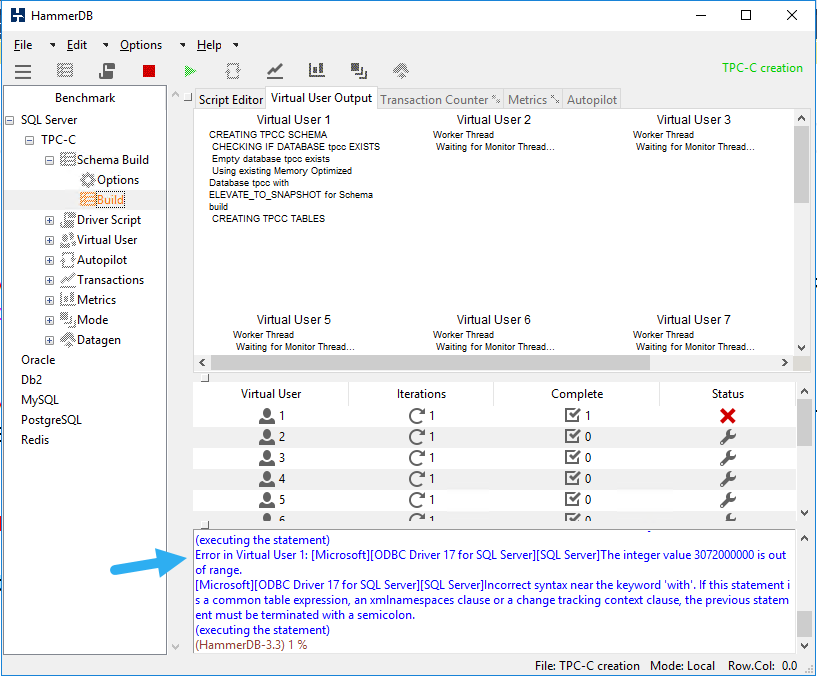
Error in Virtual User1: [Microsoft][ODBC Driver 17 for SQL Server][SQL Server]The integer value XXXXXXXXXXXX is out of range.
chucked
A few of the tables would get created, but not all of them. It wasn’t obvious where that number was coming from, until I thought back to the setup.
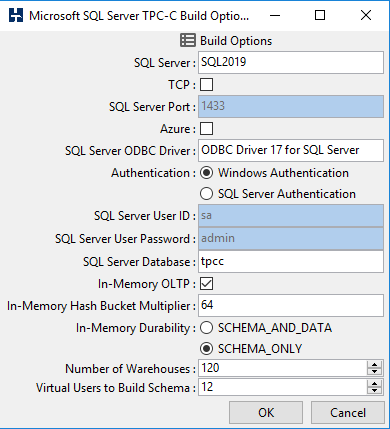
In the build script, there’s a helpful looking line for you to adjust the hash bucket count that your indexes get created with.
tinker tailor
I had set mine to a higher number, thinking it would help load speeds to have a bunch of buckets ready in there.
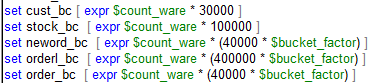
But the thing is, buried way down in the script, there’s already some math to pad the hash buckets for you.
the salty bucket
If you’re in the mood to be totally underwhelmed, you should also run this test against Hekaton.
Thanks for reading!
Going Further
If this is the kind of SQL Server stuff you love learning about, you’ll love my training. Blog readers get 25% off the Everything Bundle — over 100 hours of performance tuning content. Need hands-on help? I offer consulting engagements from targeted investigations to ongoing retainers. Want a quick sanity check before committing to a full engagement? Schedule a call — no commitment required.
I checked back to SQL Server 2012 and 2014 on their respective latest service packs, and they both still capture deadlock graphs for exchange spills.
There have been some CUs since Sp3 for SQL Server 2014, but they don’t mention anything about this being backported in them.
Why Is This A Big Deal?
If you were digging into query performance issues, or if you were capturing deadlocks somehow, you used to be able to find queries with these problems pretty easily.
In the article that describes a fix for many deadlock reports, Microsoft offers up an alternative Extended Event session to capture queries that produce error 1205 (a deadlock), but I wasn’t able to get that to capture deadlocks that were resolved by exchange spills.
I don’t think they actually produce that error, which is also why they don’t produce a deadlock graph.
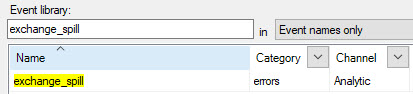
Why they did that when there is, quite not-figuratively, an event dedicated to capturing exchange spills, is beyond me.
i mean really
For me personally, it was a bit of a curveball for sp_BlitzLock. The XML that got produced for exchange spill deadlocks has different characteristics from the ones that produce errors.
There’s a lot of stuff that isn’t documented, too.
Change It Back?
I’m assuming there was some technical challenge to producing a single deadlock graph for exchange spills, which is why it got pulled instead of fixed.
Normally I’d think about opening a UserVoice item, but it doesn’t seem like it’d go anywhere.
There’s enough good ideas on there now that haven’t seen any traction or attention.
Anyway, if you’re on a newer version of SQL Server, take note of the change if you’re troubleshooting this sort of thing.
Thanks for reading!
Going Further
If this is the kind of SQL Server stuff you love learning about, you’ll love my training. Blog readers get 25% off the Everything Bundle — over 100 hours of performance tuning content. Need hands-on help? I offer consulting engagements from targeted investigations to ongoing retainers. Want a quick sanity check before committing to a full engagement? Schedule a call — no commitment required.
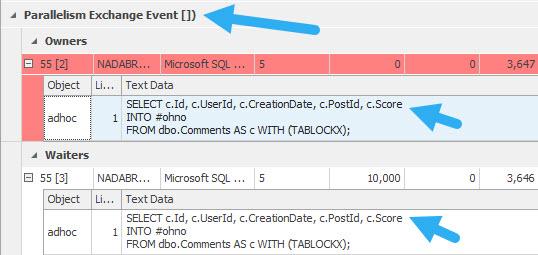
If you have a copy of the StackOverflow2013 database, this query should produce a parallel deadlock.
SELECT c.Id, c.UserId, c.CreationDate, c.PostId, c.Score
INTO #ohno
FROM dbo.Comments AS c WITH (TABLOCKX);
If you want an easy way to track down deadlocks, I can’t recommend sp_BlitzLock enough.
It doesn’t render the deadlock graph for you, but it does get you the deadlock XML, which you can save as an XDL file.
For viewing them, Sentry One’s Plan Explorer tool is way better than SSMS. It doesn’t just explore plans — it also explores deadlocks.
Graphed Out
The way it’ll look is something like this:
ow my face
You’ll see the exchange event, and you’ll also see the same query deadlocking itself.
This is an admittedly odd situation, but one I’ve had to troubleshoot a bunch of times.
You might see query error messages something like this:
Msg 1205, Level 13, State 18, Line 3
Transaction (Process ID 55) was deadlocked on lock | communication buffer resources with another process and has been chosen as the deadlock victim. Rerun the transaction.
Options For Fixing It
If you start running into these, it can be for a number of reasons, but the root cause is a parallel query. That doesn’t mean you should change MAXDOP to 1, though you should check your parallelism settings to make sure they’re not at the defaults.
You may want to try setting the query you’re having a problem with to DOP 1. Sure, performance might suffer, but at least it won’t error out.
If that’s not possible, you might need to look at other things in the query. For example, you might be missing a helpful index that would make the query fast without needing to go parallel.
Another issue you might spot in query plans is around order preserving operators. I wrote a whole bunch about that with an example here. You might see it around operators like Sorts, Merges, and Stream Aggregates when they’re surrounding parallel exchange operators. In those cases, you might need to hint HASH joins or aggregations.
Thanks for reading!
Going Further
If this is the kind of SQL Server stuff you love learning about, you’ll love my training. Blog readers get 25% off the Everything Bundle — over 100 hours of performance tuning content. Need hands-on help? I offer consulting engagements from targeted investigations to ongoing retainers. Want a quick sanity check before committing to a full engagement? Schedule a call — no commitment required.
First, a huge thank you to everyone who has bought my training so far. You all are incredible, and I owe all of you a drink.
Your support means a lot to me, and allows me to do nice stuff for other people, like give training away for free.
So far, I’ve donated $45k (!!!) worth of training to folks in need, no questions asked.
Next year, I’d like to keep doing the same thing. I’d also like to produce a whole lot more training to add value to the money you spend. In order to do that, I need to take time off from consulting, which isn’t easy to do. I’m not crying poor, but saying no to work for chunks of time isn’t easy for a one-person party.
I’m hoping that I can make enough in training bucks to make that possible.
Because this sale is extra sale-y, I’ve decided to name it after the blackest black known to man.
Going Further
If this is the kind of SQL Server stuff you love learning about, you’ll love my training. Blog readers get 25% off the Everything Bundle — over 100 hours of performance tuning content. Need hands-on help? I offer consulting engagements from targeted investigations to ongoing retainers. Want a quick sanity check before committing to a full engagement? Schedule a call — no commitment required.
When you run a query, the optimizer has a lot to think about. One of those things is if the plan will benefit from parallelism.
That generally happens as long as:
The plan isn’t trivial — it has to receive full optimization
Nothing is artificially inhibiting parallelism (like scalar functions or table variable modifications)
If the serial plan cost is greater than the Cost Threshold For Parallelism (CTFP)
As long as all those qualifications are met, the optimizer will come up with competing parallel plans. If it locates a parallel plan that’s cheaper than the serial plan, it’ll get chosen.
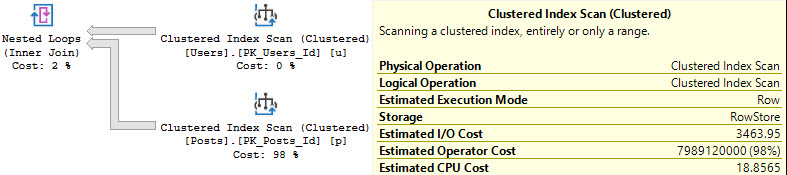
This is determined at a high level by adding up the CPU and I/O costs of each operator in the serial plan, and doing the same for the parallel plan with the added costs of one or more parallel exchanges added in.
Yesterday we saw a case where the Gather Streams operator was costed quite highly, and it prevented a parallel plan from being chosen, despite the parallel plan in this case being much faster.
It’s important to note that costing for plans is not a direct reflection of actual time or effort, nor is it accurate to your local configuration.
They’re estimates used to come up with a plan. When you get an actual plan, there are no added-in “Actual Cost” metrics.
How Nested Loops Is Different
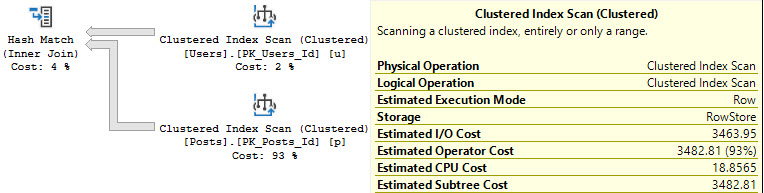
In merge or hash join plans, both sides of the join are part of the costing algorithm to decide if parallelism should be engaged.
An example with a hash join:
parallel: 4.7 CPU query bucks
seriallel: 18.8 CPU query bucks
The estimated CPU cost of scanning the Posts table is reduced by 14 or so query bucks. The I/O cost doesn’t change at all.
In this case, it results in a parallel plan being naturally chosen, because the overall plan cost for the parallel plan is cheaper.
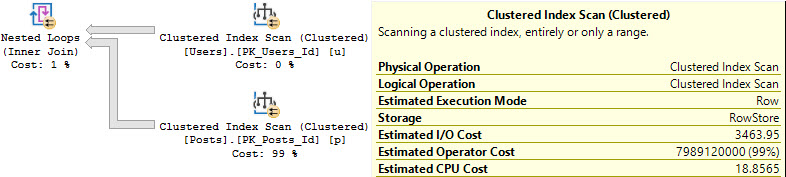
For Nested Loops, it’s different:
parallel: 18.8 CPU query bucks
seriallel: 18.8 CPU query bucks
Slashing Prices
In Nested Loops plans, only the stuff on the outer side of the join experiences a cost reduction by engaging parallelism.
That means that if you’ve got a plan shaped like this that you need to go parallel, you need to figure out how to make the outside as expensive on CPU as possible.
In a lot of cases, you can use ORDER BY to achieve this because it can introduce a Sort operator into the query plan.
Of course, where that Sort operator ends up can change things.
For example, if I ask to order results by Reputation here:
SELECT u.Id,
       u.DisplayName,
       u.Reputation,
       ca.Id,
       ca.Type,
       ca.CreationDate,
       ca.Text --Text in the select list
FROM dbo.Users AS u
OUTER APPLY
(
SELECT c.Id,
       DENSE_RANK()
           OVER ( PARTITION BY c.PostId
                  ORDER BY c.Score DESC ) AS Type,
        c.CreationDate,
        c.Text
FROM dbo.Comments AS c
WHERE c.UserId = u.Id
) AS ca
WHERE ca.Type = 0
ORDER BY u.Reputation DESC;
The Sort ends up before the join, and only applies to relatively few rows, and the plan stays serial.
boing
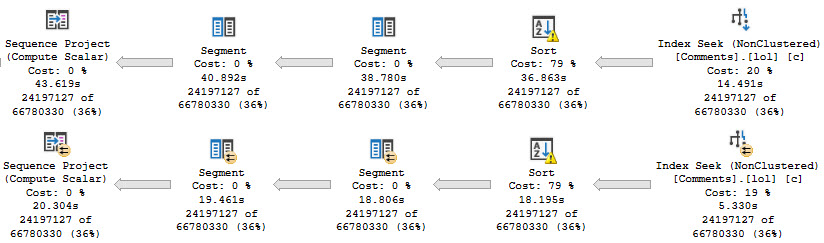
But if I ask for something from inside of the cross apply to be ordered, the number of rows the optimizer expects to have to sort increases dramatically, and so does the cost.
SELECT u.Id,
       u.DisplayName,
       u.Reputation,
       ca.Id,
       ca.Type,
       ca.CreationDate,
       ca.Text --Text in the select list
FROM dbo.Users AS u
OUTER APPLY
(
SELECT c.Id,
       DENSE_RANK()
           OVER ( PARTITION BY c.PostId
                  ORDER BY c.Score DESC ) AS Type,
        c.CreationDate,
        c.Text
FROM dbo.Comments AS c
WHERE c.UserId = u.Id
) AS ca
WHERE ca.Type = 0
ORDER BY ca.CreationDate DESC;
beachfront
The additional cost on the outer side tilts the optimizer towards a parallel plan.
There’s No Such Thing As A Free Cool Trick™
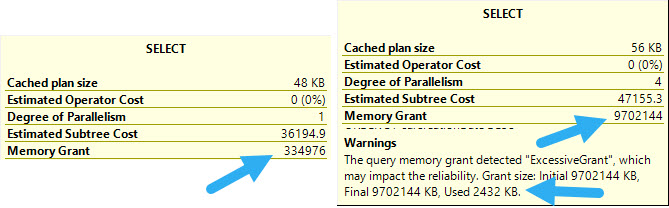
This, of course, comes at a cost. While you do gain efficiency in the query finishing much faster, the Sort operator asks for a nightmare of memory.
O HEK
If you have ~10GB of memory to spare for a memory grant, cool. This might be great.
Of course, there are other ways to control memory grants via hints and resource governor, etc.
In some cases, adding an index helps, but if we do that then we’ll lose the added cost and the parallel plan.
Like most things in life, it’s about tradeoffs.
Thanks for reading!
Going Further
If this is the kind of SQL Server stuff you love learning about, you’ll love my training. Blog readers get 25% off the Everything Bundle — over 100 hours of performance tuning content. Need hands-on help? I offer consulting engagements from targeted investigations to ongoing retainers. Want a quick sanity check before committing to a full engagement? Schedule a call — no commitment required.
And of course, sometimes they can cause plans to be costed strangely.
Strong Tradition
Working with the queries we’ve been tinkering with in all the posts this week, let’s look at a slightly different oddity.
/*Q1*/
SELECT u.Id,
       u.DisplayName,
       u.Reputation,
       ca.Id,
       ca.Type,
       ca.CreationDate,
       ca.Text --Text in the select list
FROM dbo.Users AS u
OUTER APPLY
(
SELECT c.Id,
       DENSE_RANK()
           OVER ( PARTITION BY c.PostId
                  ORDER BY c.Score DESC ) AS Type,
        c.CreationDate,
        c.Text
FROM dbo.Comments AS c
WHERE c.UserId = u.Id
) AS ca
WHERE ca.Type = 0;


/*Q2*/
SELECT u.Id,
       u.DisplayName,
       u.Reputation,
       ca.Id,
       ca.Type,
       ca.CreationDate
       -- No Text in the select list
FROM dbo.Users AS u
OUTER APPLY
(
SELECT c.Id,
       DENSE_RANK()
           OVER ( PARTITION BY c.PostId
                  ORDER BY c.Score DESC ) AS Type,
        c.CreationDate,
        c.Text
FROM dbo.Comments AS c
WHERE c.UserId = u.Id
) AS ca
WHERE ca.Type = 0;
The first query has the Text column in the outer select list, and the second query doesn’t. Please read the comments for additional clarity.
Big Plans
The plan without Text in the outer project goes parallel, and the one with it does not.
pain pain
But why?
Forcing The Issue
Let’s add a third query into the mix to force the query to go parallel.
/*Q3*/
SELECT u.Id,
       u.DisplayName,
       u.Reputation,
       ca.Id,
       ca.Type,
       ca.CreationDate,
       ca.Text --Text in the select list
FROM dbo.Users AS u
OUTER APPLY
(
SELECT c.Id,
       DENSE_RANK()
           OVER ( PARTITION BY c.PostId
                  ORDER BY c.Score DESC ) AS Type,
        c.CreationDate,
        c.Text
FROM dbo.Comments AS c
WHERE c.UserId = u.Id
) AS ca
WHERE ca.Type = 0
OPTION(USE HINT('ENABLE_PARALLEL_PLAN_PREFERENCE'));
Things are pretty interesting, here.
caloric surplus
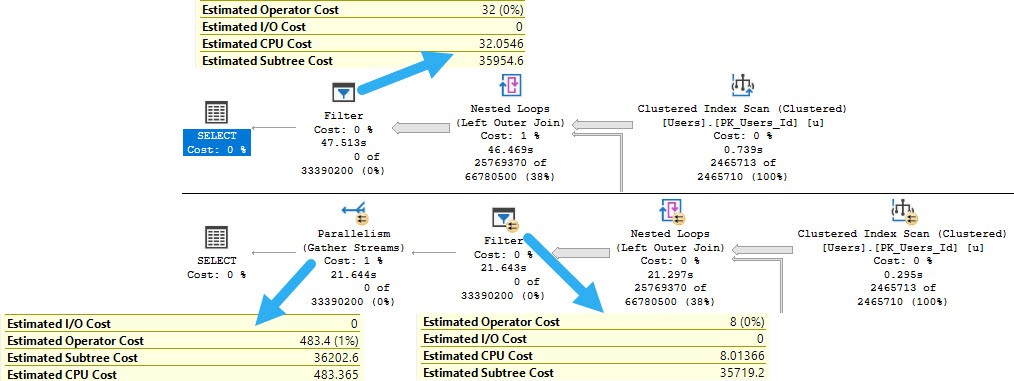
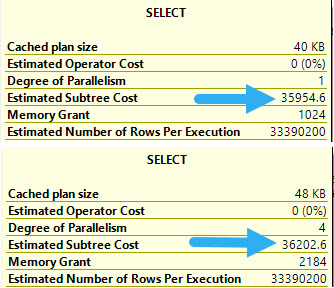
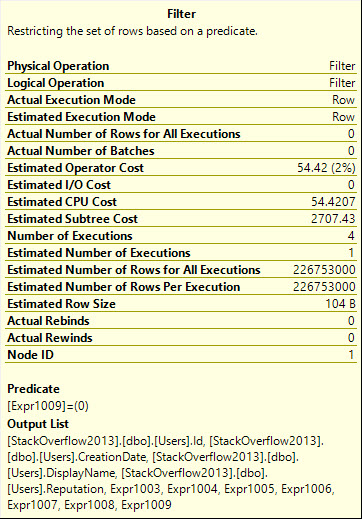
The parallel plan is actually costed cheaper up through the Filter operator. In the serial plan, the entire subtree costs 35,954. In the parallel plan, it’s at 35,719.
At 200 query bucks cheaper, we’re in good shape! And then… We Gather Streams ☹
creaky french
Mortem
The Gather Streams pushes the final plan cost for the parallel plan up higher than the serial plan.
Even though the parallel plan finishes ~26 seconds faster, the optimizer doesn’t choose it naturally because it is a cheapskate.
Bummer, huh?
An important point to keep in mind is that in nested loops join plans, the inner side of the query doesn’t receive any cost adjustments for parallel vs. serial versions. All of the costing differences will exist on the outside.
That’s why only the last few operators in the plan here are what makes a difference.
And that’s what we’ll finish out the week with!
Thanks for reading!
Going Further
If this is the kind of SQL Server stuff you love learning about, you’ll love my training. Blog readers get 25% off the Everything Bundle — over 100 hours of performance tuning content. Need hands-on help? I offer consulting engagements from targeted investigations to ongoing retainers. Want a quick sanity check before committing to a full engagement? Schedule a call — no commitment required.
But here we are again, with the optimizer treating us like fools for our index choices.
Let’s say we have this index on the Comments table:
CREATE INDEX lol
    ON dbo.Comments
        (UserId)
    INCLUDE
        (Id, PostId, Score, CreationDate, Text);
Is it a great idea? I dunno. But it’s there, and it should make things okay for this query:
SELECT u.Id,
       u.DisplayName,
       u.Reputation,
       ca.Id,
       ca.Type,
       ca.CreationDate
FROM dbo.Users AS u
OUTER APPLY
(
SELECT c.Id,
       DENSE_RANK()
           OVER ( PARTITION BY c.PostId
                  ORDER BY c.Score DESC ) AS Type,
        c.CreationDate
FROM dbo.Comments AS c
WHERE c.UserId = u.Id
) AS ca
WHERE ca.Type = 0;
You’re Round
But when we run the query and collect the plan, something rather astounding happens.
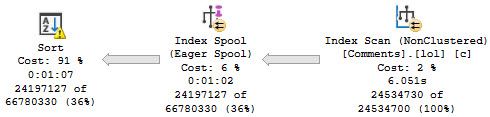
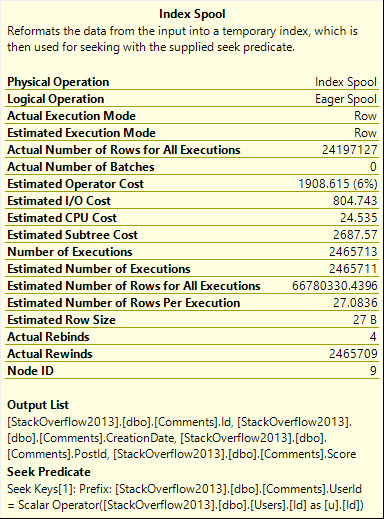
The optimizer uses our index to build a smaller index!
hard at work
Digging in on the Eager Index Spool, it’s a nearly identical copy of the index we have, just without the Text column.
it’s over
Your Mother Dresses You Funny
Of course, the optimizer being the unreasonable curmudgeon that it is, the only workaround is to also create the more narrow index.
CREATE INDEX lmao
    ON dbo.Comments
        (UserId)
    INCLUDE
        (Id, PostId, Score, CreationDate);
Or add the Text column to the select:
SELECT u.Id,
       u.DisplayName,
       u.Reputation,
       ca.Id,
       ca.Type,
       ca.CreationDate,
       ca.Text
FROM dbo.Users AS u
OUTER APPLY
(
SELECT c.Id,
       DENSE_RANK()
           OVER ( PARTITION BY c.PostId
                  ORDER BY c.Score DESC ) AS Type,
        c.CreationDate,
        c.Text
FROM dbo.Comments AS c
WHERE c.UserId = u.Id
) AS ca
WHERE ca.Type = 0;
But that has a weird side effect, too. We’ll look at that tomorrow.
Thanks for reading!
Going Further
If this is the kind of SQL Server stuff you love learning about, you’ll love my training. Blog readers get 25% off the Everything Bundle — over 100 hours of performance tuning content. Need hands-on help? I offer consulting engagements from targeted investigations to ongoing retainers. Want a quick sanity check before committing to a full engagement? Schedule a call — no commitment required.
Sending rows out to SSMS is annoying. It takes a long time when there are a lot of them, and sometimes you just wanna show a query plan that does a lot of work without all the blah blah.
One other way is a method I used in yesterday’s post.
Let’s be timely and look at that!
Everyone Loves Windowing Functions
They do all sorts of funny stuff. Number things, rank things.
And they make great demos, whether you’re trying to show how to do something cool, or make them perform well.
The funny thing is that the optimizer doesn’t really understand that, unless you intervene, the numbering and ranking doesn’t start at zero.
You can have a whole query run, do a bunch of really hard work, take a long time, and not return any rows, just by filtering to where the function = 0.
Using yesterday’s query as an example, here’s what happens:
SELECT u.Id,
       u.DisplayName,
       u.Reputation,
       u.CreationDate,
       ca.*
FROM dbo.Users AS u
OUTER APPLY
    (
        SELECT *,
        DENSE_RANK()
              OVER( PARTITION BY vs.Id
                    ORDER BY vs.Id DESC ) AS whatever
        FROM dbo.VotesSkewed AS vs
        WHERE vs.UserId = u.Id
        AND   vs.VoteTypeId BETWEEN 1 AND 5
    ) AS ca
WHERE ca.whatever = 0;
Since I’m generating the rank here on the primary key/clustered index for the table, it’s basically free to do. It’s fully supported by the index.
If you create a different index to support that, e.g. a POC index (Partitioning, Ordering, Covering), you can use that too.
FULL SIZE
Bag Of Bones
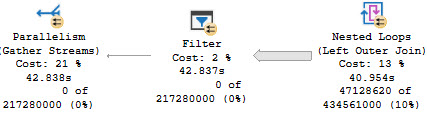
This query will, of course, return no rows. But it will do all the prerequisite work to generate a result set to filter on. That’s where that filter operator kicks in, and nothing passes through it. It’s a stopping point right before things would actually have to start kicking out to SSMS.
less than zero
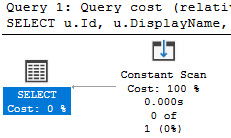
But of course, the optimizer doesn’t know that until we get there. If it did, we might just end up with a constant scan and a query that finishes instantly.
For example, if you add a silly where clause like this:
SELECT u.Id,
       u.DisplayName,
       u.Reputation,
       u.CreationDate,
       ca.*
FROM dbo.Users AS u
OUTER APPLY
    (
        SELECT *,
        DENSE_RANK()
              OVER( PARTITION BY vs.Id
                    ORDER BY vs.Id DESC ) AS whatever
        FROM dbo.VotesSkewed AS vs
        WHERE vs.UserId = u.Id
        AND   vs.VoteTypeId BETWEEN 1 AND 5
    ) AS ca
WHERE 1 = (SELECT 0)
You end up with this:
O NO A SCAN
That’s That
If you find yourself with a demo that returns a lot of rows, and you don’t want to use a TOP or OFFSET/FETCH to only return some of them, this is a fun way to return nothing.
Thanks for reading!
Going Further
If this is the kind of SQL Server stuff you love learning about, you’ll love my training. Blog readers get 25% off the Everything Bundle — over 100 hours of performance tuning content. Need hands-on help? I offer consulting engagements from targeted investigations to ongoing retainers. Want a quick sanity check before committing to a full engagement? Schedule a call — no commitment required.
Ever since SSMS started collecting wait stats in query plans, I’ve been mad about a couple things that get filtered out:
Lock waits
CXCONSUMER waits
Lock waits are particularly annoying. Imagine (I know, this might be difficult) that you have a friend who is puzzled by why a query is sometimes slow.
They send you an actual plan for when it’s fast, and an actual plan for when it’s slow. You compare them in every which way, and everything except duration is identical.
It’d be a whole lot easier to answer them if LCK waits were collected, but hey. Let’s just make them jump through another hoop to figure out what’s going on.
CXCONSUMER has a similar problem — and here’s the thing — if people are going through the trouble of collecting this information, give’em what they ask for. Don’t just give them what you think is a good idea.
Highly Affected People
Let’s look at a query where parallelism all gets skewed to one thread.
SELECT u.Id,
       u.DisplayName,
       u.Reputation,
       u.CreationDate,
       ca.*
FROM dbo.Users AS u
OUTER APPLY
    (
        SELECT *,
        DENSE_RANK()
              OVER( PARTITION BY vs.Id
                    ORDER BY vs.Id DESC ) AS whatever
        FROM dbo.VotesSkewed AS vs
        WHERE vs.UserId = u.Id
        AND   vs.VoteTypeId BETWEEN 1 AND 4
    ) AS ca
WHERE ca.whatever = 0;
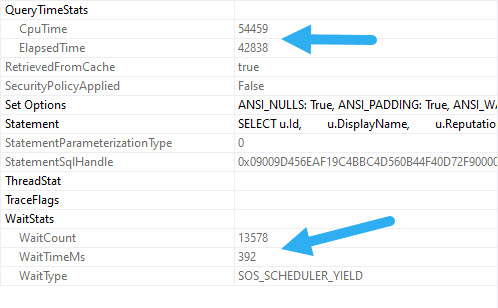
It runs for 42 seconds!
slowpoke
But the only wait collected is SOS_SCHEDULER_YIELD. For 392 ms.
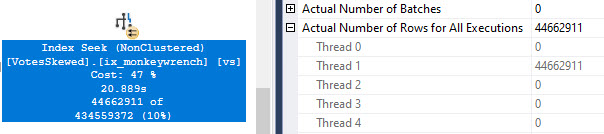
We had four waits on CXCONSUMER that all lasted nearly 11 seconds. Which of course happens because all the rows end up on one thread.
bumpin
Sure, that’s easy enough to spot if you go looking, but having CXCONSUMER waits collected would make it a whole lot easier to know what to look for.
That is surely a significant enough wait to include. And don’t tell me it’s not actionable, because I spend a good chunk of time fixing problems like this.
Thanks for reading!
Going Further
If this is the kind of SQL Server stuff you love learning about, you’ll love my training. Blog readers get 25% off the Everything Bundle — over 100 hours of performance tuning content. Need hands-on help? I offer consulting engagements from targeted investigations to ongoing retainers. Want a quick sanity check before committing to a full engagement? Schedule a call — no commitment required.