If you’ve ever tried to write a query to find stuff in Query Store and quickly gotten frustrated, you’re not alone.
Whomever designed that schema hates you. It’s probably the same person who designed Extended Events.
I know, there’s a GUI. The stuff you can find in there is definitely useful, but I often find myself wishing it did a little bit more. Asking for additional features often feels like porridge-begging, and even if something new did get added eventually, it wouldn’t help you in the moment.
With all that in mind, I wrote sp_QuickieStore to try to take some of that pain away. As of this post, it’s V1. There will likely be changes and fixes and all that good stuff, but right now it’s good enough for an introduction.
Compilation metrics, wait stats (2017+), plan cache data, query store options
If you want your numbers formatted
Where You Can Do It
sp_QuickieStore is compatible with SQL Server 2016 SP2+, 2017 CU3+, any version of 2019, and probably Azure SQL DB. I designed it to work there, but long term who knows what changes will occur that make support not possible. No promises.
It’ll take advantage of new columns added to SQL Server 2017 and 2019, and the wait stats tracking added in SQL Server 2017.
Testing on my end is done on case-sensitive instances from 2016 up. If you find bugs, please report them on GitHub. I do not offer private email support.
GitHub is also where you can go to ask for features, with the usual caveats that open source is not free development or consulting.
Thanks for understanding, and all that.
Getting Started
sp_QuickieStore has a bunch of documentation built in to the procedure, and there are a number of example calls in the repo.
Now, I know. It’s called sp_QuickieStore, so you expect it to be fast. I’ve done what I can to make things as efficient as possible, but gosh darn it all, sometimes Query Store is just gonna be Query Store.
enema
It would be nice if the maintainer of a database that promises high performance maybe put some useful indexes on their views to analyze performance so the queries that touch those views to analyze performance run quickly.
I know, I know. Take off your Crazy Pants, Erik.
Anyway, I’ll have some more posts coming this week to fill in details.
Thanks for reading!
Going Further
If this is the kind of SQL Server stuff you love learning about, you’ll love my training. Blog readers get 25% off the Everything Bundle — over 100 hours of performance tuning content. Need hands-on help? I offer consulting engagements from targeted investigations to ongoing retainers. Want a quick sanity check before committing to a full engagement? Schedule a call — no commitment required.
When I was checking out early builds of SQL Server 2019, I noticed a new DMV called dm_db_missing_index_group_stats_query, that I thought was pretty cool.
It helped you tie missing index requests to the queries that requested them. Previously, that took a whole lot of heroic effort, or luck.
With this new DMV, it’s possible to combine queries that look for missing indexes with queries that look for tuning opportunities in the plan cache or in Query Store.
It seems to tie back to dm_db_missing_index_groups, on the index_group_handle column in this DMV joined to the group handle column in the new DMV.
If you’re wondering why I’m not giving you any code samples here, it’s because I’m going to get some stuff built into sp_BlitzIndex to take advantage of it, now that it’s documented.
Special thanks to William Assaf (b|t) for helping to get this done.
Thanks for reading!
Going Further
If this is the kind of SQL Server stuff you love learning about, you’ll love my training. Blog readers get 25% off the Everything Bundle — over 100 hours of performance tuning content. Need hands-on help? I offer consulting engagements from targeted investigations to ongoing retainers. Want a quick sanity check before committing to a full engagement? Schedule a call — no commitment required.
Plus, you get a whole lot more information about what went on with all the different query metrics. As far as a source of “what happened and when”, it’s much more reliable. It’s almost like having a monitoring tool in SQL Server.
Do you trust your plan cache to tell you what was slow more than a couple days ago?
One really big bonus is that it’s portable, and it’s per-database. You can backup or clone a database so someone else can easily look at it somewhere else.
On top of that, it’s more usable: there are built in reports, a graphical interface, settings you can tweak, and plans you can force with a couple clicks.
You could solve a lot of frustrations by moving things here.
A nice to have would be predicate normalization for identical and morally equivalent queries, with totals and averages for resource usage, so you could group things together. Especially for morally equivalent queries, this would allow plan forcing where the queries get different ids.
Some monitoring tools have this in their interface, and the number of times I’ve been able to track down outliers within a group of executions to solve a problem is, well, at least memorable to me.
I wish more people had monitoring tools.
Thanks for reading!
Going Further
If this is the kind of SQL Server stuff you love learning about, you’ll love my training. Blog readers get 25% off the Everything Bundle — over 100 hours of performance tuning content. Need hands-on help? I offer consulting engagements from targeted investigations to ongoing retainers. Want a quick sanity check before committing to a full engagement? Schedule a call — no commitment required.
In this video, I dive into the fascinating world of forcing query plans using Query Store and uncover an interesting gotcha along the way. Starting off with a bit of humor about changing my company name to “Grimes’ baby name,” which promises to make paperwork more exciting, I clear out Query Store and set up an index on a users table for demonstration purposes. The video then explores how forcing query plans works when using literal values in queries versus parameterized queries. By running two different queries with the same logic but different literal values, I highlight the differences in execution plans and explain why SQL Server treats them as separate queries despite their similarity. This leads to an important lesson: if you want to force a specific plan ID for a query ID using Query Store, you must use parameterized queries to avoid the limitations imposed by literal values. The video concludes with practical advice on when and how to leverage parameterized code for better SQL Server performance management.
Full Transcript
Erik Darling here with, for now, Erik Darling data. But I’ve got paperwork in to change my company name to Grimes’ baby name. So that’s going to be fun. That should make paperwork interesting, right? So I’m going to record a hopefully hit video here. I’ve got everything going for me. I have pretty good equipment. I’ve got an interesting topic. And now all I need is for you to watch it, I guess. Actually, is it interesting? I don’t know. It might be interesting. It depends on what your kink is, I guess. So what we’re going to talk about is forcing query plans in Query Store and an interesting gotcha that I ran into. So first thing I want to do is clear out Query Store. Right there. Bada bing, bada boom.
I’ve already got this index created on the users table and a column called reputation because I want to get two different query plans based on how we query the users table. Now, both of the queries that I’m going to run at first are going to use literal values in the where clause. So this is going to be the literal value one and this is going to be the literal value two. And if I run this first query, we will get back an execution plan. I promise an actual execution plan, an actual factual execution plan.
Maybe we’ll start calling them literal execution plans because they are literally what happened. And we’ll call estimated plans figurative plans because that’s just what the optimizer figured it would do. I think that makes sense, right? So right over here we have our literal execution plan where we start by scanning the clustered index on the post table, doing some hashy bitmap stuff and then down here joining off to the users table.
But the clustered index on the users table, not the nonclustered index that we created. This will all change. This will all get freaky, deaky, wikiwile, wikiwile when we run this query. That’s going to look for reputation equals two. For reputation equals two, we start with an index seek into our nonclustered index on the users table. We do a key lookup back to the clustered index to get that display name column because the display name column is not in our nonclustered index.
And then we do some hashy bitmap stuff over here and then down the bottom, well then on the inner side of the join rather, we join to the clustered index on the post table. That song remains the same, but the stuff with the users table was much different. Now in all different DMVs, all different parts of SQL Server, queries get identified in different ways.
In query store, you have a query ID and a plan ID, but in lots of the more traditional DMVs, we have like query hash, query plan hash, SQL handle, plan handle, all sorts of different hashes, different like binary values that SQL Server uses to represent execution plans. Now what’s funny to me is that if we go and look in the sys.query store query table, rolls right off the tongue, thanks whoever designed that. If we run this query and we look at what SQL Server thinks of our execution plan or other of our queries rather, we will get one query hash for both of those queries, but we will have two query IDs for it.
So SQL Server treated this at the query level like it’s one query, but query store treated it like two different queries, and I’ll show you what I mean. If we run this to get some more details on these queries, and yes we do need to join one, two, three, four different views together to get this information out, we will see that we have across the board, query ID one has plan ID one, one execution and use 3.5 seconds of CPU time on average. So that’s for reputation equals one, we can see that over here.
Query ID two down the bottom is also plan ID two, with one execution and 1.4 seconds of CPU time, and of course that is where reputation equals two. Now, if you found some super duper mega awesome script on the internet, and you wanted to make let’s say query ID one use plan ID two, because that uses less CPU, and you’re like, wow, I could totally make this query better by just having it use this different execution plan. Well, you can’t really do that. So there’s a store procedure for query store, called whatever.
So let’s say that we want to make query ID one use plan ID two, because it uses less CPU. So we’ll plug query ID one into here and plan ID two into here. And when we run this, we will get an error because the plan ID two is not associated with query ID one. Even though, if we look back into the DMVs, well, they’re nearly the same query aside from that thing.
They can’t. Query store says we can’t share an execution plan between you two. Now, this isn’t something that’s true of plan guides. Granted, plan guides have many, many, many other things that are strange and wrong with them.
But we would be able to do this. Now, the optimizer would check to make sure we weren’t doing anything completely asinine. Like if we had a query that was like select count from post and we wanted and we said, hey, use this plan guide where you select count from votes. The optimizer would be like, you’re up to no good. Not going to go through with that.
But here, even though like logically and semantically, like really every other way possible, these two queries should be able to share the same plan because they get different query IDs. Because of those literal values, they can’t. So how you can fix this or how you can get around this is if you use parameterized queries. All right. So what we’re going to do is you know, you can use a stored procedure.
I’m going to use SP execute SQL because it’s a little bit quicker, not faster like performance wise, just quicker to like have on screen and show you. But I’m going to run this and we’re going to run it for reputation equals one first. And I have a recompile hint in here because I want to get two different execution plans.
I want new execution plans here. So I’m going to run this for reputation equals one. And note that this is parameterized. This is not the crappy, hacky kind of dynamic SQL that gets people fired because hackers destroy their database.
This is the good safe kind of dynamic SQL that handsome tattooed consultants use all day long. So we’re going to that’s I believe that one comes before two. So that should be reputation equals one.
And we can look over at the query plan and see that, yes, indeed, we got that that plan that we wanted. Now, I’m going to run this for reputation equals two. And we’re going to get the key lookup plan, which is intentional. I want that to happen.
There’s a reason that recompile hint is in there. So now we see that we got that same key lookup plan again. So that’s good. That’s exactly what we wanted. Now, when I go in, I go back to sys.queryStoreQuery for some reason, and I go and I look for other query hashes that have more than one distinct plan associated with them. And I run this, we still only have that one result in there.
That’s from that’s the one from before query hash that ends in 8044 with two query IDs associated with it. But now when we look in the query, when we do we run our 70,000 join query to get four columns back. Now we have two more lines in here.
And these two lines here, they start a little bit different. These ones have little parameters at the beginning of them. All right, let’s see that reputation thing there. And if we make this column a little bit wider, we can see that there’s a difference.
So this top one is where reputation equals one literal. This one is where reputation equals two literal. But in these, this is parameterized.
So we just see that reputation parameter in there. So now, when we have one query ID across of both of them, but two different plan IDs. So this means that we could, we could tell query ID five to always use execution plan four.
So let’s go try to do that. Remember, query ID five, you want to use four because we found this awesome script on the internet and it said, hey, you know what you should do? You should force plans where you have a better one.
And you were like, okay, I’m going to do that because I don’t feel like doing actual work. So we’re going to say query ID five, use plan ID four. And we plug that in here and we plug that in here.
Oh man, I’m exhausted. Whew. Let’s start doing cardio or something. Just kidding. Just kidding.
Just kidding. So we’re going to run this and this now, now we will be allowed to associate that other plan ID with that other query ID. So if you are the type of person who gets cranky about SQL Server performance and you are the type of person who gets cranky about, I don’t know, stuff like regressions or I don’t know, things going wrong with queries. You know, you should make some attempt to use parameterized code if you are, if you wanted to use a query store to force execution plans.
Otherwise SQL Server will do what it does. Like when it compiles a lot of, when it like sees literal values and queries and keeps compiling new plans for them. Query store does the same thing.
It’s just like, I don’t know you. And it gives them new query IDs and then, and then you can’t force query plans across query IDs. And then you actually have to go tune queries.
And that sucks. It’s always, life is always a lot better when you can just hit a button. Isn’t it?
It is for me anyway. Alright. Thanks for watchin’. I don’t know. It’s always in a rescue kit. And it’s still dying if the weather is good for you.
Going Further
If this is the kind of SQL Server stuff you love learning about, you’ll love my training. Blog readers get 25% off the Everything Bundle — over 100 hours of performance tuning content. Need hands-on help? I offer consulting engagements from targeted investigations to ongoing retainers. Want a quick sanity check before committing to a full engagement? Schedule a call — no commitment required.
Back when I first wrote sp_BlitzQueryStore, I was totally enamored with Query Store.
Like the plan cache, but better. History. Different plans for the same query. Not disturbed by memory pressure or restarts.
Then I waited patiently to find a client on 2016 using it.
And waited, and waited, and waited.
And finally, some came along.
Slow Pokes And No Pokes
When I ran it, it took forever. Not even the XML part. The XML part was fast.
Gathering the initial set of data was slow.
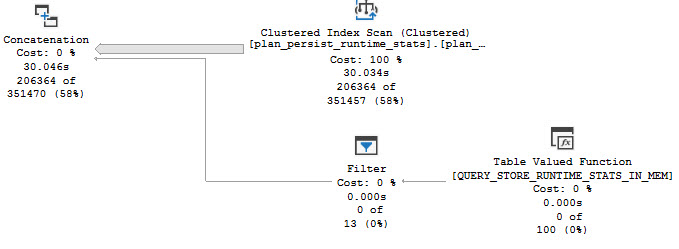
With some time to experiment and dig in, I found that the IN_MEM tables cause significant performance issues when:
Query Store is actively logging data
Query Store is > 25 MB or so
Yes, children, in memory tables can be slow, too.
The Problem
Let’s take a couple simple queries against Query Store tables:
SELECT TOP 10 *
FROM sys.query_store_runtime_stats AS qsrs
WHERE qsrs.avg_cpu_time >= 500000
AND   qsrs.last_execution_time >= DATEADD(DAY, -1, GETDATE())
ORDER BY qsrs.avg_cpu_time DESC;

SELECT TOP 10 *
FROM sys.query_store_plan AS qsp
WHERE qsp.query_plan IS NOT NULL
AND   qsp.last_execution_time >= DATEADD(DAY, -1, GETDATE())
ORDER BY qsp.last_execution_time DESC;
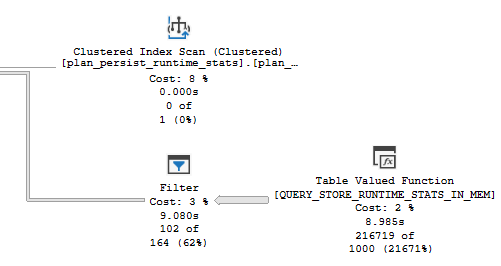
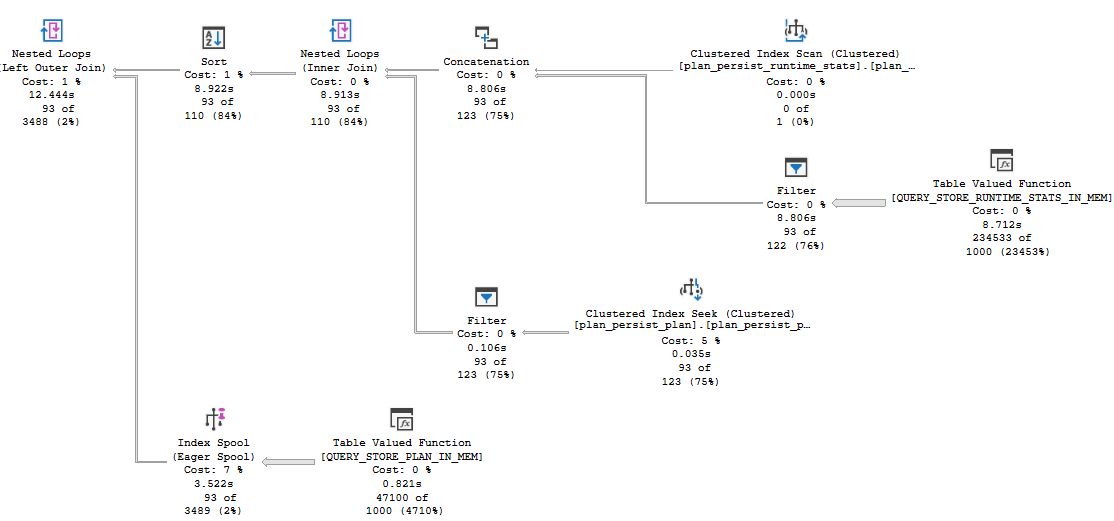
The first query runs for 10 seconds, with the entirety of the time spent filtering data out of the IN_MEM table:
Ho hum.
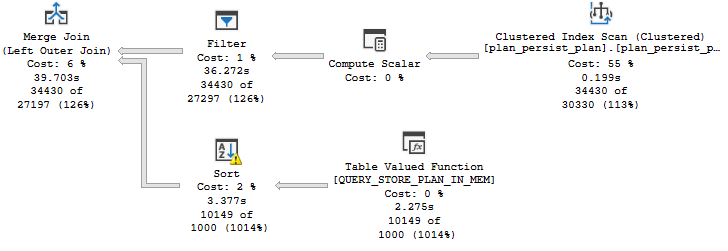
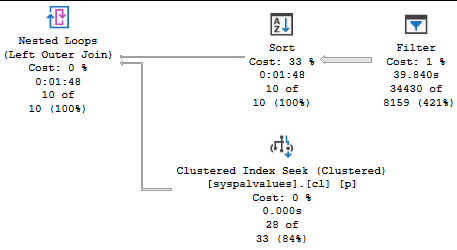
The second query is even worse, at nearly 2 minutes:
Filtering on the 1Fingerling on the floor
“Unrealistic”
I know, this configuration is probably unsupported because I used SELECT * or something.
I wrote this query hoping to quickly get the worst plans by a specific metric.
WITH the_pits
    AS
     (
         SELECT   TOP ( 101 )
                  qsrs.plan_id,
                  qsp.query_id,
                  qsrs.avg_duration / 100000. AS avg_duration_s,
                  qsrs.avg_cpu_time / 100000. AS avg_cpu_time_s,
                  qsrs.avg_query_max_used_memory,
                  qsrs.avg_logical_io_reads,
                  qsrs.avg_logical_io_writes,
                  qsrs.avg_tempdb_space_used,
                  qsrs.last_execution_time,
                  /*
                  You can stick any of the above metrics in here to
                  find offenders by different resource abuse
                  */
                  MAX(qsrs.avg_cpu_time) OVER
                  (
                      PARTITION BY
                          qsp.query_id
                      ORDER BY
                          qsp.query_id
                      ROWS UNBOUNDED PRECEDING
                  ) AS n
         FROM     sys.query_store_runtime_stats AS qsrs
         JOIN     sys.query_store_plan AS qsp
             ON qsp.plan_id = qsrs.plan_id
         WHERE    qsrs.avg_duration >= ( 5000. * 1000. )
         AND      qsrs.avg_cpu_time >= ( 1000. * 1000. )
         AND      qsrs.last_execution_time >= DATEADD(DAY, -7, GETDATE())
         AND      qsp.query_plan IS NOT NULL
         /*
         Don't forget to change this to same thing!
         */
         ORDER BY qsrs.avg_cpu_time DESC
     )
SELECT   p.plan_id,
         p.query_id,
         p.avg_duration_s,
         p.avg_cpu_time_s,
         p.avg_query_max_used_memory,
         p.avg_logical_io_reads,
         p.avg_logical_io_writes,
         p.avg_tempdb_space_used,
         p.last_execution_time,
         qsqt.query_sql_text,
         TRY_CONVERT(XML, qsp.query_plan) AS query_plan
FROM     sys.query_store_plan AS qsp
JOIN     the_pits AS p
    ON p.plan_id = qsp.plan_id
JOIN     sys.query_store_query AS qsq
    ON qsq.query_id = qsp.query_id
JOIN     sys.query_store_query_text AS qsqt
    ON qsq.query_text_id = qsqt.query_text_id
ORDER BY p.n DESC;
It works pretty well. Sometimes.
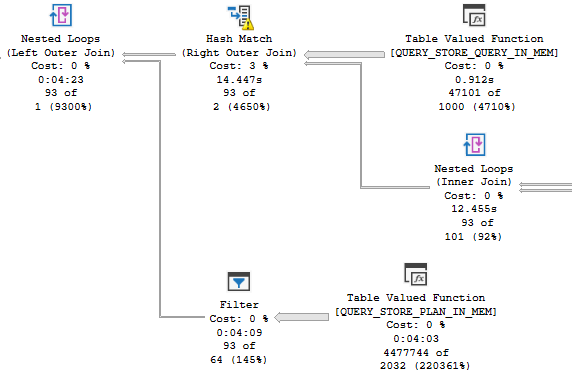
Other times, it runs for 4.5 minutes.
I know what you’re thinking: “Erik, you’re doing all sorts of crazy stuff in there. You’re making it slow.”
But none of the crazy stuff I’m doing is where the slowdown is.
It’s all in the same stuff I pointed out in the simpler queries.
12.5 seconds…FOUR MINUTES
Testing, testing
I can’t stress how much I want Query Store to be successful. I absolutely love the idea.
But it just wasn’t implemented very well. Simple filtering against the data takes forever.
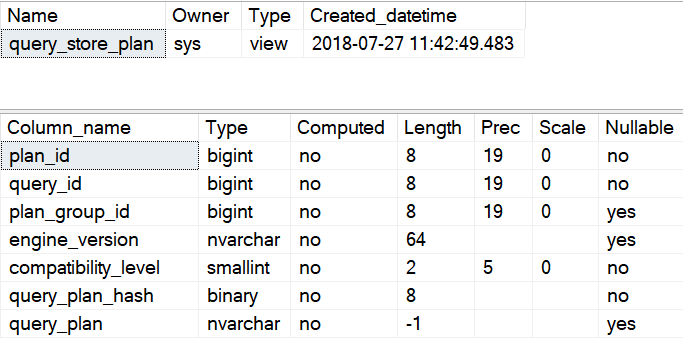
And yes, you can have NULL query plans for some reason. That’s rich.
The irony of needing to tune queries so you can find queries to tune is ironic.
I’m nearly sure of it.
Thanks for reading!
Going Further
If this is the kind of SQL Server stuff you love learning about, you’ll love my training. Blog readers get 25% off the Everything Bundle — over 100 hours of performance tuning content. Need hands-on help? I offer consulting engagements from targeted investigations to ongoing retainers. Want a quick sanity check before committing to a full engagement? Schedule a call — no commitment required.
In a SELECT statement, always use an ORDER BY clause with the TOP clause. Because, it’s the only way to predictably indicate which rows are affected by TOP.
Let’s work through a real world example.
The good
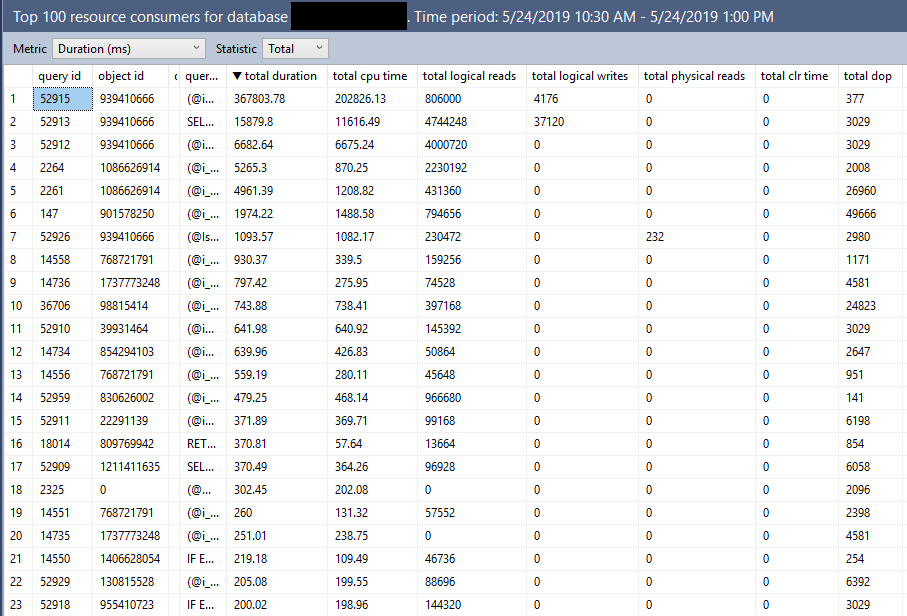
One of the great things about the “Top Resource Consuming Queries” query store SSMS report is that it is always able to render the query plan, even for very complex queries. I’m not aware of a pure T-SQL solution that can avoid requiring the end user to save xml to files in all cases. The report nearly always takes a long time to run, so it’s easy to capture the T-SQL that powers the grid details version:
DECLARE @results_row_count INT = 100,
@interval_start_time DATETIMEOFFSET = '2019-05-24 15:30:00 +00:00',
@interval_end_time DATETIMEOFFSET = '2019-05-24 18:00:00 +00:00';

SELECT TOP (@results_row_count)
    p.query_id query_id,
    q.object_id object_id,
    ISNULL(OBJECT_NAME(q.object_id),'') object_name,
    qt.query_sql_text query_sql_text,
    ROUND(CONVERT(float, SUM(rs.avg_duration*rs.count_executions))*0.001,2) total_duration,
    SUM(rs.count_executions) count_executions,
    COUNT(distinct p.plan_id) num_plans
FROM sys.query_store_runtime_stats rs
    JOIN sys.query_store_plan p ON p.plan_id = rs.plan_id
    JOIN sys.query_store_query q ON q.query_id = p.query_id
    JOIN sys.query_store_query_text qt ON q.query_text_id = qt.query_text_id
WHERE NOT (rs.first_execution_time > @interval_end_time OR rs.last_execution_time < @interval_start_time)
GROUP BY p.query_id, qt.query_sql_text, q.object_id
HAVING COUNT(distinct p.plan_id) >= 1
ORDER BY total_duration DESC;
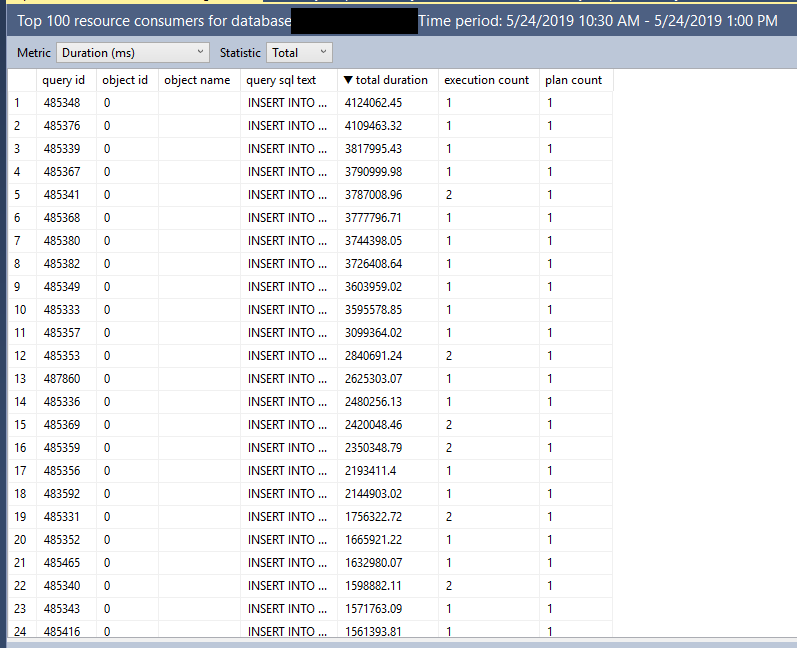
Note the presence of the ORDER BY. I get exactly the results that I was expecting:
The bad
If I ask for extra details (who doesn’t want more details?), a significantly more complex query is generated:
-- grid format query with additional details
-- grid format query with additional details
DECLARE @results_row_count INT = 100,
@interval_start_time DATETIMEOFFSET = '2019-05-24 15:30:00 +00:00',
@interval_end_time DATETIMEOFFSET = '2019-05-24 18:00:00 +00:00';

With wait_stats AS
(
SELECT
    ws.plan_id plan_id,
    ws.execution_type,
    ROUND(CONVERT(float, SUM(ws.total_query_wait_time_ms)/SUM(ws.total_query_wait_time_ms/ws.avg_query_wait_time_ms))*1,2) avg_query_wait_time,
    ROUND(CONVERT(float, SQRT( SUM(ws.stdev_query_wait_time_ms*ws.stdev_query_wait_time_ms*(ws.total_query_wait_time_ms/ws.avg_query_wait_time_ms))/SUM(ws.total_query_wait_time_ms/ws.avg_query_wait_time_ms)))*1,2) stdev_query_wait_time,
    CAST(ROUND(SUM(ws.total_query_wait_time_ms/ws.avg_query_wait_time_ms),0) AS BIGINT) count_executions,
    MAX(itvl.end_time) last_execution_time,
    MIN(itvl.start_time) first_execution_time
FROM sys.query_store_wait_stats ws
    JOIN sys.query_store_runtime_stats_interval itvl ON itvl.runtime_stats_interval_id = ws.runtime_stats_interval_id
WHERE NOT (itvl.start_time > @interval_end_time OR itvl.end_time < @interval_start_time)
GROUP BY ws.plan_id, ws.runtime_stats_interval_id, ws.execution_type ),
top_wait_stats AS
(
SELECT TOP (@results_row_count)
    p.query_id query_id,
    q.object_id object_id,
    ISNULL(OBJECT_NAME(q.object_id),'') object_name,
    qt.query_sql_text query_sql_text,
    ROUND(CONVERT(float, SUM(ws.avg_query_wait_time*ws.count_executions))*1,2) total_query_wait_time,
    SUM(ws.count_executions) count_executions,
    COUNT(distinct p.plan_id) num_plans
FROM wait_stats ws
    JOIN sys.query_store_plan p ON p.plan_id = ws.plan_id
    JOIN sys.query_store_query q ON q.query_id = p.query_id
    JOIN sys.query_store_query_text qt ON q.query_text_id = qt.query_text_id
WHERE NOT (ws.first_execution_time > @interval_end_time OR ws.last_execution_time < @interval_start_time)
GROUP BY p.query_id, qt.query_sql_text, q.object_id
),
top_other_stats AS
(
SELECT TOP (@results_row_count)
    p.query_id query_id,
    q.object_id object_id,
    ISNULL(OBJECT_NAME(q.object_id),'') object_name,
    qt.query_sql_text query_sql_text,
    ROUND(CONVERT(float, SUM(rs.avg_duration*rs.count_executions))*0.001,2) total_duration,
    ROUND(CONVERT(float, SUM(rs.avg_cpu_time*rs.count_executions))*0.001,2) total_cpu_time,
    ROUND(CONVERT(float, SUM(rs.avg_logical_io_reads*rs.count_executions))*8,2) total_logical_io_reads,
    ROUND(CONVERT(float, SUM(rs.avg_logical_io_writes*rs.count_executions))*8,2) total_logical_io_writes,
    ROUND(CONVERT(float, SUM(rs.avg_physical_io_reads*rs.count_executions))*8,2) total_physical_io_reads,
    ROUND(CONVERT(float, SUM(rs.avg_clr_time*rs.count_executions))*0.001,2) total_clr_time,
    ROUND(CONVERT(float, SUM(rs.avg_dop*rs.count_executions))*1,0) total_dop,
    ROUND(CONVERT(float, SUM(rs.avg_query_max_used_memory*rs.count_executions))*8,2) total_query_max_used_memory,
    ROUND(CONVERT(float, SUM(rs.avg_rowcount*rs.count_executions))*1,0) total_rowcount,
    ROUND(CONVERT(float, SUM(rs.avg_log_bytes_used*rs.count_executions))*0.0009765625,2) total_log_bytes_used,
    ROUND(CONVERT(float, SUM(rs.avg_tempdb_space_used*rs.count_executions))*8,2) total_tempdb_space_used,
    SUM(rs.count_executions) count_executions,
    COUNT(distinct p.plan_id) num_plans
FROM sys.query_store_runtime_stats rs
    JOIN sys.query_store_plan p ON p.plan_id = rs.plan_id
    JOIN sys.query_store_query q ON q.query_id = p.query_id
    JOIN sys.query_store_query_text qt ON q.query_text_id = qt.query_text_id
WHERE NOT (rs.first_execution_time > @interval_end_time OR rs.last_execution_time < @interval_start_time)
GROUP BY p.query_id, qt.query_sql_text, q.object_id
)
SELECT TOP (@results_row_count)
    A.query_id query_id,
    A.object_id object_id,
    A.object_name object_name,
    A.query_sql_text query_sql_text,
    A.total_duration total_duration,
    A.total_cpu_time total_cpu_time,
    A.total_logical_io_reads total_logical_io_reads,
    A.total_logical_io_writes total_logical_io_writes,
    A.total_physical_io_reads total_physical_io_reads,
    A.total_clr_time total_clr_time,
    A.total_dop total_dop,
    A.total_query_max_used_memory total_query_max_used_memory,
    A.total_rowcount total_rowcount,
    A.total_log_bytes_used total_log_bytes_used,
    A.total_tempdb_space_used total_tempdb_space_used,
    ISNULL(B.total_query_wait_time,0) total_query_wait_time,
    A.count_executions count_executions,
    A.num_plans num_plans
FROM top_other_stats A LEFT JOIN top_wait_stats B on A.query_id = B.query_id and A.query_sql_text = B.query_sql_text and A.object_id = B.object_id
WHERE A.num_plans >= 1
ORDER BY total_duration DESC
)
Now we have not 1, not 2, but THREE TOP operators! But only one of them has an ORDER BY. The results are completely different, and are pretty much useless:
The ugly
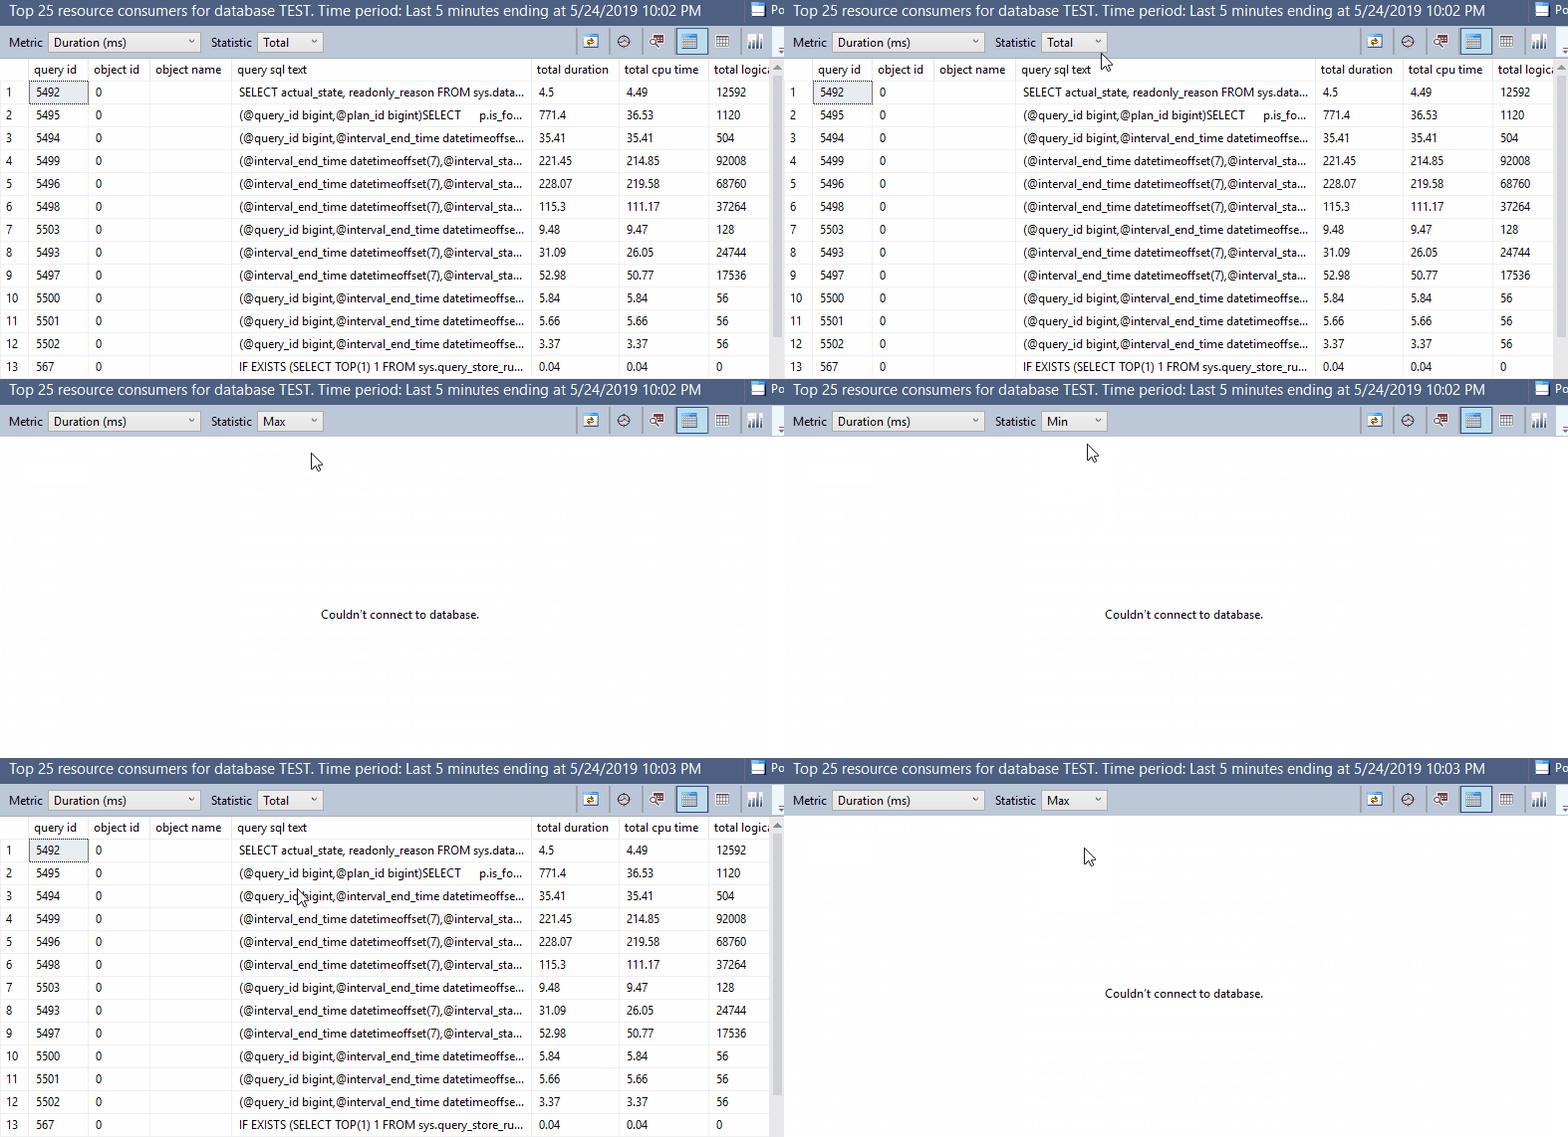
This has nothing to do with TOP as far as I know, but I included it just for fun:
Final thoughts
All of you developers out there should watch your TOPs and make sure you’re using ORDER BY as needed. Otherwise, you might end up with annoyed end users writing blog posts about your code.
Thanks for reading!
Going Further
If this is the kind of SQL Server stuff you love learning about, you’ll love my training. Blog readers get 25% off the Everything Bundle — over 100 hours of performance tuning content. Need hands-on help? I offer consulting engagements from targeted investigations to ongoing retainers. Want a quick sanity check before committing to a full engagement? Schedule a call — no commitment required.