Improving AT TIME ZONE Performance

Queries that use the AT TIME ZONE operator may perform worse than desired. For example, Jonathan Kehayias blogged about performance struggles with AT TIME ZONE at sqlskills.com. One key difference between Jonathan’s opinion and my own is that I enjoy writing these kinds of posts.

Test Data

The test data consists of one million rows per day over the month of January 2022 for a total of 31 million rows.

DROP TABLE IF EXISTS dbo.CCIForBlog;

CREATE TABLE dbo.CCIForBlog (
    SaleTimeUTC DATETIME2 NOT NULL,
    WidgetCount BIGINT NOT NULL,
    INDEX CCI CLUSTERED COLUMNSTORE
);

GO

SET NOCOUNT ON;

DECLARE
    @StartDate DATETIME2 = '20220101',
    @DaysToLoad INT = 31,
    @DaysLoaded INT = 0;

WHILE @DaysLoaded < @DaysToLoad
BEGIN
    INSERT INTO dbo.CCIForBlog (SaleTimeUTC, WidgetCount)
    SELECT DATEADD(SECOND, q.RN / 11.5, @StartDate), q.RN / 100000
    FROM
    (
        SELECT TOP (1000000) ROW_NUMBER() OVER (ORDER BY (SELECT NULL))
        FROM master..spt_values t1
        CROSS JOIN master..spt_values t2
    ) q (RN)
    OPTION (MAXDOP 1);

    SET @StartDate = DATEADD(DAY, 1, @StartDate);
    SET @DaysLoaded = @DaysLoaded + 1;
END;

CREATE STATISTICS S1 ON CCIForBlog (SaleTimeUTC);

Data is saved to a table with a clustered columnstore index. Of course, this is a small amount of data for a columnstore table. However, it is more than sufficient to demonstrate AT TIME ZONE as a performance bottleneck.

Filtering

Suppose an end user wants a count of widgets sold between January 3rd and January 6th. A first attempt at this query could look like the following:

SELECT SUM(WidgetCount)
FROM dbo.CCIForBlog c
WHERE c.SaleTimeUTC >= '20220103'
AND c.SaleTimeUTC < '20220106'
OPTION (MAXDOP 1);

This query plays to all of columnstore’s strengths and it only takes around 10 milliseconds to execute. The data was loaded in date order so most of the rowgroups are eliminated. However, end users don’t think in terms of UTC time. The end user actually wanted Central Standard Time. After a bit of research, the query is changed to as follows:

SELECT SUM(WidgetCount)
FROM dbo.CCIForBlog c
WHERE SWITCHOFFSET(c.SaleTimeUTC, 0) AT TIME ZONE 'Central Standard Time' >= '20220103'
AND SWITCHOFFSET(c.SaleTimeUTC, 0) AT TIME ZONE 'Central Standard Time' < '20220106'
OPTION (MAXDOP 1);

The AT TIME ZONE operator is useful when the number of offset minutes is unknown. UTC always has an offset of 0 so it is better to use SWITCHOFFSET(datetimeoffset_expression, 0)as opposed to AT TIME ZONE ‘UTC’. Even so, the query still takes over 3 minutes to execute on my machine. Nearly all of the execution time is spent on performing AT TIME ZONE calculations:

Note that using c.SaleTimeUTC AT TIME ZONE 'UTC' AT TIME ZONE 'Central Standard Time' would double the execution time.

One idea is to rewrite the filtering so that the time zone conversions are done on the constant values instead of the column:

WHERE c.SaleTimeUTC >= SWITCHOFFSET('20220103' AT TIME ZONE 'Central Standard Time', 0)
AND c.SaleTimeUTC < SWITCHOFFSET('20220106' AT TIME ZONE 'Central Standard Time', 0)

I strongly recommend against this approach. It can lead to wrong results for some time zones and boundary points. Instead, you can use the fact that datetimeoffset only supports an offset of up to +-14 hours. That means that (local – 14 hours) < UTC < (local + 14 hours) is true for any time zone and any point in time. A logically redundant filter can be added to the query:

SELECT SUM(WidgetCount)
FROM dbo.CCIForBlog c
WHERE SWITCHOFFSET(c.SaleTimeUTC, 0) AT TIME ZONE 'Central Standard Time' >= '20220103'
AND SWITCHOFFSET(c.SaleTimeUTC, 0) AT TIME ZONE 'Central Standard Time' < '20220106'
AND c.SaleTimeUTC >= DATEADD(HOUR, -14, '20220103')
AND c.SaleTimeUTC < DATEADD(HOUR, 14, '20220106')
OPTION (MAXDOP 1);

The newly improved query finishes in around 26 seconds. It is able to benefit from rowgroup elimination and performs significantly fewer time zone conversions compared to the original query. In this case, we were able to use knowledge about time zones and a bit of date math to improve performance from over 3 minutes to about 26 seconds.

Grouping

Suppose that an end user wants widget counts summarized by date. A first attempt at this query could look like the following:

SELECT ca.ConvertedDate, SUM(WidgetCount)
FROM dbo.CCIForBlog c
CROSS APPLY (
    SELECT CAST(c.SaleTimeUTC AS DATE)
) ca (ConvertedDate)
GROUP BY ca.ConvertedDate
OPTION (MAXDOP 1);

This query takes about 1 second on my machine. However, once again, the end user wants the data to be in CST instead of UTC. The following approach takes around 3 minutes:

SELECT ca.ConvertedDate, SUM(WidgetCount)
FROM dbo.CCIForBlog c
CROSS APPLY (
    SELECT CAST(SWITCHOFFSET(c.SaleTimeUTC, 0) AT TIME ZONE 'Central Standard Time' AS DATE)
) ca (ConvertedDate)
GROUP BY ca.ConvertedDate
OPTION (MAXDOP 1);

This should not be a surprise because the bottleneck in query performance is performing 31 million AT TIME ZONE calculations. That doesn’t change if the query performs filtering or grouping.

Historically, governments only perform daylight saving time or offset switches on the minute. For example, an offset won’t change at 2:00:01 AM, but it might change at 2:00:00 AM. The source data has one million rows per day, so grouping the date truncated to the minute, applying the time zone conversion to the truncated distinct values, and finally grouping by date should lead to significant performance improvement. One way to accomplish this:

SELECT ca.ConvertedDate, SUM(SumWidgetCount)
FROM 
(
    SELECT DATEADD(MINUTE, DATEDIFF(MINUTE, '20000101', c.SaleTimeUTC), '20000101'), SUM(WidgetCount)
    FROM dbo.CCIForBlog c
    GROUP BY DATEADD(MINUTE, DATEDIFF(MINUTE, '20000101', c.SaleTimeUTC), '20000101')
) q (SaleTimeUTCTrunc, SumWidgetCount)
CROSS APPLY (
    SELECT CAST(SWITCHOFFSET(q.SaleTimeUTCTrunc, 0) AT TIME ZONE 'Central Standard Time' AS DATE)
) ca (ConvertedDate)
GROUP BY ca.ConvertedDate
OPTION (MAXDOP 1);

The new query takes around 4 seconds on my machine. It needs to perform 44650 time zone conversions instead of 31 million. Once again, we were able to use knowledge about time zones and a bit of date math to improve performance.

Functioning

I’ve developed and open sourced replacement functions for AT TIME ZONE to provide an easier way of improving performance for queries that use AT TIME ZONE. The TZGetOffsetsDT2 function returns a pair of offsets and the TZFormatDT2 function transforms those offsets into the desired data type. The filtering query can be written as the following:

SELECT SUM(WidgetCount)
FROM dbo.CCIForBlog c
OUTER APPLY dbo.TZGetOffsetsDT2 (c.SaleTimeUTC, N'UTC', N'Central Standard Time') o
CROSS APPLY dbo.TZFormatDT2 (c.SaleTimeUTC, N'UTC', N'Central Standard Time', o.OffsetMinutes, o.TargetOffsetMinutes) f
WHERE f.ConvertedDateTime2 >= '20220103'
AND f.ConvertedDateTime2 < '20220106'
OPTION (MAXDOP 1);

The new query takes around 10 seconds to execute. The new query plan is able to use batch mode processing at every step:


If desired, performance can be further improved by adding the same redundant filters as before:

SELECT SUM(WidgetCount)
FROM dbo.CCIForBlog c
OUTER APPLY dbo.TZGetOffsetsDT2 (c.SaleTimeUTC, N'UTC', N'Central Standard Time') o
CROSS APPLY dbo.TZFormatDT2 (c.SaleTimeUTC, N'UTC', N'Central Standard Time', o.OffsetMinutes, o.TargetOffsetMinutes) f
WHERE f.ConvertedDateTime2 >= '20220103'
AND f.ConvertedDateTime2 < '20220106'
AND c.SaleTimeUTC >= DATEADD(HOUR, -14, '20220103')
AND c.SaleTimeUTC < DATEADD(HOUR, 14, '20220106')
OPTION (MAXDOP 1);

The most optimized version takes around 1 second to execute. Quite an improvement compared to 3 minutes!

The grouping query can also be rewritten using the new functions:

SELECT f.ConvertedDate, SUM(WidgetCount)
FROM dbo.CCIForBlog c
OUTER APPLY dbo.TZGetOffsetsDT2 (c.SaleTimeUTC, N'UTC', N'Central Standard Time') o
CROSS APPLY dbo.TZFormatDT2 (c.SaleTimeUTC, N'UTC', N'Central Standard Time', o.OffsetMinutes, o.TargetOffsetMinutes) f
GROUP BY f.ConvertedDate
OPTION (MAXDOP 1);

This version takes about 7 seconds to execute. This is slower than the date truncation method which took 4 seconds but still much faster than the original AT TIME ZONE method.

Unfortunately, SQL Server limitations require a pair of functions to get the best performance. The open source project does provide a simpler function that can be called by itself but it is only eligible for nested loop joins.

Upgrading

SQL Server 2022 RC1 has signs of improvement for AT TIME ZONE. The basic queries that use AT TIME ZONE in this blog post take about 75 seconds to execute on my machine, so it could be estimated that SQL Server 2022 will reduce the CPU footprint of AT TIME ZONE by 60%. Release candidates are not fully optimized so it’s possible that final performance numbers will be different once the product goes GA. I suspect that these performance improvements are already present in Azure SQL Database but I can’t find any documentation for the change.

Final Thoughts

Please try my open source project if you’re experiencing performance problems with AT TIME ZONE. Thanks for reading!
Fixing Ordered Column Store Sorting In SQL Server 2022

Groove Is In The Heart


When Brent posted about the availability of, and disappointment with creating ordered column store indexes in SQL Server 2022, I got to work.

I can’t have my dear friend Brent being all distraught with all those fast cars around. That’s how accidents happen, and I fear he might leave the Blitz scripts to me in his will or something.

Anyway, I decided to dig in and see what was going on behind the scenes. Which of course, means query plans, and bothering people who are really good at debuggers.

Most of the problems that you’ll run into in SQL Server will come from sorting data.

Whenever I have to think about Sorts, I head to this post about all the different Sorts you might see in a query plan.

More on that later, though.

Cod Piece


In Paul’s post, he talks about using undocumented trace flag 8666 to get additional details about Sort operators.

Let’s do that. Paul is smart, though he is always completely wrong about which season it is.

DROP TABLE IF EXISTS
    dbo.Votes_CCI;

SELECT
    v.*
INTO dbo.Votes_CCI
FROM dbo.Votes AS v;

I’m using the Votes table because it’s nice and narrow and I don’t have to tinker with any string columns.

Strings in databases were a mistake, after all.

DBCC TRACEON(8666);
CREATE CLUSTERED COLUMNSTORE INDEX
    vcci
ON dbo.Votes_CCI
ORDER (Postid);
DBCC TRACEOFF(8666);

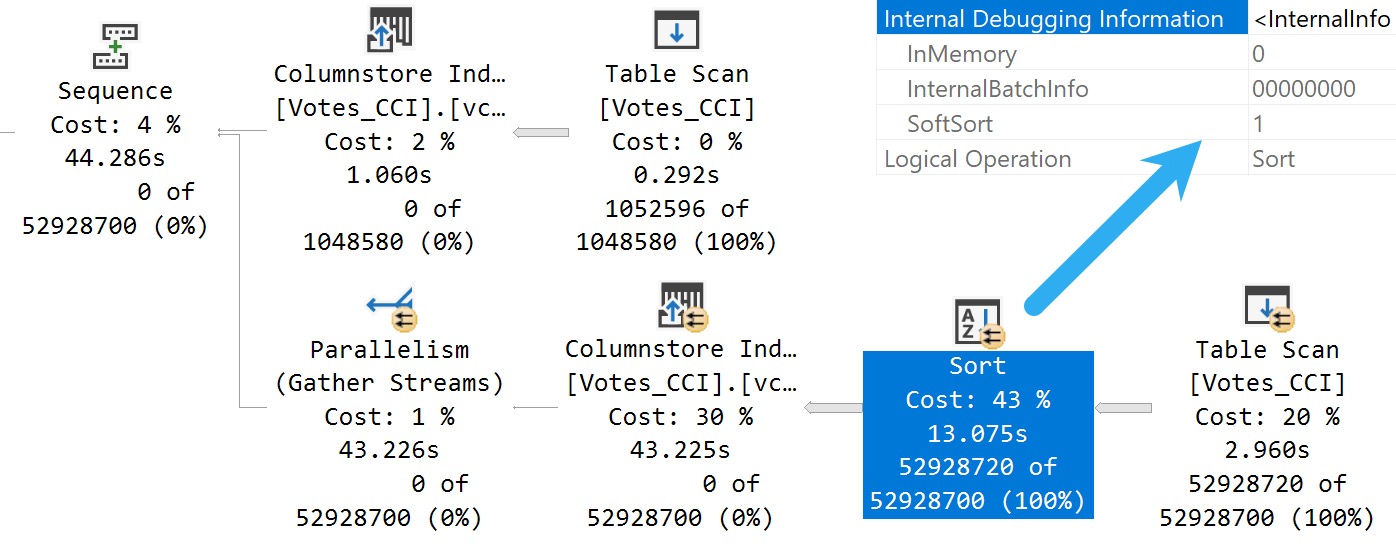
Here’s what we get back in the query plan:

SQL Server Query Plan
Tainted Sort

We’ve got a Soft Sort! What does our seasonally maladjusted friend say about those?

A “soft sort” uses only its primary memory grant and never spills. It doesn’t guarantee fully-sorted output. Each sort run using the available memory grant will be sorted. A “sort sort” represents a best effort given the resource available. This property can be used to infer that a Sort is implemented with CQScanPartitionSortNew without attaching a debugger. The meaning of the InMemory property flag shown above will be covered in part 2. It does not indicate whether a regular sort was performed in memory or not.

Well, with that attitude, it’s not surprising that there are so many overlapping buckets in the column store index. If it’s not good enough, what can you do?

Building the index with the Soft Sort here also leads to things being as bad as they were in Brent’s post.

Insert Debugging Here


Alas, there’s (almost) always a way. Microsoft keeps making these trace flag things.

There are a bunch of different ways to track them down, but figuring out the behavior of random trace flags that you may find just by enabling them isn’t easy.

One way to tie a trace flag to a behavior is to use WinDbg to step through different behaviors in action, and see if SQL Server checks to see if a trace flag is enabled when that behavior is performed.

If you catch that, you can be reasonably sure that the trace flag will have some impact on the behavior. Not all trace flags can be enabled at runtime. Some need to be enabled as startup options.

Sometimes it’s hours and hours of work to track this stuff down, and other times Paul White (b|t) already has notes on helpful ones.

The trace flag below, 2417, is present going back to SQL Server 2014, and can help with the Soft Sort issues we’re seeing when building ordered clustered column store indexes today.

Here’s another one:

DBCC TRACEON(8666, 2417);
CREATE CLUSTERED COLUMNSTORE INDEX
    vcci
ON dbo.Votes_CCI
ORDER (Postid)
WITH(MAXDOP = 1);
DBCC TRACEOFF(8666, 2417);

The MAXDOP 1 hint isn’t strictly necessary. With a parallel plan, you may see up to DOP overlapping row groups.

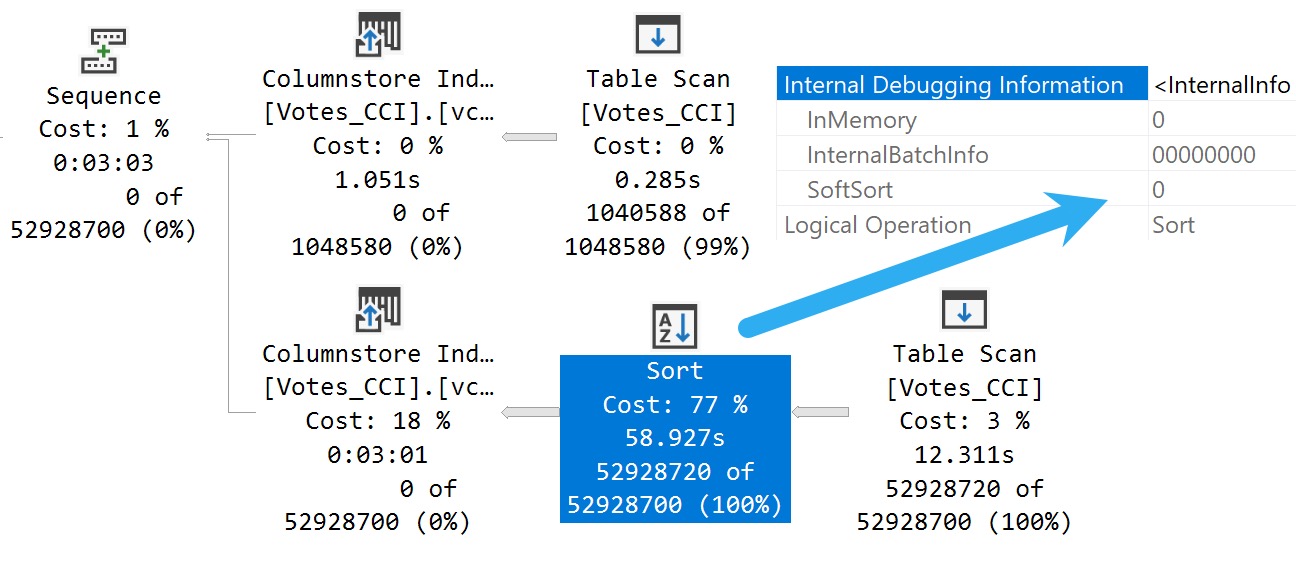
SQL Server Query Plan
community service

That’s why it was a popular maneuver to emulate this behavior by creating a clustered row store index, and then create a clustered column store index over it with drop existing and a MAXDOP 1 hint.

At DOP 1, you don’t see that overlap. It takes a lot longer of course — 3 minutes instead of 30 or so seconds — which is a real bummer. But without it, you could see DOP over lapping rowgroups.

If you want All The Pretty Little Rowgroups, this is what you have to do.

Anyway, the result using sp_BlitzIndex looks a lot better now:

EXEC sp_BlitzIndex
    @TableName = 'Votes_CCI';
SQL Server Query Results
capture the flag

How nice.

You can also use undocumented and unsupported trace flag 11621, which is

[A] feature flag for the ‘partition sort on column store order’ so the end result is similar, but via a different mechanism to 2417.
A partition sort is useful in general to prevent unnecessary switching between partitions. If you sort the stream by partition, you process all the rows for one before moving on to the next. A soft sort is ok there because it’s just a performance optimization. Worst case, you end up switching between partitions quite often because the sort ran out of memory, but correct results will still occur.

Chain Gang


A “reasonable” alternative to trace flags maybe to adjust the index create memory configuration option. If we set it down to the minimum value, we get a “helpful” error message:

EXEC sys.sp_configure 
    'index create memory', 
    704;

RECONFIGURE;

As promised:

Msg 8606, Level 17, State 1, Line 31

This index operation requires 123208 KB of memory per DOP.

The total requirement of 985800 KB for DOP of 8 is greater than the sp_configure value of 704 KB set for the advanced server configuration option “index create memory (KB)”.

Increase this setting or reduce DOP and rerun the query.

If you get the actual execution plan for the clustered column store index create or rebuild with the Soft Sort disabled and look at the memory grant, you get a reasonable estimate for what to set index create memory to.

Changing it does two things:

  • Avoids the very low memory grant that Soft Sorts receive, and causes the uneven row groups
  • The Soft Sort keeps the index create from going above that index create memory number

Setting index create memory for this particular index creation/rebuild to 5,561,824 gets you the nice, even row groups (at MAXDOP 1) that we saw when disabling the Soft Sort entirely.

Bottom line, here is that uneven row groups happen with column store indexes when there’s a:

  • Parallel create/rebuild
  • Low memory grant create/rebuild

If this sort of thing is particularly important to you, you could adjust index create memory to a value that allows the Soft Sort adequate memory.

But that’s a hell of a lot of work, and I hope Microsoft just fixes this in a later build.

Reality Bites


The cute thing here is that, while this syntactical functionality has been available in Azure Cloud Nonsense© for some time, no one uses that, so no one cares.

The bits for this were technically available in SQL Server 2019 as well, but I’m not telling you how to do that. It’s not supported, and bad things might happen if you use it.

I mean, bad things happen in SQL Server 2022 where it’s supported unless you use an undocumented trace flag, but… Uh. I dunno.

This trace flag seems to set things back to how things worked in the Before Times, though, which is probably how they should have stayed.

Thanks for reading!

Going Further


If this is the kind of SQL Server stuff you love learning about, you’ll love my training. I’m offering a 75% discount to my blog readers if you click from here. I’m also available for consulting if you just don’t have time for that and need to solve performance problems quickly.

Considerations For Paging Queries In SQL Server With Batch Mode (Don’t Use OFFSET/FETCH)

First Things First


The first SQL Server blog posts that I ever read while trying to solve a specific problem here these two:

They sort of changed my life a little, despite the author’s aversion to the letter Z. So that’s cool. Can’t have everything.

To this day, though, I see people screw up paging queries in numerous ways.

  • Selecting all the columns in one go
  • Adding in joins when exists will do
  • Sticking a DISTINCT on there just because
  • Thinking a view will solve some problem
  • Piles and piles of UDFs
  • Local variables for TOP or OFFSET/FETCH
  • Not paying attention to indexing

It’s sort of like every other query I see, except with additional complications.

Especially cute for a query slathered in NOLOCK hints is the oft-accompanying concern that “data might change and people might see something weird when they query for the next page”.

Okay, pal. Now you’re concerned.

Modern Love


A while back I recorded a video about using nonclustered column store indexes to improve the performance of paging queries:

While a lot of the details in there are still true, I want to talk about something slightly different today. While nonclustered column store indexes make great data sources for queries with unpredictable search predicates, they’re not strictly necessary to get batch mode anymore.

With SQL Server 2019, you can get batch mode on row store indexes, as long as you’re on Enterprise Edition, and in compatibility level 150.

Deal with it.

The thing is, how you structure your paging queries can definitely hurt your chances of getting that optimization.

Saddened Face


The bummer here is that the paging technique that I learned from Paul’s articles (linked above) doesn’t seem to qualify for batch mode on row store without a column store index in place, so they don’t make the demo cut here.

The good news is that if you’re going to approach this with any degree of hope for performance, you’re gonna be using a column store index anyway.

The two methods we’re going to look at are OFFSET/FETCH and a more traditional ROW_NUMBER query.

As you may have picked up from the title, one will turn out better, and it’s not the OFFSET/FETCH variety. Especially as you get larger, or go deeper into results, it becomes a real boat anchor.

Anyway, let’s examine, as they say in France.

Barfset Wretch


This is the best way of writing this query that I can come up with.

DECLARE 
    @page_number int = 1,
    @page_size int = 1000;

WITH 
    paging AS
(
    SELECT 
        p.Id
    FROM dbo.Posts AS p
    ORDER BY 
        p.LastActivityDate, 
        p.Id 
    OFFSET ((@page_number - 1) * @page_size) 
    ROW FETCH NEXT (@page_size) ROWS ONLY
)
SELECT 
    p.*
FROM paging AS pg
JOIN dbo.Posts AS p
    ON pg.id = p.Id
ORDER BY 
    p.LastActivityDate,
    p.Id
OPTION (RECOMPILE);

Note that the local variables don’t come into play so much here because of the recompile hint.

Still, just to grab 1000 rows, this query takes just about 4 seconds.

SQL Server Query Plan
what took you so long?

This is not so good.

Examine!

Hero Number


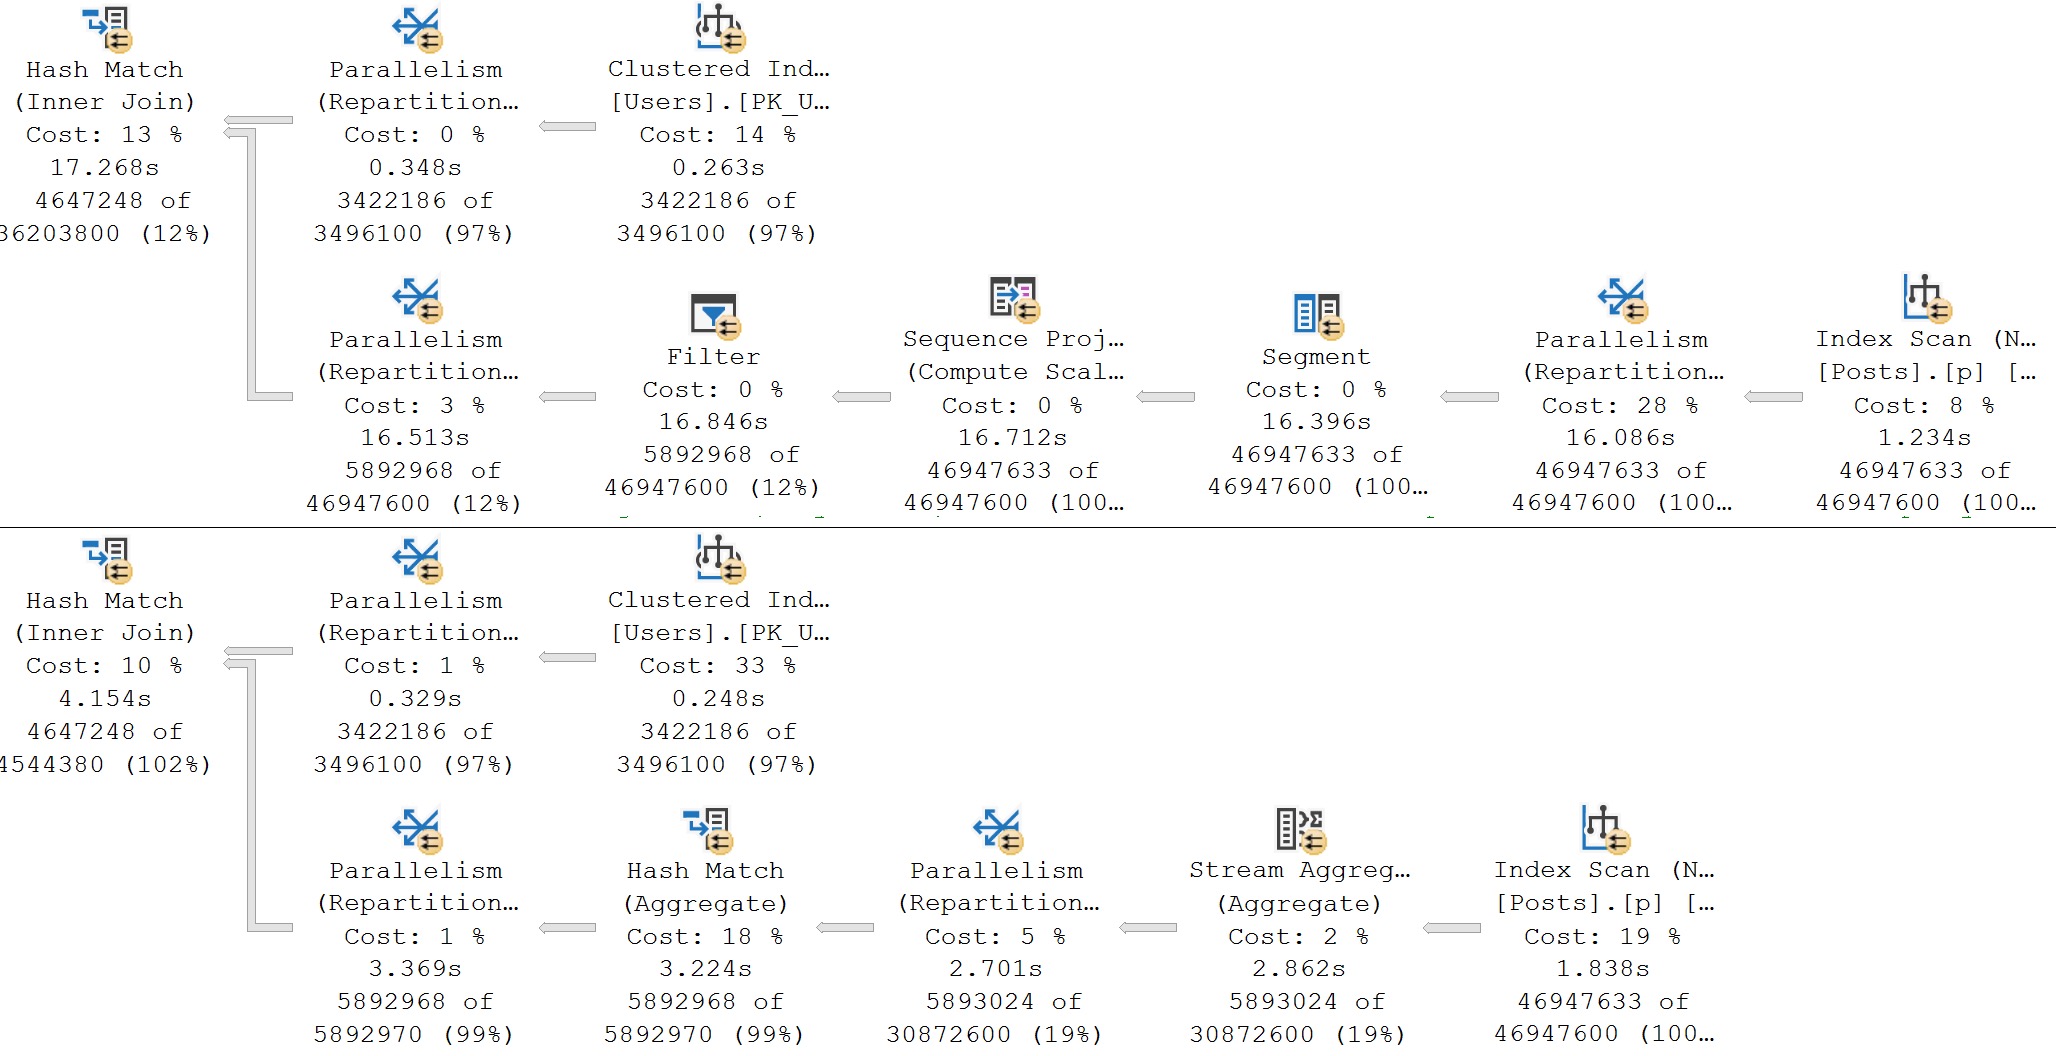
The better-performing query here with the batch mode on row store enhancement(!) is using a single filtered ROW_NUMBER to grab the rows we care about.

DECLARE 
    @page_number int = 1,
    @page_size int = 1000;

WITH 
    fetching AS
(
    SELECT 
        p.Id, 
        n = 
            ROW_NUMBER() OVER 
            ( 
                ORDER BY
                    p.LastActivityDate, 
                    p.Id 
            )
    FROM dbo.Posts AS p
)
SELECT 
    p.*
FROM fetching AS f
JOIN dbo.Posts AS p
    ON f.Id = p.Id
WHERE f.n > ((@page_number - 1) * @page_size)
AND   f.n < ((@page_number * @page_size) + 1)
ORDER BY 
    p.LastActivityDate,
    p.Id
OPTION (RECOMPILE);

Again, this is about the best I can write the query. Maybe you have a better way. Maybe you don’t.

Mine takes a shade under 2 seconds. Twice as fast. Examine!

SQL Server Query Plan
cell tv

I’ll take twice as fast any day of the week.

Compare/Contrast


The OFFSET/FETCH query plan is all in row mode, while the ROW_NUMBER query has batch mode elements.

You can see this by eyeballing the plan: it has a window aggregate operator, and an adaptive join. There are other batch mode operators here, but none have visual cues in the graphical elements of the plan.

This is part of what makes things faster, of course. The differences can be even more profound when you add in the “real life” stuff that paging queries usually require. Filtering, joining, other sorting elements, etc.

Anyway, the point here is that how you write your paging queries from the start can make a big difference in how they end up, performance-wise.

Newer versions of SQL Server where certain behaviors are locked behind heuristics (absent column store indexes being present in some manner) can be especially fickle.

Thanks for reading!
Going Further


If this is the kind of SQL Server stuff you love learning about, you’ll love my training. I’m offering a 75% discount to my blog readers if you click from here. I’m also available for consulting if you just don’t have time for that and need to solve performance problems quickly.

Getting The Top Value Per Group With Multiple Conditions In SQL Server: Row Number vs. Cross Apply With MAX

Throat Music


In yesterday’s post, we compared a simple situation trying to find the post scoring post for each user.

In today’s post, we’re going to add another condition: we want the highest scoring post for each type of post someone has made.

typos

Now look, most people don’t get involved with any of these things, but whatever. It just poses an interesting and slightly more complicated problem.

Slightly Different Index


Since we’re going to be using PostTypeId in the window function, we need it in the key of our index:

CREATE INDEX p ON dbo.Posts(OwnerUserId, PostTypeId, Score DESC)
WITH(SORT_IN_TEMPDB = ON, DATA_COMPRESSION = PAGE);

Now our query looks like this:

SELECT
    u.DisplayName,
    u.Reputation,
    p.PostTypeId,
    p.Score
FROM dbo.Users AS u
JOIN
(
    SELECT
        p.*,
        n = 
            ROW_NUMBER() OVER
            (
                PARTITION BY
                    p.OwnerUserId,
                    p.PostTypeId --This is new!
                ORDER BY
                    p.Score DESC
            )
    FROM dbo.Posts AS p
) AS p
    ON  p.OwnerUserId = u.Id
    AND p.n = 1
WHERE u.Reputation > 50000
ORDER BY 
    u.Reputation DESC,
    p.Score DESC;

S’good? S’good. Let’s go.

Row Number Query Plan


Similar to yesterday’s plan, this one is rather slow, rather serial, and generally not how we want to be spending our precious time.

SQL Server Query Plan
scam

Let’s look at the apply method, because we have to change our query a little bit to accomplish the same thing.

Cross Apply With MAX


Rather than go with TOP (1), we’re going to GROUP BY OwnerUserId and PostTypeId, and get the MAX(Score).

SELECT
    u.DisplayName,
    u.Reputation,
    p.PostTypeId,
    p.Score
FROM dbo.Users AS u
CROSS APPLY
(
    SELECT 
        p.OwnerUserId,
        p.PostTypeId,
        Score = MAX(p.Score)
    FROM dbo.Posts AS p
    WHERE p.OwnerUserId = u.Id
    GROUP BY 
        p.OwnerUserId, 
        p.PostTypeId
) AS p
WHERE u.Reputation > 50000
ORDER BY 
    u.Reputation DESC,
    p.Score DESC;

This will give us the same results, but a lot faster. Again.

Cross Apply Query Plan


Like I was saying…

SQL Server Query Plan
time is extremely valuable

Down to ~400ms now. Not bad, right?

Lower Selectivity


If we take those same queries and lower the reputation filter from 50,000 to 1, some interesting changes to the query plans happen.

SQL Server Query Plan
years ago

Repartition streams and I have had some problems in the past. It’s not necessarily “to blame”, it just has a tough time with some data distributions, especially, it seems, when it’s order preserving.

The cross apply with aggregation works really well. It’s kinda neat that both queries get slower by the same amount of time, but the ROW_NUMBER query is still much, much slower.

All of this is interesting and all, but you know what? We haven’t look at batch mode. Batch mode fixes everything.

Sort of. Don’t quote me on that. It’s just really helpful in the kind of BIG QUERY tuning that I end up doing.

Batch Mode


This is the only thing that makes the ROW_NUMBER query competitive in this scenario, owing to the fact that batch mode often removes Repartition Streams, and we’re eligible for the Window Aggregate operator.

SQL Server Query Plan
further reductions

I’m dumping these results to #temp tables because I don’t want to wait for SSMS to render the large result set, but you can still see the positive overall effect.

The poorly performing ROW_NUMBER query is now very competitive with the CROSS APPLY query.

Thanks for reading!
Going Further


If this is the kind of SQL Server stuff you love learning about, you’ll love my training. I’m offering a 75% discount to my blog readers if you click from here. I’m also available for consulting if you just don’t have time for that and need to solve performance problems quickly.

Getting The Top Value Per Group In SQL Server: Row Number vs. Cross Apply Performance

Introductions


There are many ways to express queries in SQL. How different rewrites perform will largely be a function of:

  • You not doing anything ridiculous
  • Queries having good indexes in place
  • The optimizer not seeing through your tricks and giving you the same query plan

The first rule of rewrites is that they have to produce the same results, of course. Logical equivalency is tough.

In today and tomorrow’s posts I’m going to compare a couple different scenarios to get the top value.

There are additional ways to rewrite queries like this, of course, but I’m going to show you the most common anti-pattern I see, and the most common solution that tends to work better.

Right And Proper Indexing


For today’s post, we’re going to use this index:

CREATE INDEX p ON dbo.Posts(OwnerUserId, Score DESC) INCLUDE(PostTypeId)
WITH(SORT_IN_TEMPDB = ON, DATA_COMPRESSION = PAGE);

Which is going to give this query proper support. Sure, we could also add an index to the Users table, but the one scan is trivially fast, and probably not worth it here.

SELECT
    u.DisplayName,
    u.Reputation,
    p.PostTypeId,
    p.Score
FROM dbo.Users AS u
JOIN
(
    SELECT
        p.*,
        n = 
            ROW_NUMBER() OVER
            (
                PARTITION BY
                    p.OwnerUserId
                ORDER BY
                    p.Score DESC
            )
    FROM dbo.Posts AS p
) AS p
    ON  p.OwnerUserId = u.Id
    AND p.n = 1
WHERE u.Reputation > 50000
ORDER BY 
    u.Reputation DESC,
    p.Score DESC;

The general idea is to find all users with a reputation over 50,000, along with their highest scoring post.

I know, you’re looking at this and thinking “jeez Erik, why are you selecting * here? don’t you know how bad and dumb you are for that?”

Well, SQL Server is smart enough to ignore that and only deal with the columns in the outer select.

The Query Plan


If you create the index and run this, the query plan looks something like this:

SQL Server Query Plan
pity

The majority of the time spent in this plan is the ~11 seconds between the scan of the Posts table and the Filter operator.

The filter is there to remove rows where the result of the ROW_NUMBER function are greater than 1.

I guess you could say less than 1, too, but ROW_NUMBER won’t produce rows with 0 or negative numbers naturally. You have to make that happen by subtracting.

A Better Query Pattern?


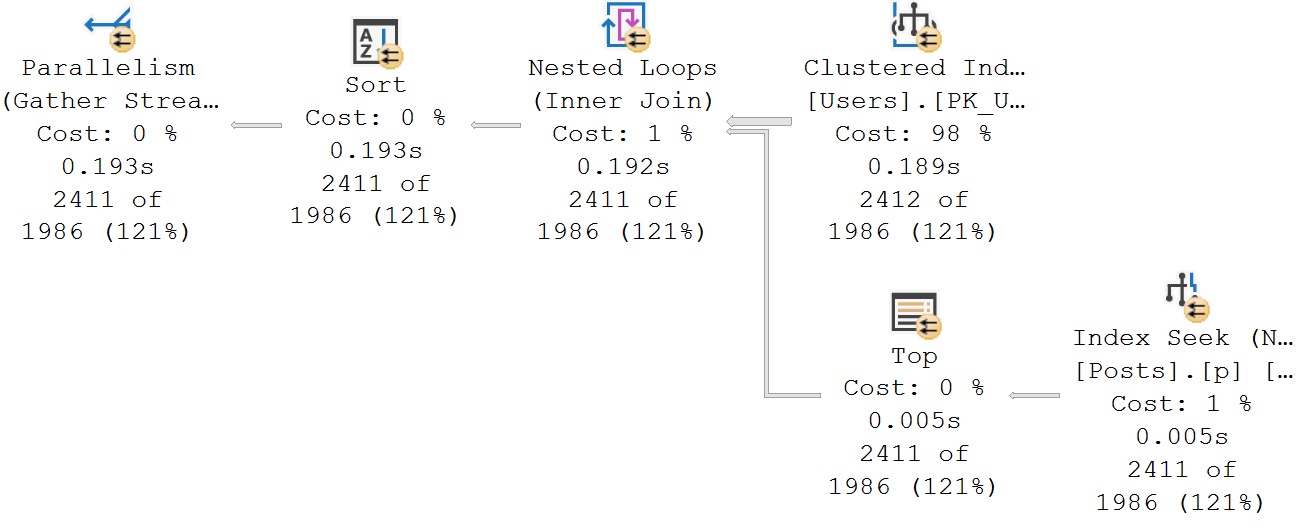
Since only ~2400 rows are leaving the Users table, and we have a good index on the Posts table, we want to take advantage of it.

Rather than scan the entire Posts table, generate the ROW_NUMBER, apply the filter, then do the join, we can use CROSS APPLY to push things down to where we touch the Posts table.

SELECT
    u.DisplayName,
    u.Reputation,
    p.PostTypeId,
    p.Score
FROM dbo.Users AS u
CROSS APPLY
(
    SELECT TOP (1)
        p.*
    FROM dbo.Posts AS p
    WHERE p.OwnerUserId = u.Id
    ORDER BY p.Score DESC
) AS p
WHERE u.Reputation > 50000
ORDER BY 
    u.Reputation DESC,
    p.Score DESC;

This is logically equivalent, but it blows the other query out of the water, performance-wise.

A Better Query Plan?


Here’s the query plan for the cross apply query:

SQL Server Query Plan
nice nice

Why Is This better?


In this case, having a good index to use, and a small outer result from the Users table, the cross apply query is way better.

This is also due to the Id column of Users being the Primary Key of the table. For this sort of one to many join, it works beautifully. If it were a many to many scenario, it could be a toss up, or ROW_NUMBER could blow it out of the water.

The way this type of Nested Loops Join works (Apply Nested Loops), is to take each row from the outer input (Users table) and seek to it in the Posts table.

Without that good index up here, this would likely be a disaster with an Eager Index Spool in the plan. We definitely don’t want that, here.

But you know, there are many different types of posts. We might want to know someone’s high score for questions, answers, and more.

In tomorrow’s post, we’ll look at how to do that, and performance tune the query.

Thanks for reading!
Going Further


If this is the kind of SQL Server stuff you love learning about, you’ll love my training. I’m offering a 75% discount to my blog readers if you click from here. I’m also available for consulting if you just don’t have time for that and need to solve performance problems quickly.

Using Batch Mode for the “Matching Supply With Demand” Challenge

Itzik Ben-Gan posted an interesting T-SQL challenge on SQL performance dot com. I’m writing up my solution in my own blog post because I have a lot to say and getting code formatting right can be tricky in blog post comments. For reference, my test machine is using SQL Server 2019 CU14 with an i7-9700K CPU @ 3.60 GHz processor. The baseline cursor solution completes in 8465 ms on my machine.

Running Totals

A simple way to solve this problem is to calculate running totals of quantity separately for supply and demand, treat the resulting rows as intervals, and find the intersections between supply and demand intervals. It is fairly straightforward and fast to calculate the interval start and end points and load them into temp tables, so I’ll omit that code for now. We can find the intersecting intervals with the query below( which you should not run):

SELECT d.ID DemandId, s.ID as SupplyID,
CASE
WHEN d.IntervalEnd >= s.IntervalEnd THEN s.IntervalEnd - CASE WHEN s.IntervalStart >= d.IntervalStart THEN s.IntervalStart ELSE d.IntervalStart END
ELSE d.IntervalEnd - CASE WHEN s.IntervalStart >= d.IntervalStart THEN s.IntervalStart ELSE d.IntervalStart END
END TradeQuantity
FROM #demand_intervals d
CROSS JOIN #supply_intervals s
WHERE d.IntervalEnd > s.IntervalStart AND d.IntervalStart < s.IntervalEnd
OPTION (QueryRuleOff BuildSpool);

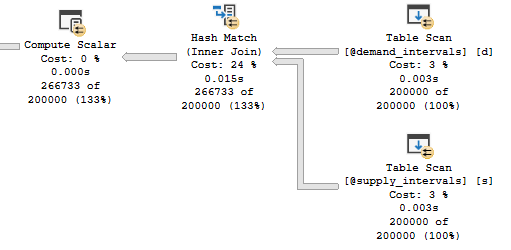
Performance is terrible for this query because there is no possible index that will make that join condition fast. The query takes 955 seconds of CPU time and 134 seconds of elapsed time at MAXDOP 8.

This blog post is about batch mode, so we need to turn that nested loop join into a hash join. It is important to recall that a hash join requires at least one equality condition in the join clause.

Exploring the Data

It’s important to Know Your Data while query writing, especially if you want to cheat in a performance competition. Taking a quick look at the Auctions table with the 400k row configuration:

The things that stand out to me are that there are an equal number of supply and demand rows, both supply and demand have nearly the same average value, and the maximum quantity for both supply and demand is under 100. We can exploit the relatively low maximum quantity value to improve performance. A supply interval with a end point that is more than 100 units away from the demand end point cannot possibly intersect it. This is one of those things that feels intuitively correct, but I’ll go ahead and prove it anyway by contradiction.

Suppose that 100 is the maximum interval length, [d_start, d_end] and [s_start, s_end] overlap, s_end is more than 100 units away from d_end.

  1. The distance between end points implies that d_end < s_end – 100
  2. If they overlap, then s_start < d_end
  3. This implies that s_start < d_end < s_end – 100
  4. This implies that s_start < s_end – 100
  5. This implies that s_end – s_start > 100

The final statement is impossible because 100 is the maximum interval length. You can do the same proof in the other direction. Therefore, it should be safe to add some filters to our original query:

SELECT d.ID DemandId, s.ID as SupplyID,
CASE
WHEN d.IntervalEnd >= s.IntervalEnd THEN s.IntervalEnd - CASE WHEN s.IntervalStart >= d.IntervalStart THEN s.IntervalStart ELSE d.IntervalStart END
ELSE d.IntervalEnd - CASE WHEN s.IntervalStart >= d.IntervalStart THEN s.IntervalStart ELSE d.IntervalStart END
END TradeQuantity
FROM #demand_intervals d WITH (TABLOCK)
CROSS JOIN #supply_intervals s WITH (TABLOCK)
WHERE d.IntervalEnd > s.IntervalStart AND d.IntervalStart < s.IntervalEnd
AND s.IntervalEnd >= d.IntervalEnd - 100
AND s.IntervalEnd <= d.IntervalEnd + 100;

Now we can get a proper index seek on the s.IntervalEnd column. Performance is significantly better with this additional filter clause. The total runtimes for all steps, including the omitted temp table creation, are 1030 ms of CPU time and 345 ms of elapsed time. We are of course not using batch mode though:

Buckets

Time for more math. Starting with the following filter conditions:

AND s.IntervalEnd >= d.IntervalEnd – 100
AND s.IntervalEnd <= d.IntervalEnd + 100;

I can divide both sides by 100 and the condition will still be true:

AND s.IntervalEnd / 100 >= d.IntervalEnd / 100 – 1
AND s.IntervalEnd / 100 <= d.IntervalEnd / 100 + 1

You’ll have to take my word for it that the equation is still true if we truncate everything down to integers:

AND FLOOR(s.IntervalEnd / 100) >= FLOOR(d.IntervalEnd / 100) – 1
AND FLOOR(s.IntervalEnd / 100) <= FLOOR(d.IntervalEnd / 100) + 1

Now we’re dealing with integers, so we can express this as the following:

FLOOR(s.IntervalEnd / 100) IN (FLOOR(d.IntervalEnd / 100) – 1, FLOOR(d.IntervalEnd / 100) + 0, FLOOR(d.IntervalEnd / 100) + 1)

Rewriting once again:

FLOOR(s.IntervalEnd / 100) = FLOOR(d.IntervalEnd / 100) – 1
OR FLOOR(s.IntervalEnd / 100) = FLOOR(d.IntervalEnd / 100) + 0
OR FLOOR(s.IntervalEnd / 100) = FLOOR(d.IntervalEnd / 100) + 1

That’s still not eligible for a hash join, but it is if we change it to a UNION ALL:

... JOIN ON ...
FLOOR(s.IntervalEnd / 100) = FLOOR(d.IntervalEnd / 100) - 1

UNION ALL

... JOIN ON ...
FLOOR(s.IntervalEnd / 100) = FLOOR(d.IntervalEnd / 100) + 0

UNION ALL

... JOIN ON ...
FLOOR(s.IntervalEnd / 100) = FLOOR(d.IntervalEnd / 100) + 1

We have successfully transformed a single BETWEEN join filter into three joins with equality filters. All three of those joins are eligible for batch mode.

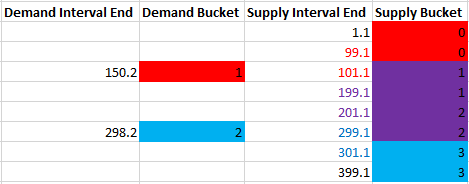
A visual representation may be helpful. Suppose we have two demand intervals that end in 150.2 and 298.2. We need to match those intervals with 8 supply intervals with end points that range from 1.1 to 399.1. To do so, we can divide the intervals into buckets of 100 width and join on matching bucket values as well as the immediately adjacent bucket values:

The demand interval that ends in 150.2 has a bucket value of 1, so it is matched with supply buckets 0, 1, and 2. In this way, we can guarantee that any supply interval that’s 100 or fewer units away ends up getting matched with the right demand intervals. The supply buckets with a background of red are only matched to the demand interval of 150.2, blue is only matched to the demand interval of 298.2, and purple is matched to both. The buckets are overly inclusive of course. The actual rows that might match based on distance have their font color changed in the same way, but filtering out extra rows later will be no problem. The important thing is that we have an equality condition to work with. Now that we can finally perform hash joins, it’s time to work out all of the details.

Gotta Go Fast

We need to perform three operations:

  1. Calculate the maximum interval length.
  2. Calculate running totals for supply and demand, their bucket values, and load them into temporary objects.
  3. Query the temp tables to load the final results into another table.

For step 1, we simply need an index on the Quantity column to make the query fast. We also need to get an exclusive lock and hold it until we’re finished with all of the steps. Otherwise the max length could change in the middle of our code’s execution.

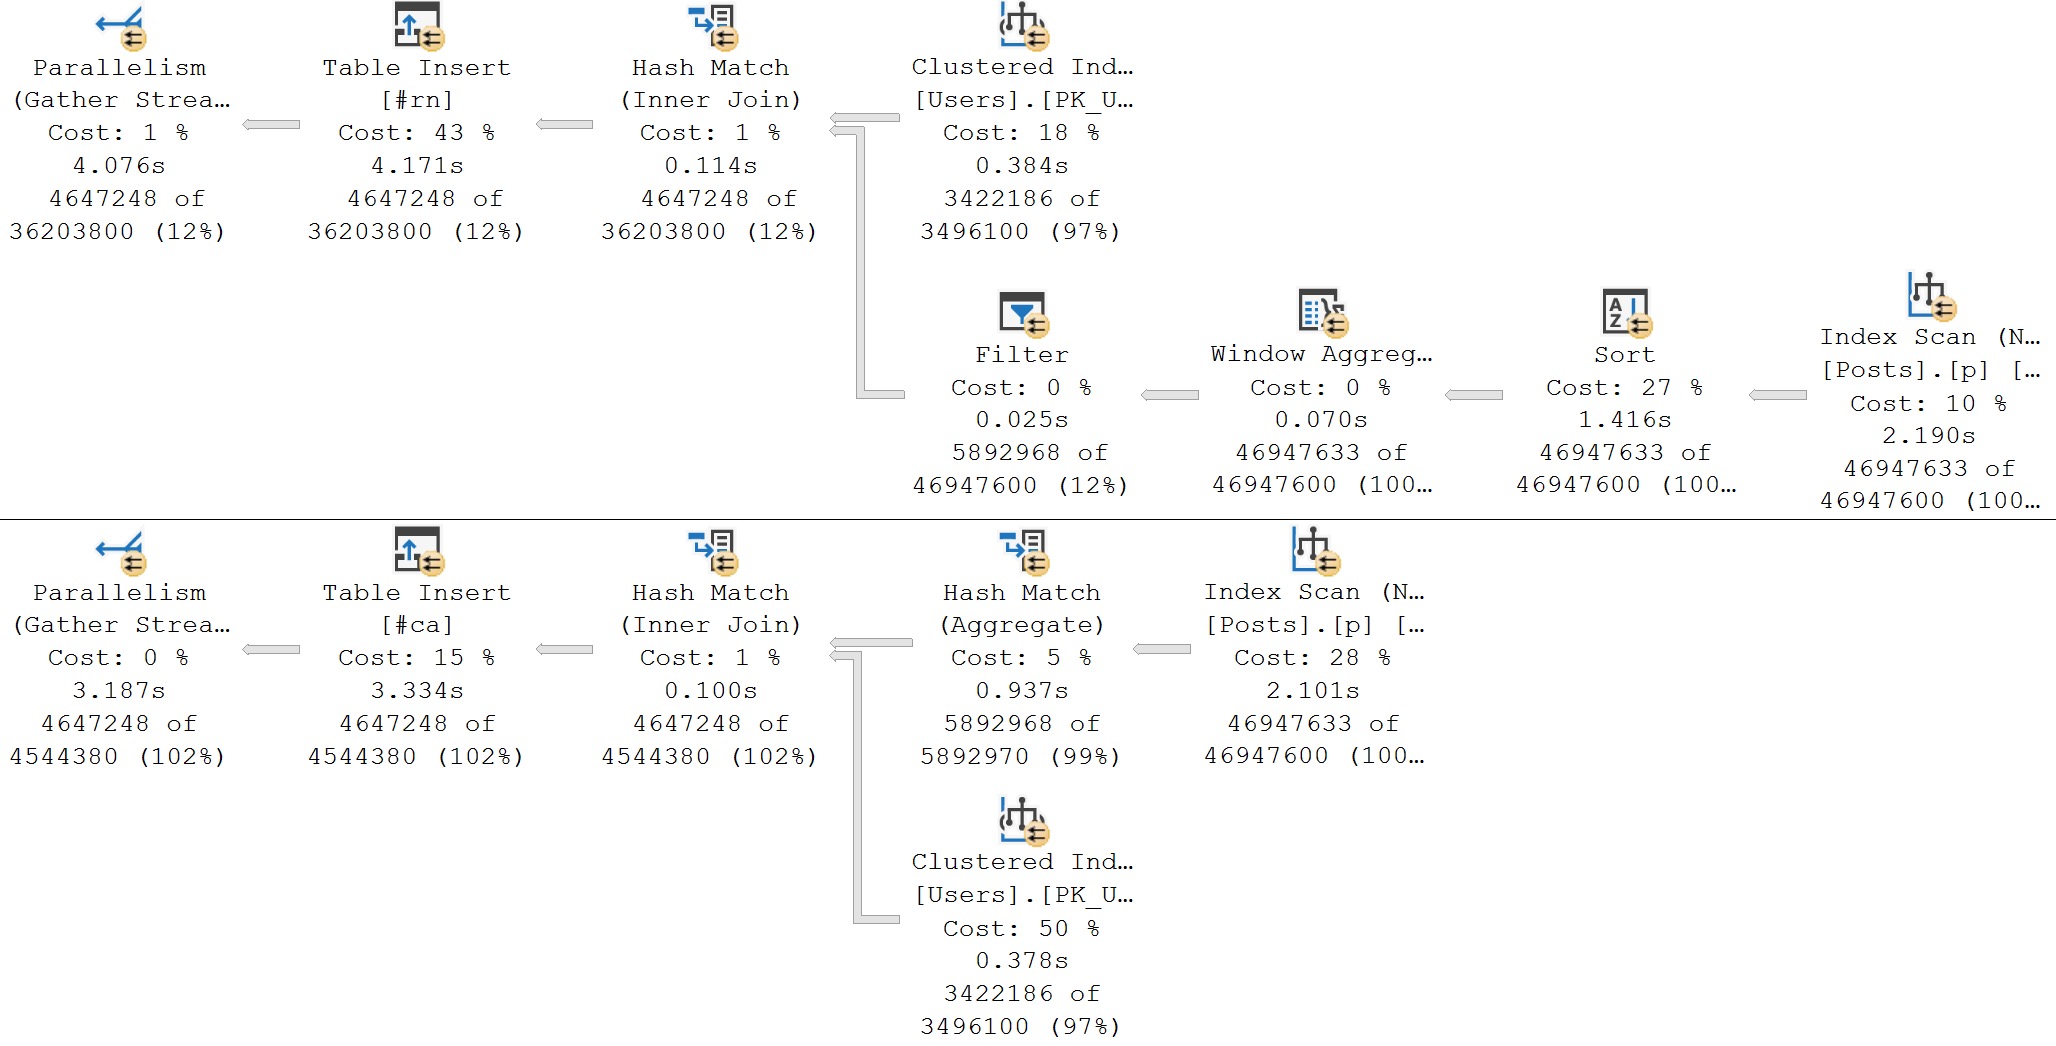
For step 2, the best performing options are either a MAXDOP 1 query with an ordered index scan and a batch mode window aggregate or a parallel query with a batch mode sort, parallel batch mode window aggregate, and parallel insert. An NCCI on the Auctions table is helpful in getting batch mode. In order to make the code go as fast as possible, I elected to use the parallel option at MAXDOP 4 even though it uses significantly more CPU time than the MAXDOP 1 option. DOP is at 4 instead of 8 due to contention caused by the NESTING_TRANSACTION_FULL latch. Here’s an estimated plan picture in case you don’t know what I mean by all of that:

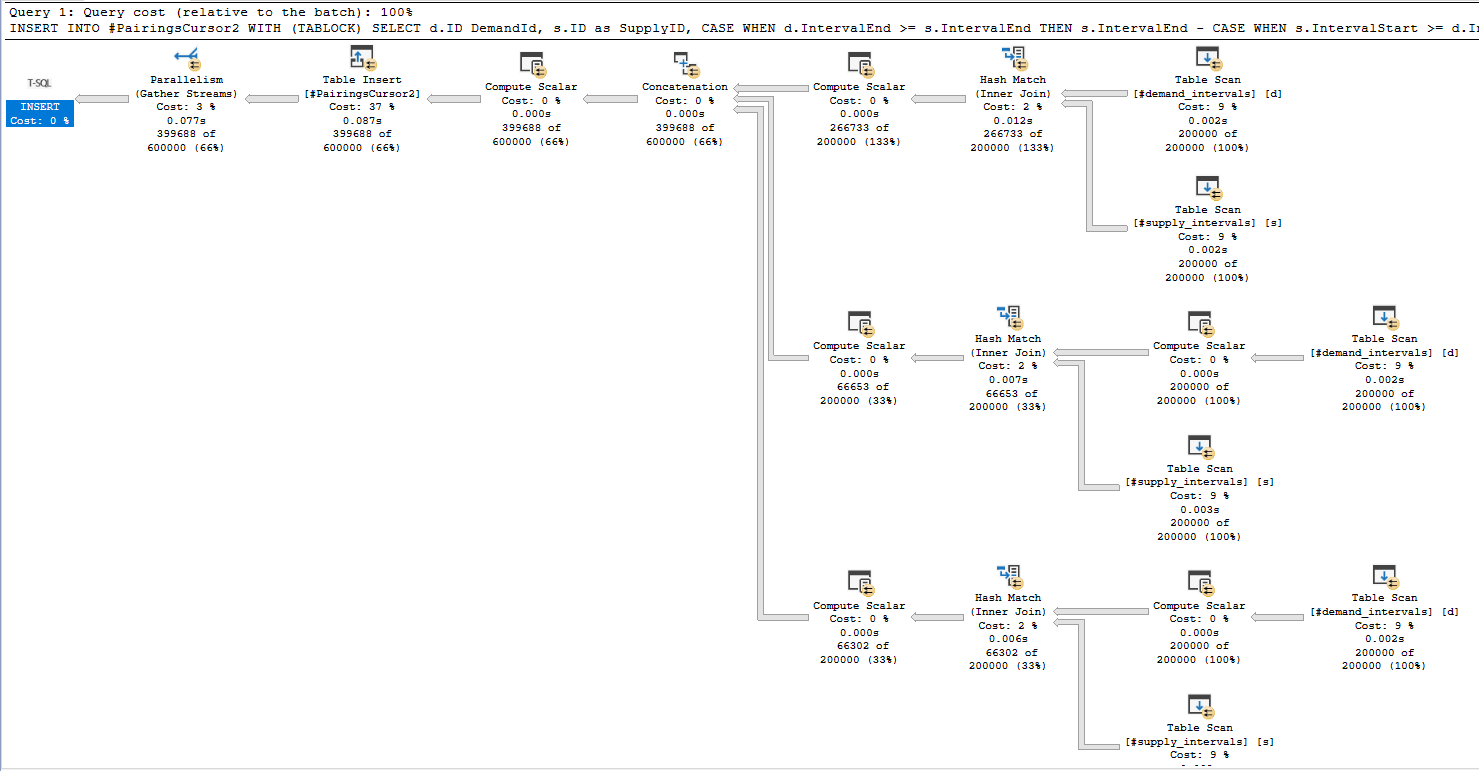
For the third query, I’m using a UNION ALL of 3 joins that are eligible for batch mode like I said earlier. I added some query hints to reduce compile time.

As a step 0 that I forgot to mention earlier, create the following indexes on the Auctions table:

CREATE INDEX IX_Auctions__Code_ID__INCLUDE_Quantity ON Auctions (Code, ID) INCLUDE (Quantity);

CREATE INDEX IX_Auctions__Quantity ON Auctions (Quantity);

CREATE NONCLUSTERED COLUMNSTORE INDEX NCCI_Auctions ON Auctions (Code) with (MAXDOP = 1);

You can find the full code below for all three steps:

SET NOCOUNT ON;

DROP TABLE IF EXISTS #PairingsCursor2;
CREATE TABLE #PairingsCursor2
(
DemandID INT NOT NULL,
SupplyID INT NOT NULL,
TradeQuantity DECIMAL(19, 6) NOT NULL
);

DROP TABLE IF EXISTS #demand_intervals;
CREATE TABLE #demand_intervals (
ID INT NOT NULL,
IntervalStart DECIMAL(19, 6) NOT NULL,
IntervalEnd DECIMAL(19, 6) NOT NULL,
IntervalBucket BIGINT NOT NULL
);

DROP TABLE IF EXISTS #supply_intervals;
CREATE TABLE #supply_intervals (
ID INT NOT NULL,
IntervalStart DECIMAL(19, 6) NOT NULL,
IntervalEnd DECIMAL(19, 6) NOT NULL,
IntervalBucket BIGINT NOT NULL
);

DECLARE @MaxQuantityRange DECIMAL(19, 6);

BEGIN TRANSACTION;

SELECT @MaxQuantityRange = MAX(Quantity) - MIN(Quantity)
FROM Auctions WITH (TABLOCKX);

INSERT INTO #demand_intervals WITH (TABLOCK)
SELECT ID, rt - Quantity IntervalStart, rt IntervalEnd, CAST(rt / @MaxQuantityRange AS BIGINT) AS IntervalBucket
FROM
(
SELECT a.ID, Quantity, SUM(Quantity) OVER (ORDER BY a.ID ROWS BETWEEN UNBOUNDED PRECEDING AND CURRENT ROW) rt
FROM dbo.Auctions a WITH (TABLOCK)
WHERE Code = 'D'
) q
OPTION (USE HINT('ENABLE_PARALLEL_PLAN_PREFERENCE'), MAXDOP 4);

INSERT INTO #supply_intervals WITH (TABLOCK)
SELECT ID, rt - Quantity IntervalStart, rt IntervalEnd, CAST(rt / @MaxQuantityRange AS BIGINT) AS IntervalBucket
FROM
(
SELECT a.ID, Quantity, SUM(Quantity) OVER (ORDER BY a.ID ROWS BETWEEN UNBOUNDED PRECEDING AND CURRENT ROW) rt
FROM dbo.Auctions a WITH (TABLOCK)
WHERE Code = 'S'
) q
OPTION (USE HINT('ENABLE_PARALLEL_PLAN_PREFERENCE'), MAXDOP 4);

/*
-- prevents temp table caching, slight performance overhead in last query, but avoids "expensive" stats gathering for uncached object scenario
CREATE STATISTICS s0 ON #demand_intervals (IntervalBucket) WITH SAMPLE 0 ROWS;
CREATE STATISTICS s1 ON #supply_intervals (IntervalBucket) WITH SAMPLE 0 ROWS;
*/

INSERT INTO #PairingsCursor2 WITH (TABLOCK)
SELECT d.ID DemandId, s.ID as SupplyID,
CASE
WHEN d.IntervalEnd >= s.IntervalEnd THEN s.IntervalEnd - CASE WHEN s.IntervalStart >= d.IntervalStart THEN s.IntervalStart ELSE d.IntervalStart END
ELSE d.IntervalEnd - CASE WHEN s.IntervalStart >= d.IntervalStart THEN s.IntervalStart ELSE d.IntervalStart END
END TradeQuantity
FROM #demand_intervals d WITH (TABLOCK)
INNER JOIN #supply_intervals s WITH (TABLOCK) ON d.IntervalBucket = s.IntervalBucket
WHERE d.IntervalEnd > s.IntervalStart AND d.IntervalStart < s.IntervalEnd

UNION ALL

SELECT d.ID DemandId, s.ID as SupplyID, CASE WHEN d.IntervalEnd >= s.IntervalEnd THEN s.IntervalEnd - CASE WHEN s.IntervalStart >= d.IntervalStart THEN s.IntervalStart ELSE d.IntervalStart END
ELSE d.IntervalEnd - CASE WHEN s.IntervalStart >= d.IntervalStart THEN s.IntervalStart ELSE d.IntervalStart END
END TradeQuantity
FROM #demand_intervals d WITH (TABLOCK)
INNER JOIN #supply_intervals s WITH (TABLOCK) ON s.IntervalBucket = d.IntervalBucket - 1
WHERE d.IntervalEnd > s.IntervalStart AND d.IntervalStart < s.IntervalEnd

UNION ALL

SELECT d.ID DemandId, s.ID as SupplyID, CASE WHEN d.IntervalEnd >= s.IntervalEnd THEN s.IntervalEnd - CASE WHEN s.IntervalStart >= d.IntervalStart THEN s.IntervalStart ELSE d.IntervalStart END
ELSE d.IntervalEnd - CASE WHEN s.IntervalStart >= d.IntervalStart THEN s.IntervalStart ELSE d.IntervalStart END
END TradeQuantity
FROM #demand_intervals d WITH (TABLOCK)
INNER JOIN #supply_intervals s WITH (TABLOCK) ON s.IntervalBucket = d.IntervalBucket + 1
WHERE d.IntervalEnd > s.IntervalStart AND d.IntervalStart < s.IntervalEnd
OPTION (USE HINT('ENABLE_PARALLEL_PLAN_PREFERENCE'), MAXDOP 8, HASH JOIN, CONCAT UNION, FORCE ORDER, NO_PERFORMANCE_SPOOL); -- reduce compile time

COMMIT TRANSACTION;

For the first execution, CPU time is generally around 1245 ms and elapsed time is around 500 ms. For subsequent executions, CPU time is around 634 ms and elapsed time is around 168 ms. Here is an actual execution plan for step 3:

Not surprisingly, the join for matching buckets returns significantly more rows than the joins for adjacent buckets.

REEEEEEEEEEEEECOMPILES

You may be wondering why the first execution takes so much longer than subsequent executions. The problem is the creation of temp table statistics. For some reason, SQL Server issues four StatMan queries per statistic that it creates:

Some of them run at MAXDOP 1 and some of them run at MAXDOP 8 and all of that time adds up. After the first execution the creation of statistics no longer happens, I assume due to statistics caching for temporary tables. Even adding an explicit FULLSCAN create statistics statement doesn’t avoid this problem for some reason. You can create 0 row statistics if you like (see the commented out code), but I’m going to declare a moral victory here instead of digging into it further. If the biggest performance problem for your query is statistics creation on a pair of 200k row temp tables then you probably have pretty efficient code.

With that said, table variables are an interesting alternative here. I get consistent runtimes of 550 CPU ms and 230 ms of elapsed time using table variables. The deferred compilation feature introduced in SQL Server 2019 is important to get the right query plan. We lose a bit of runtime for the MAXDOP 1 table variable inserts and the final insert is slightly less efficient as well due to the missing statistics. Still, the runtimes are consistent between the first and second executions and overall CPU usage is down. Also you have to admit that seeing a batch mode table variable scan with a correct cardinality estimate (without RECOMPILE) is pretty cool:

Query Scaling

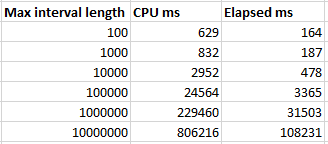
The performance of the batch mode query greatly depends on the maximum interval length. Query runtime increases in a roughly linear fashion as the max length increases:

The linear pattern is broken for the final test case because all of the rows are in a single bucket at that point, so two out of three of the joins don’t do much of anything. Is this type of query safe to use in production? Sure, as long as you’re okay with significantly worse performance if a single outlier row happens to appear. Possible defenses against that include additional constraints on the data, knowing your data well, or writing a fallback algorithm if the maximum interval length is too long for the batch mode bucketizing approach to perform well.

Final Thoughts

This blog post shows how batch mode hash joins can be used as an efficient solution to find intersecting intervals, provided that the maximum interval length is sufficiently small. The important thing is everyone involved had fun. Thanks for reading!

Signs You Need Batch Mode To Make Your SQL Server Queries Faster

My Name Is


I speak with a lot of DBAs and developers who have either heard nothing about column store and batch mode, or they’ve only heard the bare minimum and aren’t sure where it can help them.

Here’s a short list of reasons I usually talk through with people.

Your Reporting Queries Hit Big Tables

The bigger your tables get, the more likely you are to benefit, especially if the queries are unpredictable in nature. If you let people write their own, or design their own reports, nonclustered column store can be a good replacement for nonclustered row store indexes that were created specifically for reporting queries.

In row store indexes, index key column order matters quite a bit. That’s not so much the case with column store. That makes them an ideal data source for queries, since they can scan and select from column independently.

Your Predicates Aren’t Always Very Selective

Picture the opposite of OLTP. Picture queries that collect large quantities of data and (usually) aggregate it down. Those are the ones that get along well with column store indexes and batch mode.

If most of your queries grab and pass around a couple thousand rows, you’re not likely to see a lot of benefit, here. You wanna target the ones with the big arrows in query plans.

Your Main Waits Are I/O And CPU

If you have a bunch of waits on blocking or something, this isn’t going to be your solve.

When your main waits are CPU, it could indicate that queries are overall CPU-bound. Batch mode is useful here, because for those “big” queries, you’re passing millions of rows around and making SQL Server send each one to CPU registers. Under batch mode, you can send up to 900 at a time. Just not in Standard Edition.

When your main waits are on I/O — reading pages from disk specifically — column store can be useful because of the compression they offer. It’s easy to visualize reading more compact structures being faster, especially when you throw in segment and column elimination.

Your Query Plans Have Some Bad Choices In Them

SQL Server 2019 (Enterprise Edition) introduced Batch Mode On Row Store, which let the optimizer heuristically select queries for Batch Mode execution. With that, you get some cool unlocks that you used to have to trick the optimizer into before 2019, like adaptive joins, memory grant feedback, etc.

While those things don’t solve every single performance issue, they can certainly help by letting SQL Server be a little more flexible with plan choices and attributes.

The Optimizer Keeps Choosing Cockamamie Parallel Sort Merge Plans That Make No Sense And Force You To Use Hash Join Hints All The Time

🤦‍♂️

Thanks for reading!

Going Further


If this is the kind of SQL Server stuff you love learning about, you’ll love my training. I’m offering a 75% discount to my blog readers if you click from here. I’m also available for consulting if you just don’t have time for that and need to solve performance problems quickly.

How Useful Is Column Store Indexing In SQL Server Standard Edition?

Speed Limit


When I’m blogging about performance tuning, most of it is from the perspective of Enterprise Edition. That’s where you need to be if you’re serious about getting SQL Server to go as fast as possible. Between the unrealistic memory limits and other feature restrictions, Standard Edition just doesn’t hold up.

Sure, you can probably get by with it for a while, but once performance becomes a primary concern it’s time to fork over an additional 5k a core for the big boat.

They don’t call it Standard Edition because it’s The Standard, like the hotel. Standard is a funny word like that. It can denote either high or low standing through clever placement of “the”.  Let’s try an experiment:

  • Erik’s blogging is standard for technical writing
  • Erik’s blogging is the standard for technical writing

Now you see where you stand with standard edition. Not with “the”, that’s for sure. “The” has left the building.

Nerd Juice


A lot of the restrictions for column store in Standard Edition are documented, but:

  • DOP limit of two for queries
  • No parallelism for creating or rebuilding indexes
  • No aggregate pushdown
  • No string predicate pushdown
  • No SIMD support

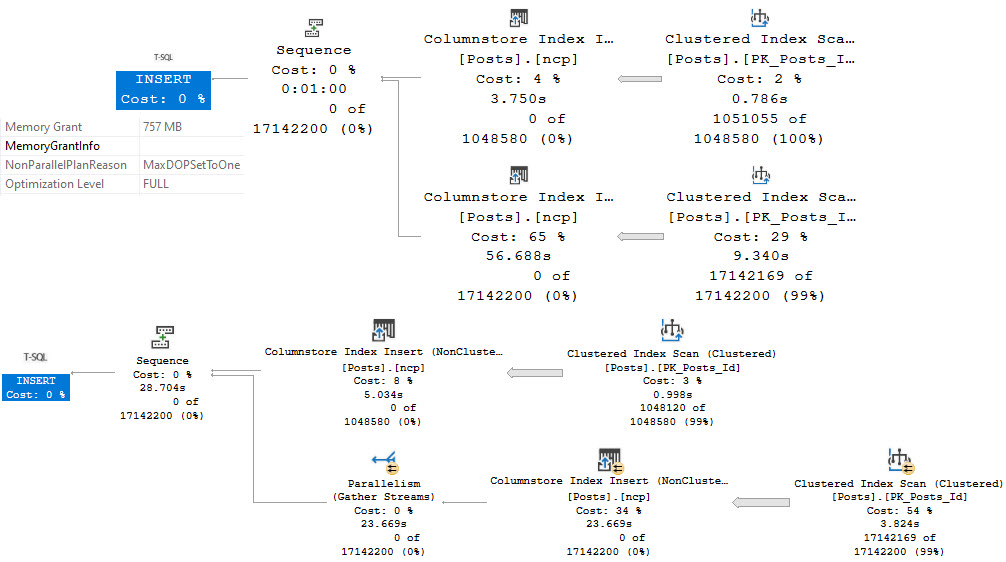
Here’s a comparison for creating a nonclustered column store index in Standard and Enterprise/Developer Editions:

SQL Server Query Plan
your fly is down

The top plan is from Standard Edition, and runs for a minute in a full serial plan. There is a non-parallel plan reason in the operator properties: MaxDOPSetToOne.

I do not have DOP set to one anywhere, that’s just the restriction kicking in. You can try it out for yourself if you have Standard Edition sitting around somewhere. I’m doing all my testing on SQL Server 2019 CU9. This is not ancient technology at the time of writing.

The bottom plan is from Enterprise/Developer Edition, where the the plan is able to run partially in parallel, and takes 28 seconds (about half the time as the serial plan).

Query Matters


One of my favorite query tuning tricks is getting batch mode to happen on queries that process a lot of rows. It doesn’t always help, but it’s almost always worth trying.

The problem is that on Standard Edition, if you’re processing a lot of rows, being limited to a DOP of 2 can be a real hobbler. In many practical cases, a batch mode query at DOP 2 will end up around the same as a row mode query at DOP 8. It’s pretty unfortunate.

In some cases, it can end up being much worse.

SELECT 
    MIN(p.Id) AS TinyId,
    COUNT_BIG(*) AS records
FROM dbo.Posts AS p WITH(INDEX = ncp)
JOIN dbo.Votes AS v
    ON p.Id = v.PostId
WHERE p. OwnerUserId = 22656;

SELECT 
    MIN(p.Id) AS TinyId,
    COUNT_BIG(*) AS records
FROM dbo.Posts AS p WITH(INDEX = 1)
JOIN dbo.Votes AS v
    ON p.Id = v.PostId
WHERE p. OwnerUserId = 22656;

Here’s the query plan for the first one, which uses the nonclustered column store index on Posts. There is no hint or setting that’s keeping DOP at 2, this really is just a feature restriction.

SQL Server Query Plan
drop it like it’s dop

Higher Ground


The second query, which is limited by the MAXDOP setting to 8, turns out much faster. The batch mode query takes 3.8 seconds, and the row mode query takes 1.4 seconds.

SQL Server Query Plan
it’s a new craze

In Enterprise Edition, there are other considerations for getting batch mode going, like memory grant feedback or adaptive joins, but those aren’t available in Standard Edition.

In a word, that sucks.

Dumb Limit


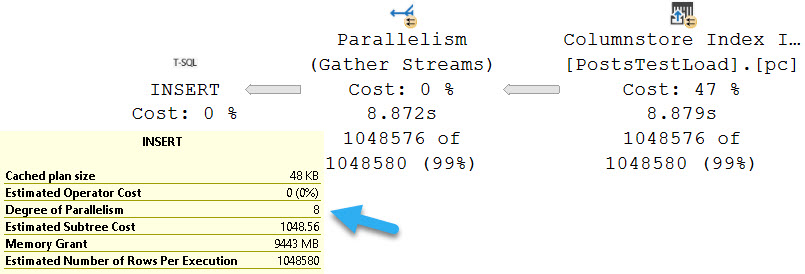
The restrictions on creating and rebuilding column store indexes to DOP 1 (both clustered and nonclustered), and queries to DOP 2 all seems even more odd when we consider that there is no restriction on inserting data into a table with a column store index on it.

As an example:

SELECT 
    p.*
INTO dbo.PostsTestLoad
FROM dbo.Posts AS p
WHERE 1 = 0;

CREATE CLUSTERED COLUMNSTORE INDEX pc ON dbo.PostsTestLoad;

SET IDENTITY_INSERT dbo.PostsTestLoad ON;

INSERT dbo.PostsTestLoad WITH(TABLOCK)
(
    Id, AcceptedAnswerId, AnswerCount, Body, ClosedDate, 
    CommentCount, CommunityOwnedDate, CreationDate, 
    FavoriteCount, LastActivityDate, LastEditDate, 
    LastEditorDisplayName, LastEditorUserId, OwnerUserId, 
    ParentId, PostTypeId, Score, Tags, Title, ViewCount 
)
SELECT TOP (1024 * 1024)
    p.Id, p.AcceptedAnswerId, p.AnswerCount, p.Body, p.ClosedDate, p.
    CommentCount, p.CommunityOwnedDate, p.CreationDate, p.
    FavoriteCount, p.LastActivityDate, p.LastEditDate, p.
    LastEditorDisplayName, p.LastEditorUserId, p.OwnerUserId, p.
    ParentId, p.PostTypeId, p.Score, p.Tags, p.Title, p.ViewCount 
FROM dbo.Posts AS p;

SET IDENTITY_INSERT dbo.PostsTestLoad OFF;
SQL Server Query Plan
smells like dop spirit

Unsupportive Parents


These limits are asinine, plain and simple, and I hope at some point they’re reconsidered. While I don’t expect everything from Standard Edition, because it is Basic Cable Edition, I do think that some of the restrictions go way too far.

Perhaps an edition somewhere between Standard and Enterprise would make sense. When you line the two up, the available features and pricing are incredibly stark choices.

There are often mixed needs as well, where some people need Standard Edition with fewer HA restrictions, and some people need it with fewer performance restrictions.

Thanks for reading!
Going Further


If this is the kind of SQL Server stuff you love learning about, you’ll love my training. I’m offering a 75% discount to my blog readers if you click from here. I’m also available for consulting if you just don’t have time for that and need to solve performance problems quickly.

Multiple Distinct Aggregates: Still Harm Performance Without Batch Mode In SQL Server

Growler


Well over 500 years ago, Paul White wrote an article about distinct aggregates. Considering how often I see it while working with clients, and that Microsoft created column store indexes and batch mode rather than allow for hash join hints on CLR UDFs, the topic feels largely ignored.

But speaking of all that stuff, let’s look at how Batch Mode fixes multiple distinct aggregates.

Jumbo Size


A first consideration is around parallelism, since you don’t pay attention or click links, here’s a quote you won’t read from Paul’s article above:

Another limitation is that this spool does not support parallel scan for reading, so the optimizer is very unlikely to restart parallelism after the spool (or any of its replay streams).

In queries that operate on large data sets, the parallelism implications of the spool plan can be the most important cause of poor performance.

What does that mean for us? Let’s go look. For this demo, I’m using SQL Server 2019 with the compatibility level set to 140.

SELECT
   COUNT_BIG(DISTINCT v.PostId) AS PostId,
   COUNT_BIG(DISTINCT v.UserId) AS UserId,
   COUNT_BIG(DISTINCT v.BountyAmount) AS BountyAmount,
   COUNT_BIG(DISTINCT v.VoteTypeId) AS VoteTypeId,
   COUNT_BIG(DISTINCT v.CreationDate) AS CreationDate
FROM dbo.Votes AS v;

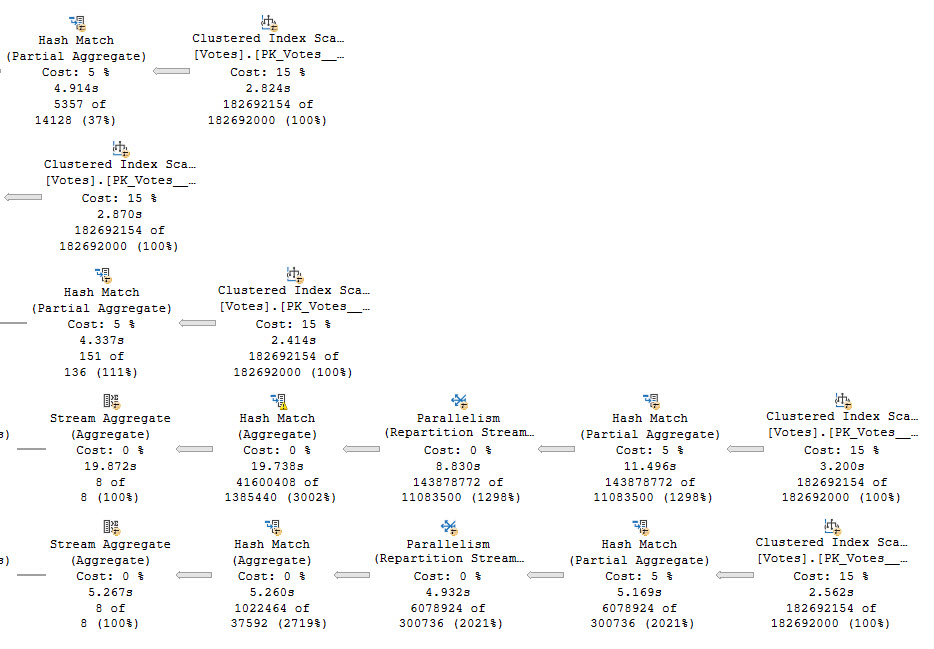
In the plan for this query, we scan the clustered index of the Votes table five times, or once per distinct aggregate.

SQL Server Query Plan
skim scan

In case you’re wondering, this results in one intent shared object lock on the Votes table.

<Object name="Votes" schema_name="dbo">
  <Locks>
    <Lock resource_type="OBJECT" request_mode="IS" request_status="GRANT" request_count="9" />
    <Lock resource_type="PAGE" page_type="*" index_name="PK_Votes__Id" request_mode="S" request_status="GRANT" request_count="14" />
  </Locks>
</Object>

This query runs for 38.5 seconds, as the crow flies.

SQL Server Query Plan
push the thing

A Join Appears


Let’s join Votes to Posts for no apparent reason.

SELECT
   COUNT_BIG(DISTINCT v.PostId) AS PostId,
   COUNT_BIG(DISTINCT v.UserId) AS UserId,
   COUNT_BIG(DISTINCT v.BountyAmount) AS BountyAmount,
   COUNT_BIG(DISTINCT v.VoteTypeId) AS VoteTypeId,
   COUNT_BIG(DISTINCT v.CreationDate) AS CreationDate
FROM dbo.Votes AS v
JOIN dbo.Posts AS p
    ON p.Id = v.PostId;

The query plan now has two very distinct (ho ho ho) parts.

SQL Server Query Plan
problemium

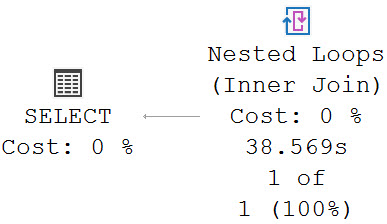
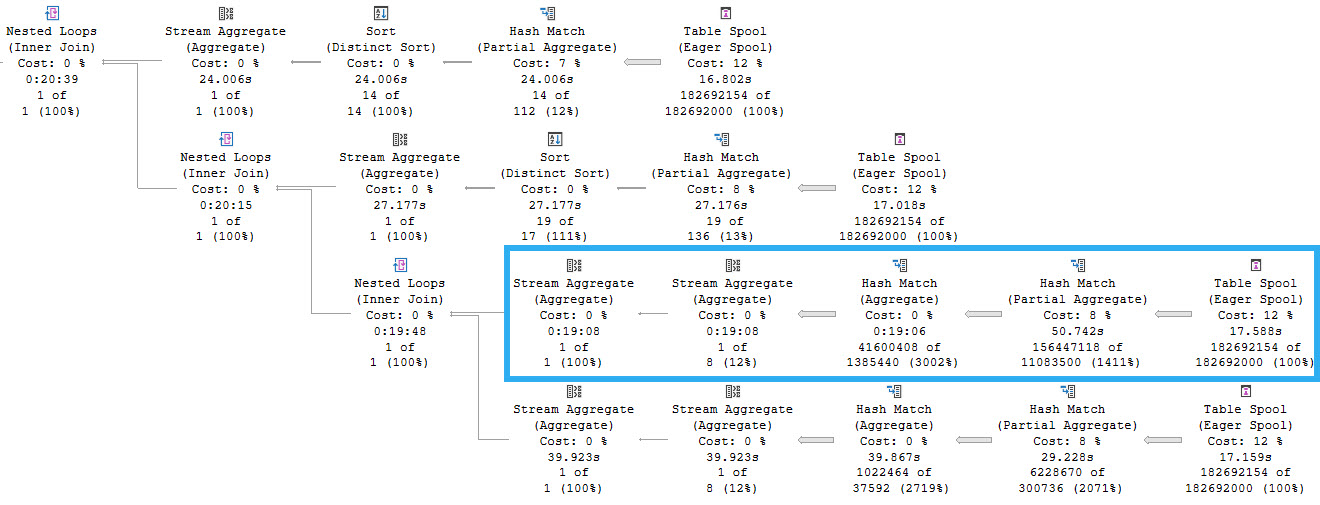
This is part 1. Part 1 is a spoiler. Ignoring that Repartition Streams is bizarre and Spools are indefensible blights, as we meander across the execution plan we find ourselves at a stream aggregate whose child operators have executed for 8 minutes, and then a nested loops join whose child operators have run for 20 minutes and 39 seconds. Let’s go look at that part of the plan.

SQL Server Query Plan
downstream

Each branch here represents reading from the same spool. We can tell this because the Spool operators do not have any child operators. They are starting points for the flow of data. One thing to note here is that there are four spools instead of five, and that’s because one of the five aggregates was processed in the first part of the query plan we looked at.

The highlighted branch is the one that accounts for the majority of the execution time, at 19 minutes, 8 seconds. This branch is responsible for aggregating the PostId column. Apparently a lack of distinct values is hard to process.

But why is this so much slower? The answer is parallelism, or a lack thereof. So, serialism. Remember the 500 year old quote from above?

Another limitation is that this spool does not support parallel scan for reading, so the optimizer is very unlikely to restart parallelism after the spool (or any of its replay streams).

In queries that operate on large data sets, the parallelism implications of the spool plan can be the most important cause of poor performance.

Processing that many rows on a single thread is painful across all of the operators.

Flounder Edition


With SQL Server 2019, we get Batch Mode On Row store when compatibility level gets bumped up to 150.

The result is just swell.


SQL Server Query Plan
yes you can

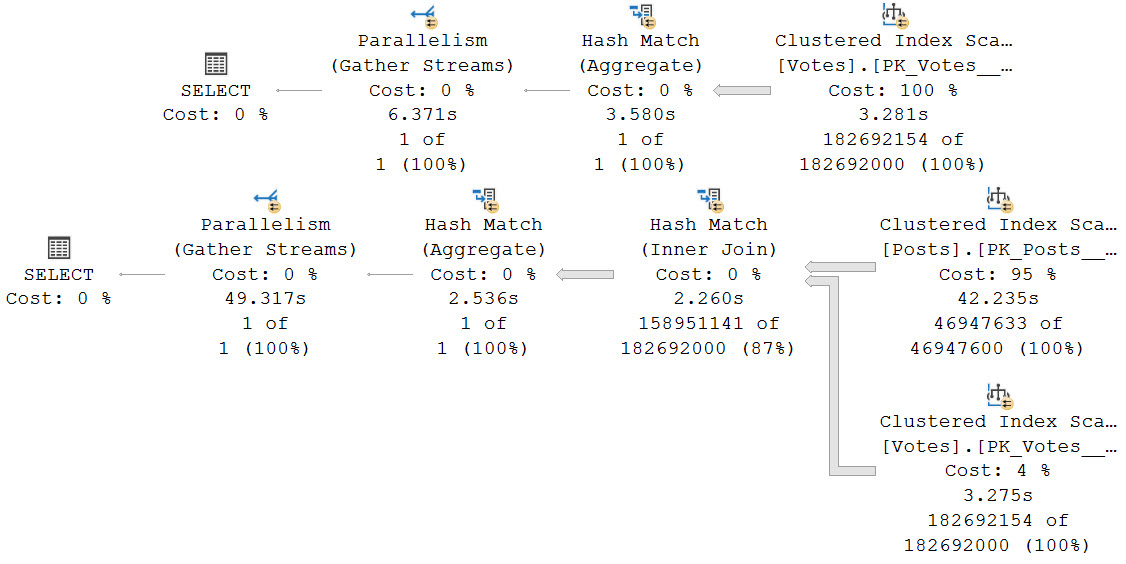
The second query with the join still runs for nearly a minute, but 42 seconds of the process is scanning that big ol’ Posts table.

Grumpy face.

Thanks for reading!
Going Further


If this is the kind of SQL Server stuff you love learning about, you’ll love my training. I’m offering a 75% discount to my blog readers if you click from here. I’m also available for consulting if you just don’t have time for that and need to solve performance problems quickly.

Database Context Is Everything In SQL Server

Full Frontal


Going Further


If this is the kind of SQL Server stuff you love learning about, you’ll love my training. I’m offering a 75% discount to my blog readers if you click from here. I’m also available for consulting if you just don’t have time for that and need to solve performance problems quickly.