Darling has three ways to look at what it collected. The Viewer is a desktop app. The web dashboard is a page in your browser. MCP is an endpoint that an AI assistant, such as Claude Code, talks to. This page shows how to open each one, how to sign in or connect, and the two or three screens you need first.
Every screen here comes from Darling 3.11.0 on a plain Windows Server 2022 VM that monitors one server, SQL2019. The first install is on the Install Walkthrough. Updating is on Upgrading Darling.
Last checked against Darling 3.11.0 in October 2026. For the full text of each surface, read the pages on GitHub: the Viewer, the web dashboard and MCP. Where this page and the Darling README disagree, the README is right.
| Surface | Where you open it | State after install |
|---|---|---|
| Viewer | The Darling Viewer shortcut on the service host | Ready. It needs no setup on the service host. |
| Web dashboard | http://localhost:5153/ on the service host |
Off until you turn it on. |
| MCP | http://localhost:5152/ from an MCP client |
Off until you turn it on. |
The Viewer
The Viewer is where you read plans, blocking chains, deadlock graphs and live active queries. It talks only to the Darling store, which is the PostgreSQL database that the service fills. It never connects to your monitored SQL Servers, so it needs no SQL Server login.
Open it and connect
Double-click the Darling Viewer shortcut that the installer made. You can also run this file:
C:\Program Files\PerformanceMonitorDarling\viewer\PerformanceMonitor.Darling.Viewer.exeOn the service host there is nothing to configure. The Viewer reads the postgres section of darling.json, finds the store on 127.0.0.1, and decrypts the store password from a file the service keeps. For about a second the server list is empty while it connects.
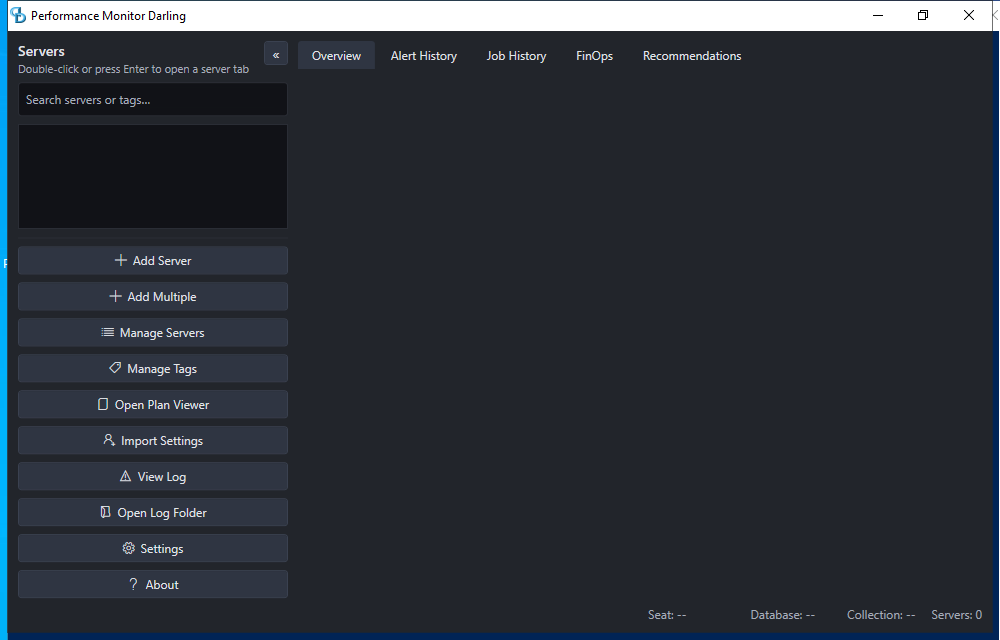
The server list and the Overview tab
Once it connects, the left side lists your servers and the Overview tab shows one card per server. Here SQL2019 is online, with 43 collectors healthy and none failing. The bar at the bottom shows the seat, the collector count and whether collection is active. This seat reads Seat: read-write, which is what you get on the service host.
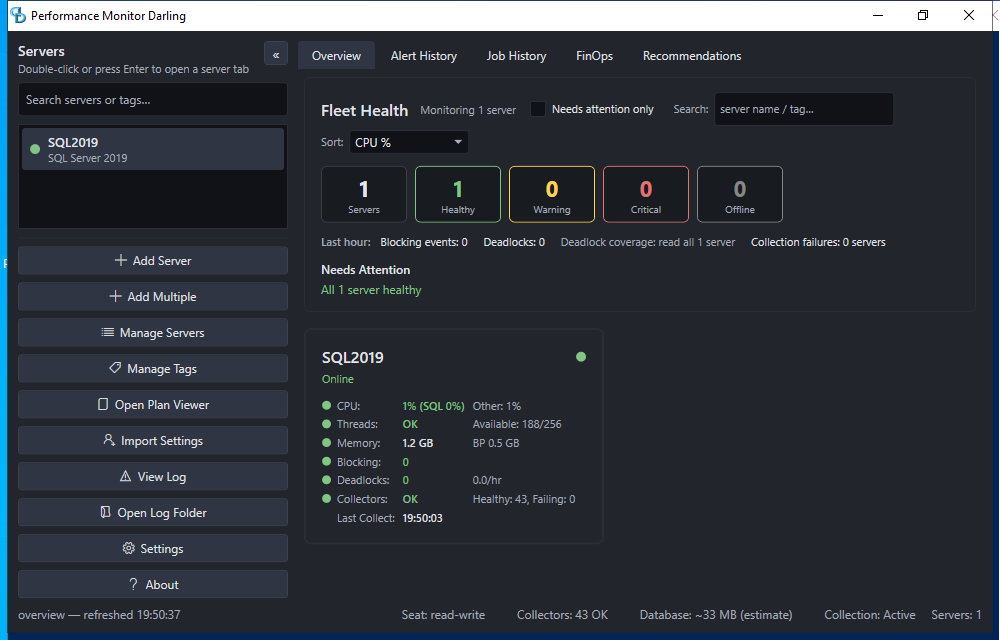
Double-click a server, or select it and press Enter, to open its tab.
One server’s tab
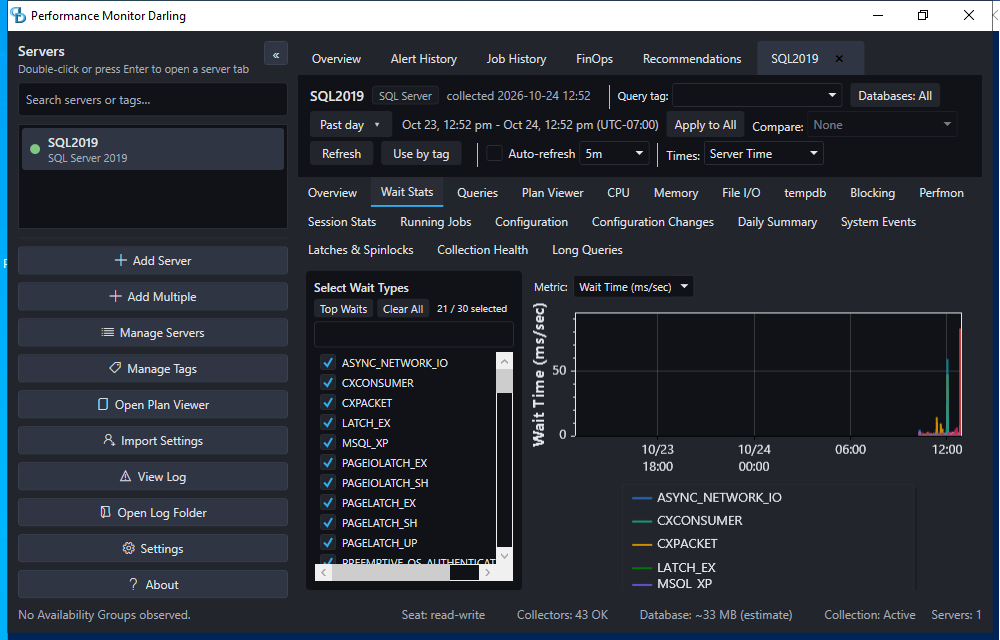
A server tab opens on Overview. The sub-tabs run along the top: Wait Stats, Queries, Plan Viewer, CPU, Memory, File I/O, tempdb, Blocking and more. Pick a time range at the top left. This screen is the Wait Stats sub-tab for the past day. The charts start where collection started, so a new install shows a short line at the right edge.
If it will not connect
The failure window has a Configuration this viewer used block. It names the darling.json that the Viewer read, the rule that picked that file, and the host, port, user, database and SSL mode it parsed. It never contains a password. A Copy details button copies the block, and the same lines go to %APPDATA%\PerformanceMonitorDarling\logs\darling-viewer_yyyyMMdd.log. Read the block before you change anything. It tells you whether the Viewer read a different file than the one you edited, or read yours and found a wrong value.
Read-only and read-write seats
Some Viewer actions are not reads. Examples are Add Server, Get Actual Plan, Purge Now, alert Dismiss and mute-rule editing. Each one queues a command in the Darling store for the service to run. A read-only seat cannot write that command. Nothing is ever written to a monitored SQL Server from the Viewer.
The seat on the service host is read-write. A Viewer on another machine connects as the viewer role, which is read-only, unless the service host sets a different role. The Seat label at the bottom of the window tells you which one you have.
A Viewer on another machine
A change on the Viewer side cannot make the store reachable. By default the store listens on 127.0.0.1 only. On the service host, open an elevated PowerShell in the install folder and run these three commands in order. Choose the store option when the wizard asks.
cd "C:\Program Files\PerformanceMonitorDarling"
.\PerformanceMonitor.Darling.Service.exe --configure-network
.\PerformanceMonitor.Darling.Service.exe --configure-firewall
.\PerformanceMonitor.Darling.Service.exe --export-viewer-config
The last command writes a viewer-config folder with three files: darling.json, server.crt and README.txt. That darling.json holds a live database password, so copy the folder over a channel you trust. On the other machine, put the three files next to PerformanceMonitor.Darling.Viewer.exe. The Viewer is in the viewer folder of the release zip. I did not run these three commands for this page. They come from the README, which has the full reference.
The web dashboard
The web dashboard is a browser view of the same store. The Darling service serves it, so nobody installs anything on the machine with the browser. It is off until you turn it on.
Turn it on
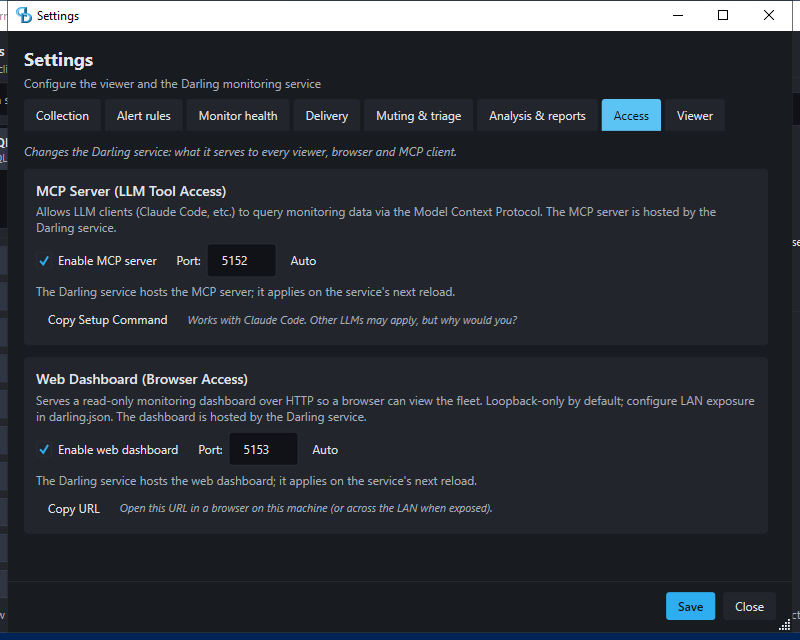
There are two ways. Tick Enable web dashboard on the Access tab of the Viewer’s Settings window, as in the screen below. Or run this from an elevated PowerShell in the install folder:
.\PerformanceMonitor.Darling.Service.exe --enable-webThe service picks the change up within one collection sweep. It does not restart. The Settings window has the same pair of boxes for MCP, which the MCP section below uses.
Sign in
By default the dashboard listens on the service host only, at http://localhost:5153/. To open it from another machine, run --configure-network and choose the web option. The wizard writes a network block into darling.json. The block holds the address to listen on, the networks that can connect and an access token. The wizard prints the token once. Then run --configure-firewall and restart the service.
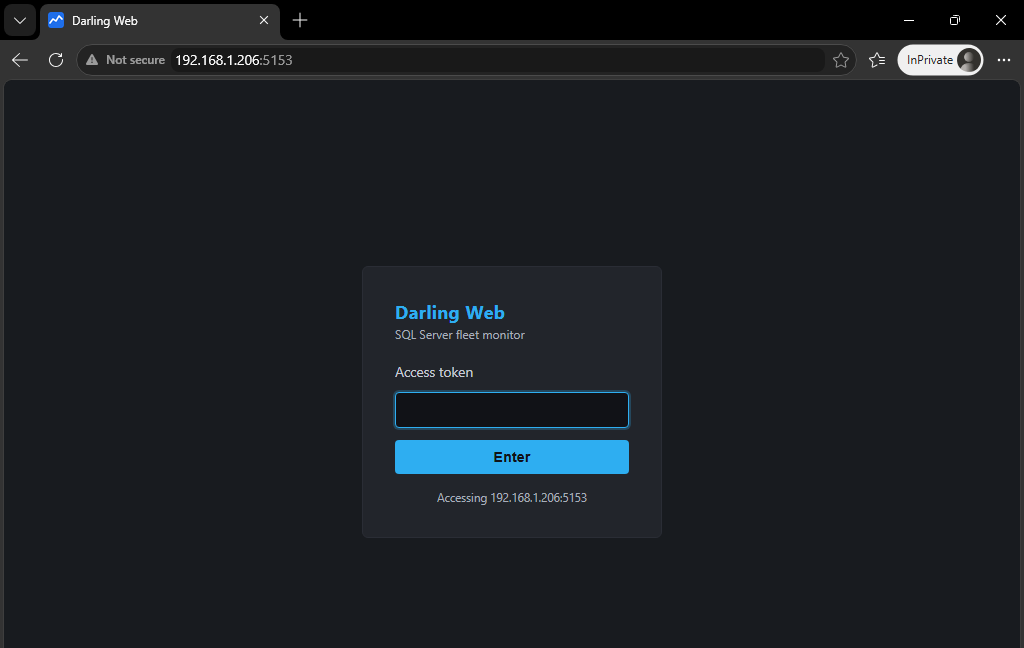
A dashboard on the network starts at a sign-in page. Paste the token into the box once and select Enter. The dashboard trades the token for a session cookie, so you do not paste it again. This screen is the sign-in page with the box still empty. To read the token again, run --print-web-token in an elevated PowerShell on the service host.
The fleet page
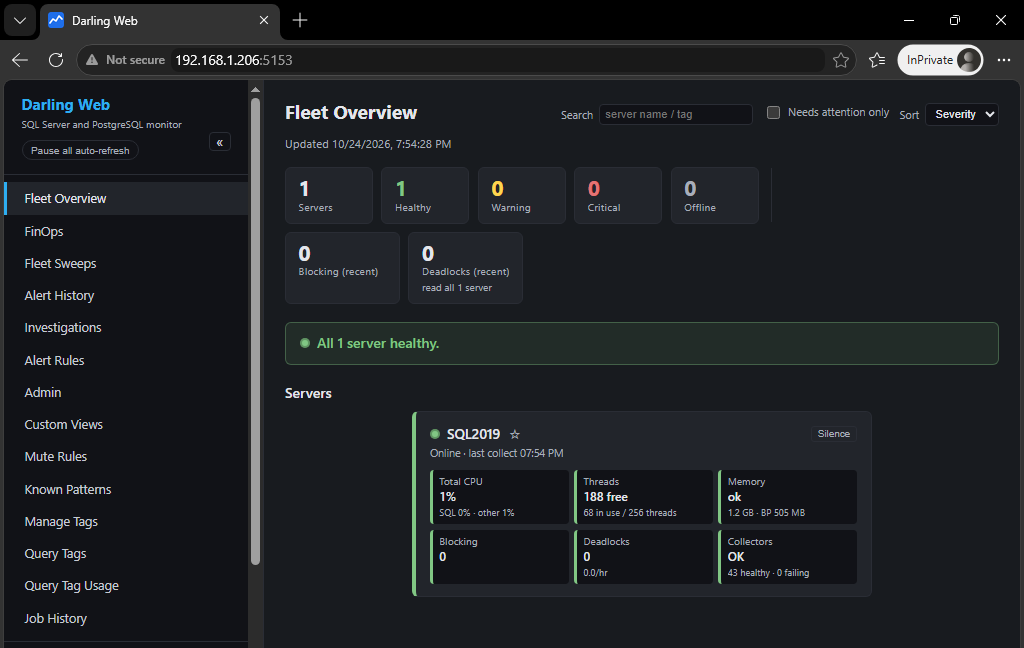
After sign-in you land on Fleet Overview. The sidebar lists the pages: Fleet Overview, FinOps, Fleet Sweeps, Alert History, Investigations, Alert Rules, Admin and more. Your servers are listed below those links. Each server gets a card with CPU, threads, memory, blocking, deadlocks and collector health.
A drill-down page
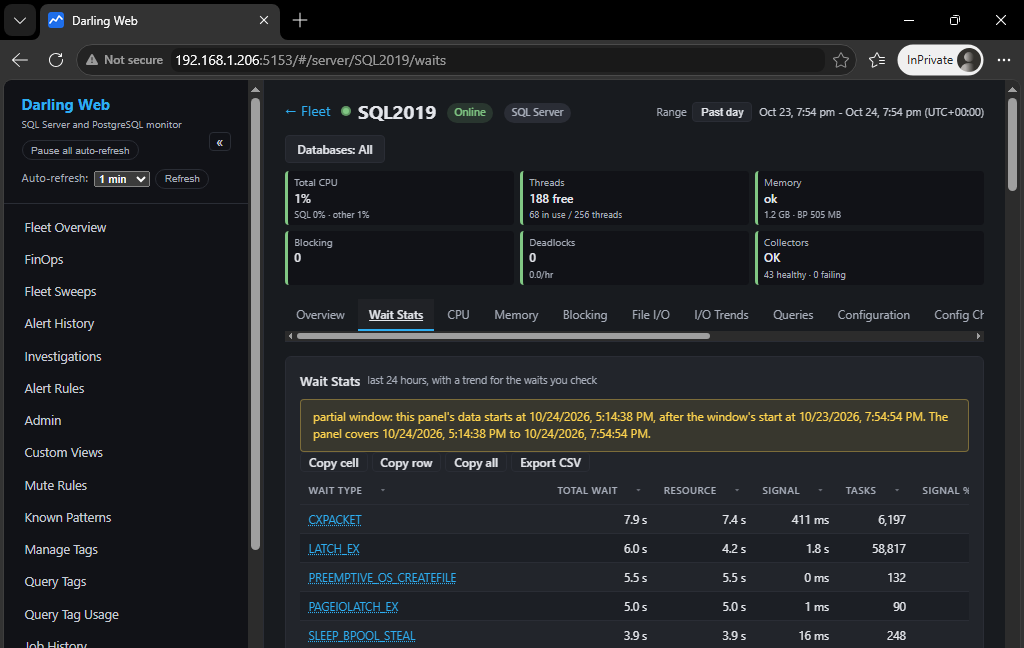
Select a server card to open its page. It has a row of tiles at the top and a row of tabs under them. The tabs include Overview, Wait Stats, CPU, Memory, Blocking, File I/O, Queries and Configuration. This screen is the Wait Stats tab. The yellow note says the panel has data only from the time collection started, which is true on a fresh install.
Plans and live active queries are in the Viewer, not on the web. A browser that already has the session cookie goes straight to the fleet page.
MCP
MCP is the endpoint an AI client talks to. Every tool reads the data Darling already collected. No tool runs SQL that a client wrote against your monitored servers. The tool list covers waits, queries, blocking, deadlocks, alerts and fleet health. It is off until you turn it on.
Turn it on and set the token
Use the Enable MCP server box on the Access tab of the Settings window, or run this from an elevated PowerShell in the install folder:
.\PerformanceMonitor.Darling.Service.exe --enable-mcpOn the service host, with no token set, a local client can connect with no token. To let a client on another machine in, run --configure-network and choose the MCP option. The wizard writes the mcp.network block, shows the token once and offers to restart the service. Run --configure-firewall afterwards. The token is stored encrypted in darling.json, and --print-mcp-token shows it again from an elevated PowerShell on the same machine.
This is the mcp section of darling.json on the VM, with the token value replaced by <token> in the image. The service listens on one LAN address and accepts only the 192.168.1.0/24 network.

Connect a client
Point the client at the address of the service host and send the token as a bearer token. For Claude Code, the Settings window has a Copy Setup Command button that copies the claude mcp add command for you. The command has this form:
claude mcp add --transport http --scope user sql-monitor-darling http://192.168.1.206:5152/ --header "Authorization: Bearer <token>"A client on another machine must use the address of the service host, never localhost. A client that points at localhost reaches its own machine and fails without a clear error.
Check the endpoint without a client
You can call a tool with plain PowerShell. This is the list_servers tool, which only reads. The answer arrives as a server-sent event, so the script takes the line that starts with data: and reads it as JSON. I did not install an MCP client on the VM.
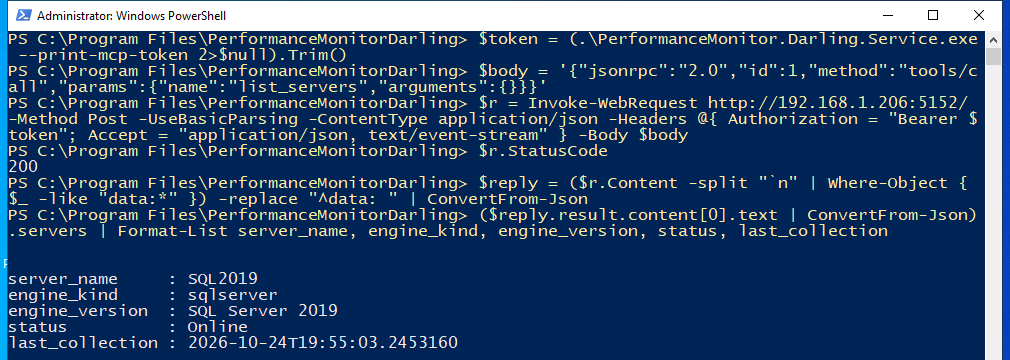
The answer shows SQL2019 as an online SQL Server 2019 server with the time of its last collection. A client that connects sees the same thing when you ask it which servers are monitored.
If it will not connect
- A 401 answer means the token is wrong or missing.
- A 403 answer means the client is outside the networks that
allowFromlists. - After three wrong tokens from one address the service starts to delay that address and answers 429 with a
Retry-Afterheader. During the wait it refuses even the right token. - If the service says MCP is enabled but the port is still bound to loopback, the service read darling.json before the
networkblock existed. RunRestart-Service 'PerformanceMonitor Darling'. - If the port is open on the service host and closed from the other machine, check the firewall rule that
--configure-firewalladds.
The write tools, which change monitoring settings, are off unless darling.json sets mcp.allowWrites. The MCP section of the Darling README lists them.