Custom Views is the composable half of the web dashboard: build your own dashboards and notebooks from the collected data, no SQL required, and they save for every seat. The built-in pages answer the questions everyone asks; this is for the questions only your shop asks.
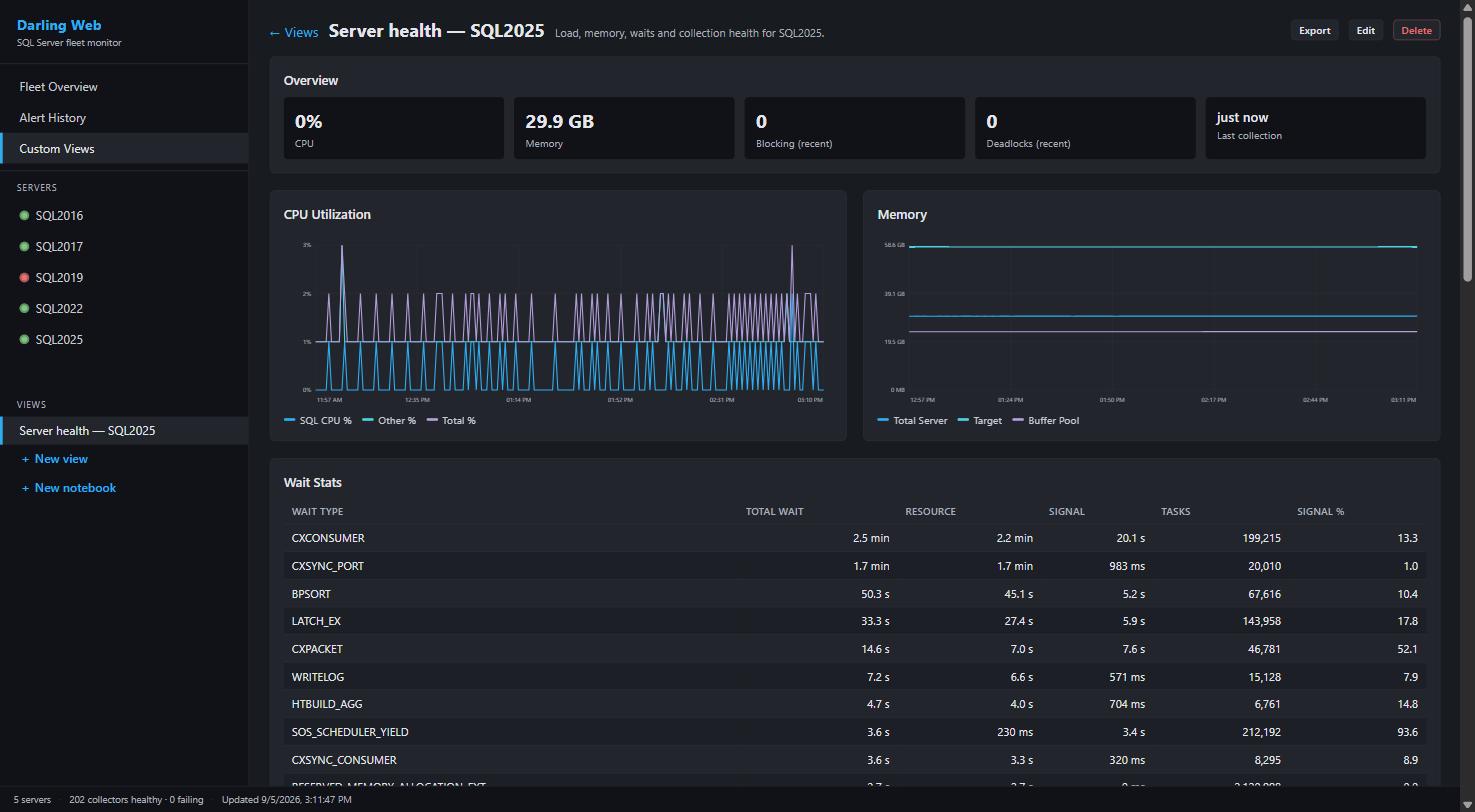
A server health dashboard built from a template in one click: stat cards, charts, and a wait stats table, live from the store.
Dashboards
A view is a set of panels. For each panel you pick a measure from the curated catalog, choose how to aggregate it, group and filter it, and chart it: lines, bars, areas stacked or plain, pies, scatter, stat cards, tables, or gauges. The editor previews live as you build. Views scope by server and time range at view level, so one definition re-reads for any server and any window, and the finished view refreshes on the dashboard’s normal cadence.
Notebooks
A notebook mixes markdown cells with those same live panels, in order, which turns an investigation you’ll run again into a document: a deadlock postmortem, a memory story, a what-changed timeline, with your commentary between the charts. Template variables (a database picker, or your own) make one notebook reusable across contexts.
Templates, So the First Click Isn’t a Blank Canvas
Five ready-made dashboards ship: server health at a glance, CPU investigation, blocking and deadlocks, memory pressure, and configuration review. Five notebook templates ship beside them: a blocking root-cause analysis, a deadlock postmortem, a what-changed timeline that lines configuration and system events up against CPU, a memory walk from server totals down to grants, and AG replication health. Pick a server, click one, and you have a working page you can then edit.
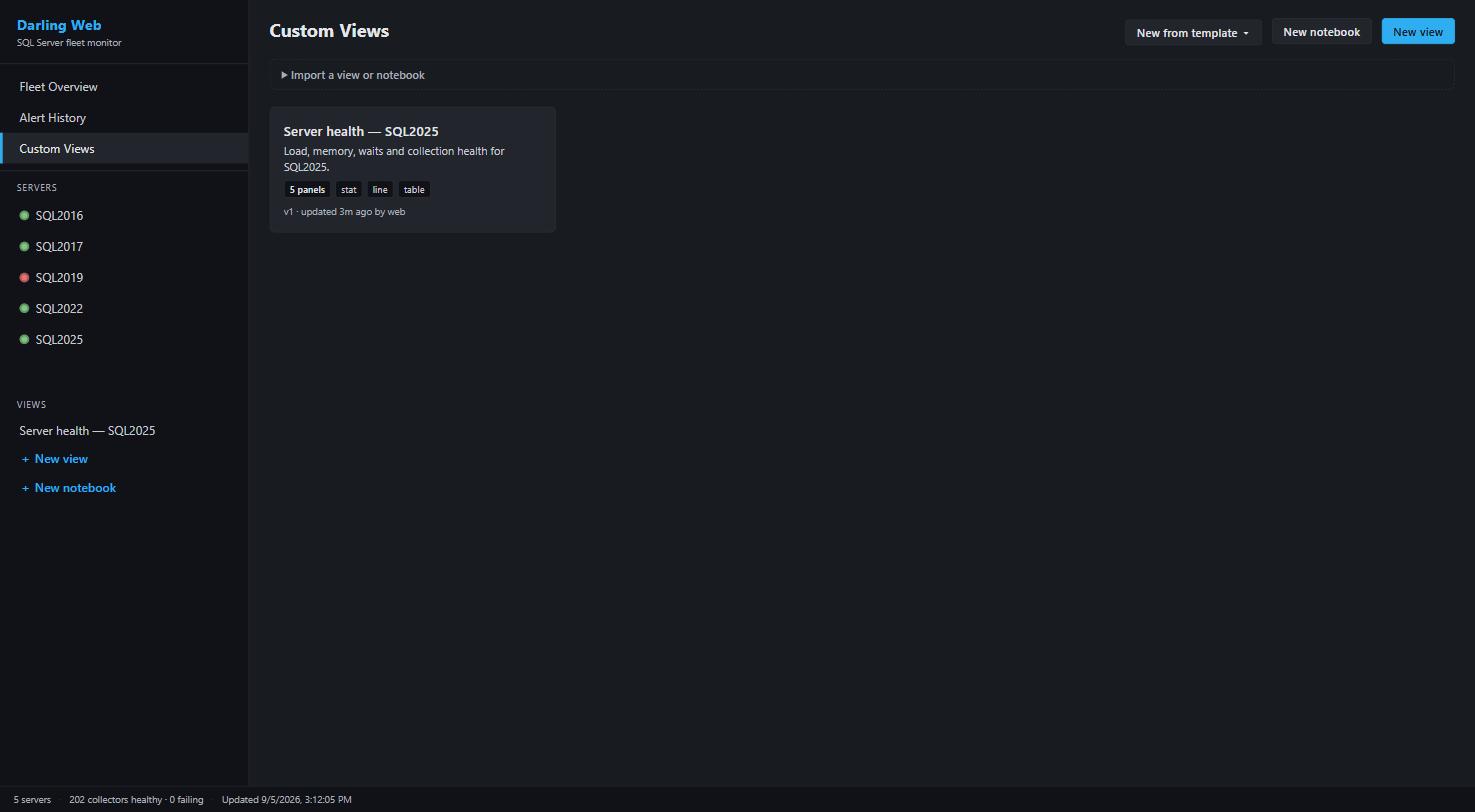
The Custom Views page: saved views with panel summaries, the template roster, and JSON import.
Sharing and Automation
Views and notebooks export and import as JSON, so a good dashboard travels between stores and teams as a paste. And because the MCP surface includes the Custom Views tools, an AI agent can discover, create, and manage them: “make me a dashboard showing tempdb and memory grants for the ETL window” is a sentence, and the write path validates the same way the editor does. Definitions live in the store (config.custom_views), which is the web dashboard’s one write path; everything else it serves is read-only.
PerformanceMonitor on GitHub · monitoring overview