YouTube Days: Improving The Parallel Query Processing Documentation For SQL Server

Improving The Parallel Query Processing Documentation For SQL Server


I’m working on ramping up my recording and streaming setup now that life has settled down a little bit, and publishing the results to YouTube while I work out the wrinkles. Enjoy some free video content!

Video Summary

In this video, I delve into the parallel query processing documentation in SQL Server, pointing out where it’s incorrect or misleading, and highlighting some dead-end links that don’t provide additional information. I walk through several examples to demonstrate how certain constructs, such as recursive common table expressions (CTEs), scalar user-defined functions (UDFs), multi-statement table-valued functions, and the `TOP` keyword, can actually support parallel execution in ways not fully captured by the documentation. By creating detailed demos using the Stack Overflow 2013 database, I show that some parts of these queries can indeed run in a parallel zone despite what the docs suggest, while other parts remain single-threaded. This video aims to provide clarity and practical insights into how SQL Server handles parallelism for these constructs, helping developers make more informed decisions about query optimization.

Full Transcript

Erik Darling here with Darling Data. And today’s episode is going to focus on the parallel query processing documentation, some places where it’s wrong and some places where it’s misleading, and some places where the links to get more information sort of lead to a dead end. There isn’t actually any more information at some of these links, which is kind of funny.

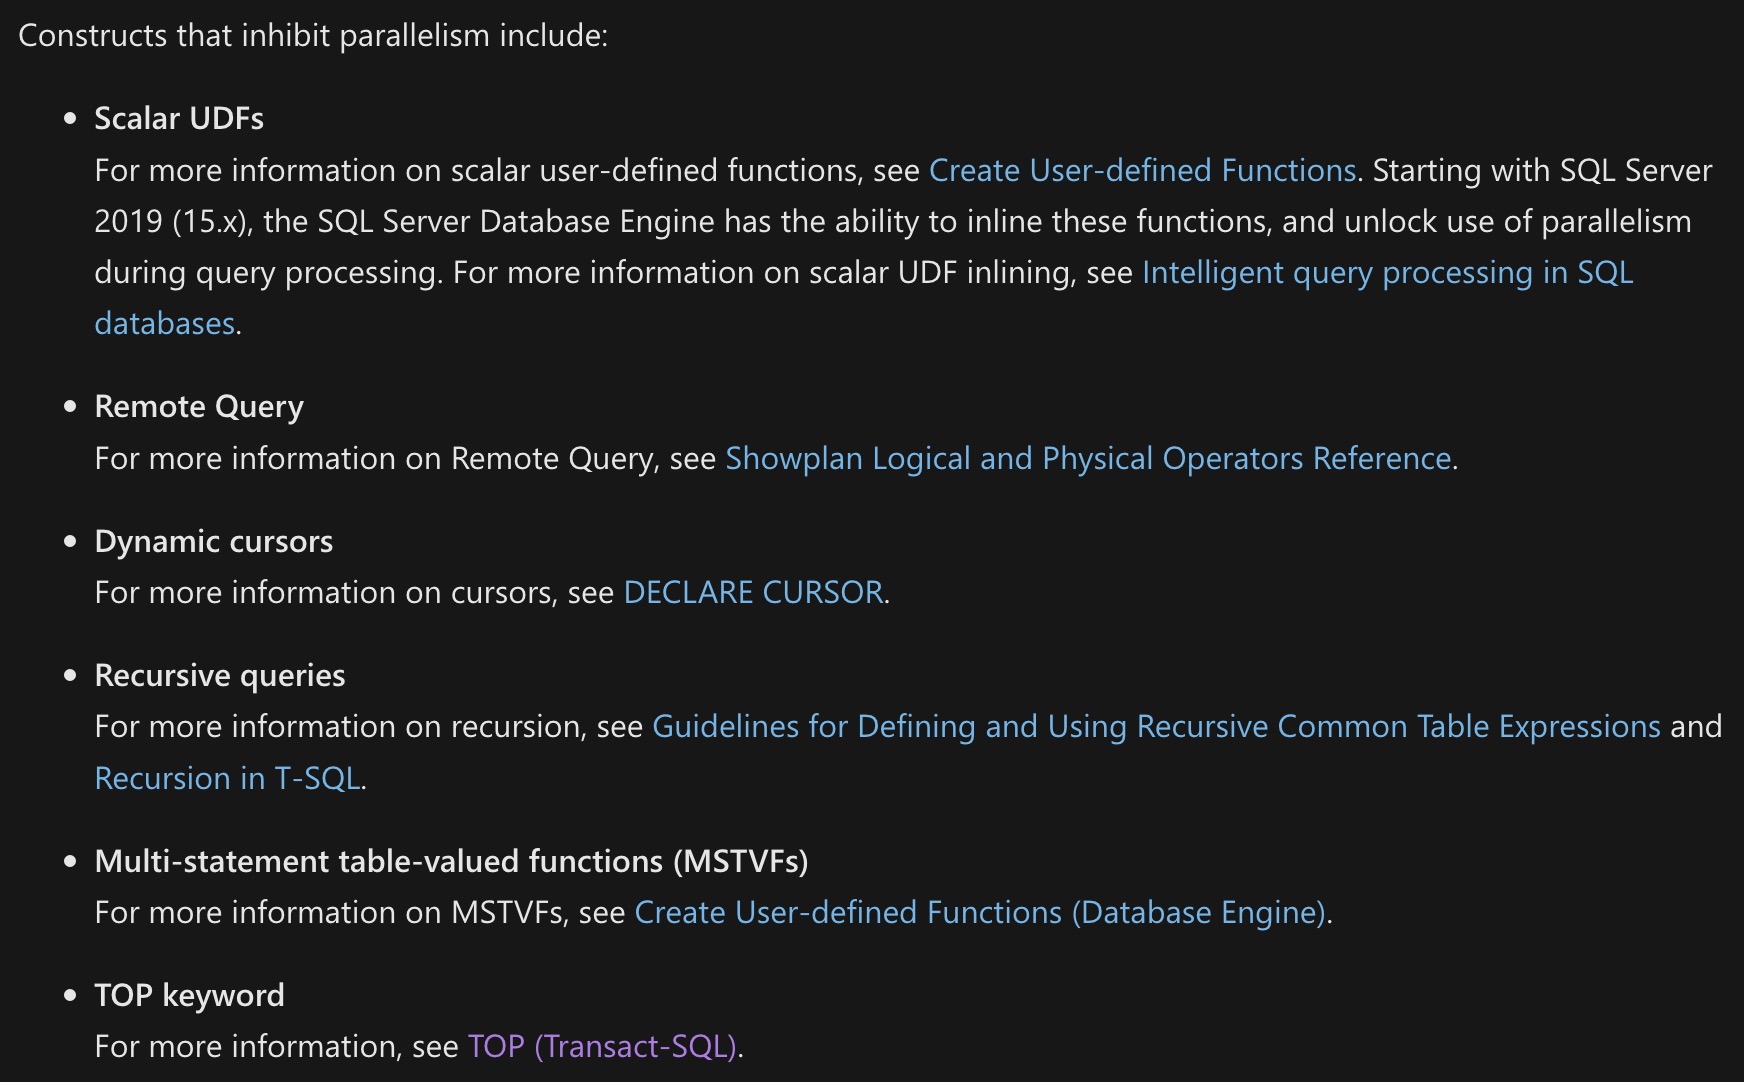
Now, the docs start by talking about constructs that inhibit parallelism, which is this list here. You have scalar UDFs, which is mostly right. You have remote queries, which is like half right.

You have dynamic cursors, which is right but incomplete. You have recursive queries, which is half right. You have multi-statement table-valued functions, which are also half right.

You have the top keyword, which I’m actually going to call half wrong, because it is, again, not really accurate. And what’s funny is that for a lot of these things, there’s all these things that say for more information, you go over to whatever link. And for a lot of them, there’s not actually any more information about parallelism at the other docs.

And that’s fine. Maybe it’s not the right place for it. But it’s also not very helpful to folks who are trying to find things if there is nothing additional at those other links about parallelism. Now, if you scroll down a little bit further, there’s this really exciting table of non-parallel plan reasons.

The non-parallel plan reasons are, they’re right for the most part. But the thing that kind of gets me is that there’s actually better detail in this table than there is up there at the top, or up there in the list of things that might inhibit parallelism. And for some of them, it’s kind of funny because you’ll see reasons that queries can’t go parallel here that don’t actually show up in here.

Like there’s nothing about top in here, there’s nothing about multi-statement table valued functions in here. There is, of course, something about table variables not supporting parallelism. But there’s nothing in the documentation up here that says the problem with the multi-statement table valued function is the table variable, not the function itself.

So I’ve written a series of demos that go through and either complete or debunk some of the information in the docs. So let’s start over in the lovely Stack Overflow 2013 database. And the first thing that we’re going to look at is recursive CTE.

Now, what I’m going to do is not actually run this whole thing because we don’t actually need to run this whole thing. And for a lot of these queries, I have some hints on there to force parallelism because it wasn’t naturally occurring. But what I want to show is that some part of the plan can indeed go parallel if need be.

So we’re just going to get an estimated plan for this recursive query. And just to make sure everyone understands a recursive CTE, a CTE is when you start off with a CTE. And then inside of that CTE, you execute some recursive doodads.

I love the doodads. So here we’re just selecting from post where the ID is equal to some post value. And then you union all and you join the recursive portion of the CTE.

You join that sort of back to itself, right? Because the name of the CTE up here is P. And we’re selecting from that part of the CTE.

This is the anchor. And this is the recursive portion. So if we look at the plan for this, now, if we remember what the docs said, one thing that would happen if we had a recursive query query is that we would have parallelism inhibited for that query.

And we can clearly see the execution plan that a large chunk of the query plan, after the recursive portion, does execute in parallel. We have a parallelism distribute streams.

And that’s where we join off to the user’s table outside of the recursive portion. So after we select from the recursive CTE, we join to the user’s table.

That whole portion of the query is free to run in a parallel zone in the plan. But the recursive CTEdoes have a restriction where this part has to run in a serial zone in the plan.

So the recursive CTEdocumentation, about half right. Just about half right. And have like the recursive CTEportion, can’t go parallel, but other parts can. The scalar UDF version is, again, right, but incomplete.

So I’m going to create this UDF, scalar UDF here. And this UDF, even though I’m on SQL Server 2022, and I am in compat level 160, 160, one restrict, so like some functions could potentially be inline, scalar UDF inlining, pretty cool feature.

Started with, you know, SQL Server 2019. But there are a lot of limitations to it. And one of the limitations to it is that if your scalar UDF has a CTE in it, then it is disallowed from scalar UDF inlining for some reason.

Why? I don’t know. It just is. So if we run a query that calls that function, we’re going to run the whole thing once. And then we’re going to run, actually, you know what?

We’re not going to run this whole thing because I didn’t create indexes to support this, and it will run for four hours. That’s a different demo. But what I do want to show here is why the documentation is only half right. So the initial call-in query up here is forced to run single-threaded.

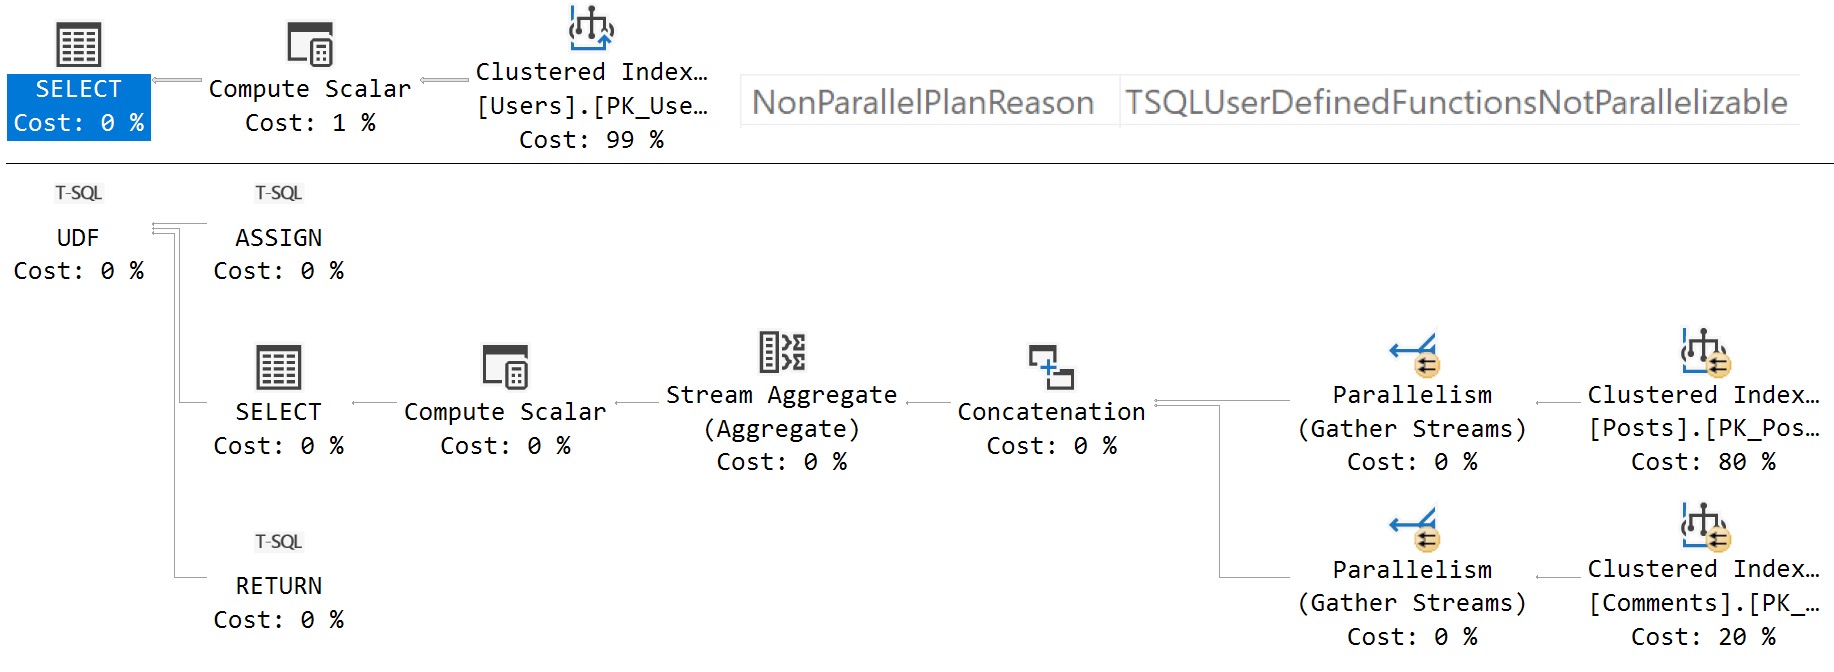
If we grab the properties of the select operator and we look at the details in the properties pane, we are going to see the infamous non-parallel plan reason. And since we are on SQL Server 2022, we actually have the filled-in reason here, the t-SQL user-defined functions not parallelizable, which is right.

They’re not when they can’t be inlined. Inline functions might not go parallel even. But what you do see in the part of the plan that calls the scalar UDF, right, in here, where the UDF is executed, we have a parallel plan.

If we look over here, we can see that the body of the function was indeed able to engage a parallel execution plan. And part of the reason why this occurs naturally is because I didn’t create indexes.

So good on me for remembering that at the last minute and not sitting here for four hours waiting for results to come back. And the scalar UDF thing can be expanded out to two places where I see UDFs pop up quite a bit, where I really wish they wouldn’t.

One is in computed columns and the other is in check constraints. So if we create this function, actually I already created this, so doing this is really just for show. Create this function, oh, what did I do?

Oh, oh yeah, okay, I can’t alter it because it’s already referenced by the table. Good, good, good. So we don’t actually have to do that for show. But what I have here is a table created called serial. And the definition of the table has a computed, persisted even computed column in it that calls that function.

I’ve already stuck some data in the table and I’m just going to run this and get the estimated plan. And this will, because we have a scalar UDF in the computed column on this table, helpfully called serial, we are going to have our non-parallel plan reason yet again.

All right, so even SQL Server, SQL Server’s scalar UDF inlining abilities cannot defeat a scalar UDF in a computed column even if it’s persisted. It would be the same deal even if we indexed it as a parallelizable thing.

Check constraints are a little bit more complicated in the restriction. So I’ve got another table where I have this as a check constraint and where I already have some data in there. And the main difference in what’s parallelizable when you have a check constraint is in which columns are referenced.

So in the first query, I’m just, I’m just like basically cross-joining these tables together. But when I do a cross-join, the plan’s a little weird. So I’m just doing a left join on 1 equals 1, 2, I’m self-joining this table to itself basically.

And I’ve got the query trace on 8649 here to force a parallel execution plan. And when you look at these two plans, the first one, actually let’s go back to the queries real quick. The first one just does a count big.

We’re just doing a count of everything everywhere. Which means that the check constraint column doesn’t have to be projected out anywhere. It’s not involved in the query.

So the first query plan actually does, is fully parallel. This is all parallel up until the very end of the execution plan. And the second one, where we select the column B, which is what the check constraint is on, and where we also group by B, because we have to group by B if we’re getting a count, that query plan is forced to run fully single threaded.

And if we look at the non-parallel plan reason, again, we’re going to have the non-parallelizable function in the details there in the properties. So a little bit more complicated of a story with the check constraints.

And so it really is the column that’s involved in the check constraint that causes the problem. So if I created this table differently, and I put the function on the ID column, then doing anything with the ID column would, if I had to join with it, selected any of that stuff, then that would cause the plan to run single threaded.

Now, multi-statement table value functions are also somewhat restricted in parallelism, but not fully restricted in parallelism the way that the documentation kind of indicates. So if we create this function here, it returns a table variable, we do all this work in here.

The part of the query plan that is initially forced to run single threaded is going to be the modification to the table variable. Modifying table variables can’t run in a parallel zone.

The other part of the query plan that’s going to be single threaded is going to be reading from the table variable that the multi-statement table valued function returns. There’s all sorts of intricacies here where if you had table variables, like since multi-statement table valued functions report, like basically support, you like multiple steps, if branching, all that crazy stuff in there that uh, inline table valued functions don’t.

So if you had table variables declared, inserted to read from, and internally inside of the function, uh, table variables could theoretically be read from in a parallel zone, but the return table variable, the table variable that you return data from, cannot do that.

So if we run this query, or just get the estimated plan from it probably, uh, we’re going to see the estimated plan both for the query that calls the multi-statement table valued function, and for the multi-statement table valued function itself.

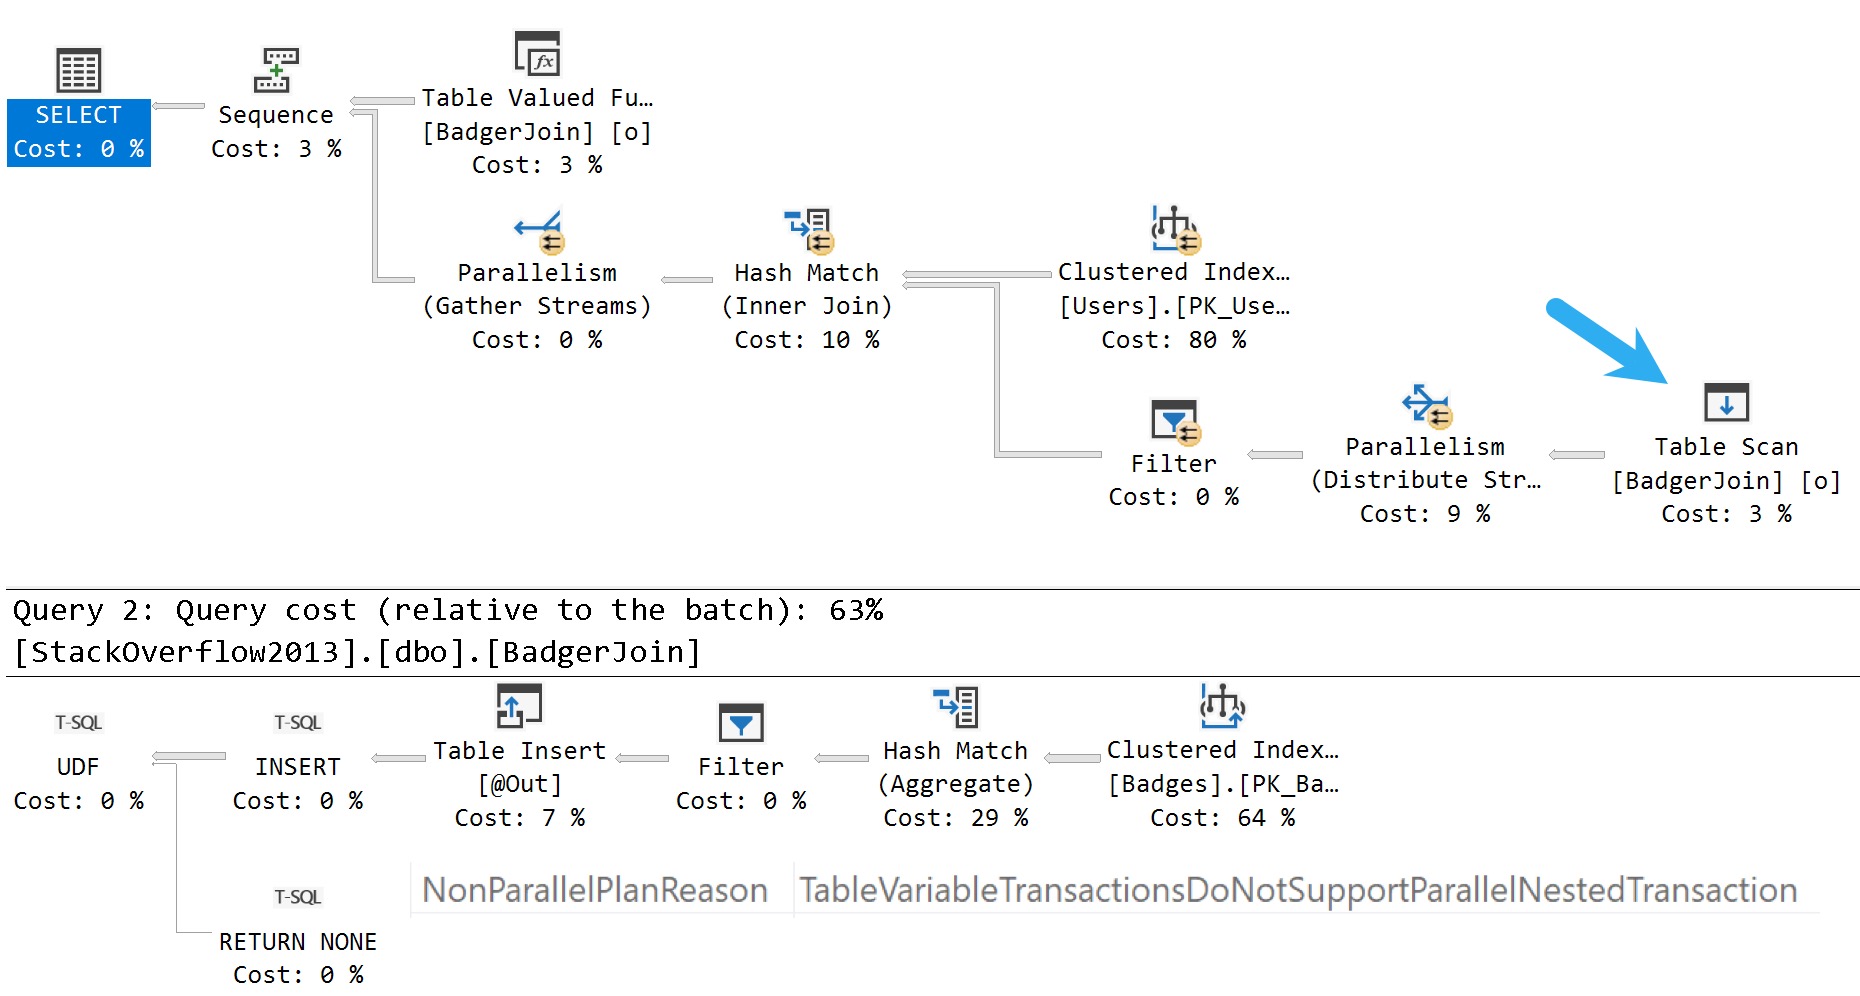
So when we looked at the scalar UDF, the body of the scalar UDF was allowed to run in a parallel zone. It’s not the case here. If we look at the properties of the table insert for, uh, the, uh, multi-statement table valued function, we are going to have, uh, that’s sorry, this is, this is a long, this, this one’s a mouthful.

Uh, we’re going to have a non-parallel plan reason that table variable transactions do not support parallel nested transaction. I’m not sure if that should be transactions in there. Uh, it seems a little weird that that’s singular, but whatever.

Um, I’m not the grammar police. Uh, don’t, don’t engage in that sort of fascism. Uh, but, uh, up here in the, uh, the query that calls the, um, calls the multi-statement table valued function, we do indeed have an entire parallel zone in that query plan.

The part of the query that is not allowed to run, uh, in parallel is reading from the multi-statement table valued function, returning that table variable. That is, that is a restriction, uh, across the board.

Uh, another place where the documentation is, uh, quite short on detail, and where, you know, if we remember, like, come back, coming back over here and looking, we see the top keyword mentioned here, right?

Trying to give tops a bad name. Big mistake. Uh, and then we look down in the non-parallel plan reasons. There’s no mention of top anywhere in here, right?

And top isn’t mentioned as a non-parallel plan reason. Uh, and this is where it’s a little misleading, because it says top will restrict parallelism, but then if you look in the details down here, it doesn’t actually do that. Uh, there’s no, there’s like no mention of it here.

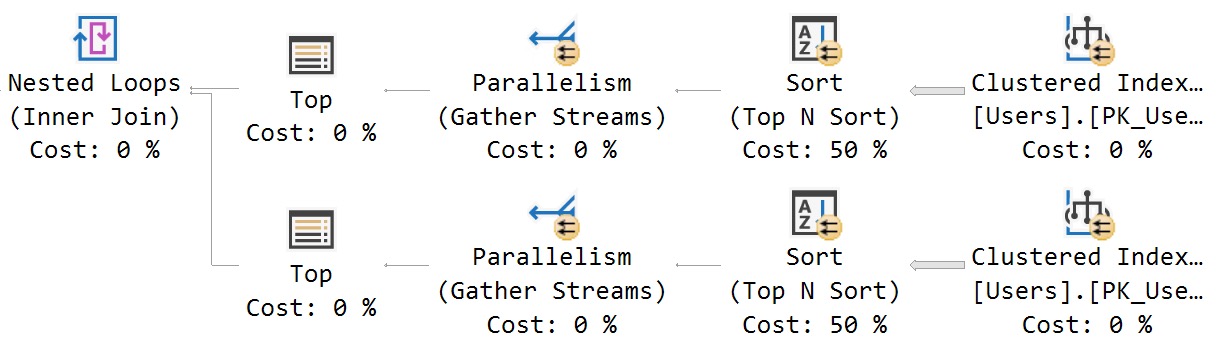
And it’s, it’s only even partially true that it, because it only happens sometimes. So if we look at this query, where we have, uh, two select top ones, one here and one here, and we just sort of join those together.

Uh, and we look at the estimated execution plan for this. We are going to see, uh, two branches of the parallel query plan, right? Because we have the two top ones.

Uh, they can’t share whatever they were doing. Uh, and we do have SQL Server coming into a serial zone after the initial parallel zones, right? So like we have the gather streams operators here, which is clinching our parallel zones together.

Uh, these two things happen completely in parallel. But then as we get into the top operator, this is where the serial zone is, right? So everything basically from here on over happens single threaded, going into the top.

Where that diverges from being the God’s honest truth is when we use apply. So, uh, when either when we use the cross apply, uh, language element here, or if SQL Server optimizes a nested loops join to use, uh, apply nested loops rather than regular nested loops where the apply pushes predicates down to when we, we talk to the table on the inner side of the join.

Uh, then, then we can get a fully parallel zone there. I’m just going to get an estimated plan for this. And you can see that in this case, we have a fully parallel zone.

Well, let’s sorry. Let’s frame that a little bit better. Uh, there we go. We have a, uh, the end of the parallel zone gathering streams going into the final top, but we do not have, but we, we don’t have any restriction on this part of the query.

If you can even see this top end sort is, uh, fully inside of a parallel zone. There’s no clenching or cinching of the parallel threads there. Uh, the other thing or another thing that can, uh, cause a parallel, or sorry, a serial zone in a query, uh, is a global aggregate.

So, uh, I’ve got quite a bit of fancy, um, query stuff, query hints in here to get exactly the plan that I want. Uh, sometimes it’s kind of tough to get exactly the plan you want, just writing the query, uh, with, you know, some of the tables that you have available.

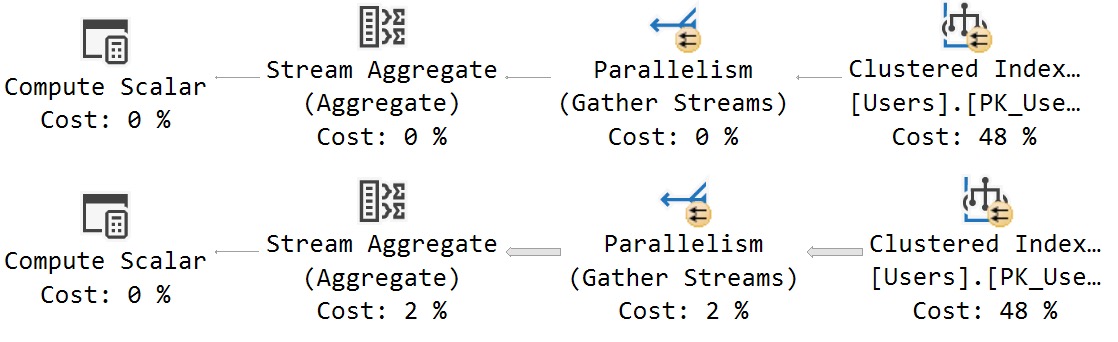
Uh, but if we look at this estimated execution plan, we have, uh, two parallel branches of the query. Uh, we have this part, which is fully parallel. And then going into both of those, uh, uh, I have to remind myself what those were.

There are two counts in this case. If we look at this going into each one of those counts produces a, um, produces a serial zone in the plan. We can see the gather streams happen there.

And the stream aggregates that do the count here. Uh, and then the global sum, right? The getting the sum of the two counts, adding those two counts together is also in a serial zone. This is would also qualify as a serial zone in the plan.

If we did some, if we, if our query looked a little bit different, uh, you can kind of, uh, see how that works. If you, well, actually, that doesn’t even go parallel. So forget it.

Um, and that’s not true of, uh, queries that have a grouping element, right? So global, global aggregate is just like select count, select sum, select average, min, max, all that stuff. Uh, for queries that, uh, have a, uh, grouping, uh, element to them, those queries, uh, those aggregates are allowed to happen fully inside of a parallel zone.

All right. So this one, this whole query runs in parallel. That’s fine. Uh, another thing that the documentation is only half right about is linked servers. So, uh, and I, I realize that this is cheating a little bit, but it’s the best that I’m going to do, be able to do quickly.

Uh, so I have a linked server here that I create. It’s a loopback linked server, meaning the server basically points to itself. And what I’m going to do is, uh, clear out, uh, wait stats and latch stats.

Uh, I’m going to query, uh, wait stats for the server. Uh, and then I’m going to run, I’m going to query the linked server here using open query. And then I’m going to select, uh, from the wait stats DMV here.

So if I clear everything out and I’m the only person on the server, it’s just me, nothing else is going on. And this happens quickly enough that I’m confident that it’s my query doing the parallelism. Uh, the first run through of wait stats after I clear everything out is all zeros.

And then the second run after I execute my query and re query the wait stats, I do have some parallel query weights and that’s pretty consistent across like every execution of this seems to end up with just about the same amount of CX sync port, CX sync packet, all that stuff.

If I keep executing this, the, the, these weights stay close enough that I’m, you know, I can confidently say that’s my query doing it, right? It stays pretty, pretty close to, uh, what it is.

Uh, if we kind of go back up a little bit here to where it’s quoted out and the reason I have this is just to show that one query, like the query that I’m executing does go parallel is, uh, well, actually, you know what, we’re not even gonna, we’re not gonna bother running, uh, oh, actually, I finished.

What, what the hell? So if we look at these two, uh, query plans, the version of the query that just touches the base table on the, on the server itself without using the remote query stuff, uh, that does go fully parallel.

So, um, this is about 238 milliseconds of, uh, execution time. So I do believe that the 300 or so milliseconds of parallel query time is close enough to this, that that would, that would indicate that it was my query that was responsible for it.

But if we look at the query plan for the, uh, remote server query, uh, we can, we do see that locally, the query that calls the remote server can’t go parallel. That restriction is local to where you call the linked server, but on the linked server, the query over there can, can run in parallel.

So again, only about half right on that one. Now, uh, I think the final thing that I want to talk about are fast forward cursors. Now, this is one part where, again, the table is more helpful than the documentation source, because we have, uh, where is it?

No parallel fast forward cursor is a reason in the documentation here, but it’s a little weird that the documentation up here only mentions dynamic cursors. All right. So that’s a, that’s a little strange, especially because when you go to that, uh, go to the documentation about cursors, there’s no mention if a fast forward cursor is a dynamic cursor, which might be something helpful to mention. So if I run this and everyone can be impressed by how blazing fast my query, my, my cursor was look at, look at that fast cursor execution. Uh, and we look at the properties here. Uh, we will see the, the, the, uh, warning that I highlighted before the no parallel fast forward cursor that does indeed restrict a parallel plan, but, uh, that is not really, uh, that is not really documented well over on the, uh, the learn site. So, uh, that that’s pretty much the end of it there. Um, you know, uh, there’s a written version of this post with all the demo scripts in it coming out, uh, around the same time that this will, this, this will be coming out. So, uh, if you want to dig in further on any of the scripts, see how things work there. You can, um, you can, uh, you can follow along that blog post. This is just the video version of it, which, uh, walks through stuff.

I don’t know. Some people like videos better. Uh, me, I’m, I’m just mostly trying to get the, uh, the video set up exactly how I want it here and also, uh, get, get back into getting used to recording things because, uh, I let that slide for a really long time because, uh, various reasons that I’ll hopefully get to talk about it past some. But anyway, uh, that’s it for today. Uh, I’m going to, um, go drink some water. Parched. Dry in here. Hear it. Anyway, thanks for watching. Hope you learned something. Hope you enjoyed yourselves. Uh, and I will see you in another video. Uh, I don’t know.

Maybe, maybe tomorrow, maybe later today. We’ll see what happens. See how, we’ll see how, uh, see how motivated I’m feeling after some nice, nice New York tap water. All right. Thanks for watching.

Going Further


If this is the kind of SQL Server stuff you love learning about, you’ll love my training. Blog readers get 25% off the Everything Bundle — over 100 hours of performance tuning content. Need hands-on help? I offer consulting engagements from targeted investigations to ongoing retainers. Want a quick sanity check before committing to a full engagement? Schedule a call — no commitment required.
YouTube Days: Cardinality Estimation For Local Variables And Parameters

Cardinality Estimation For Local Variables And Parameters


I’m working on ramping up my recording and streaming setup now that life has settled down a little bit, and publishing the results to YouTube while I work out the wrinkles. Enjoy some free video content!

Video Summary

In this video, I delve into the nuances of local variables in SQL Server stored procedures, offering a fresh perspective on their usage and potential pitfalls. Typically, my discussions focus on how local variables can affect cardinality estimation when used instead of parameters or literal values for filtering queries. However, this time around, I explore scenarios where local variables are mixed with parameters, highlighting the impact on query plans and performance. By running through several examples using parameterized dynamic SQL, I demonstrate how local variables can lead to poor cardinality estimates, especially when dealing with large result sets. The video also touches on a new optimizer feature in SQL Server 2022 called parameter-sensitive plan optimization, explaining why local variables can break this functionality and suggesting that they should not be used as a workaround for parameter sniffing issues.

Full Transcript

Erik Darling here with Darling Data. I’ve been busy the last few months fending off various hostile takeover attempts by BeerGut Magazine. Despite their best efforts, I don’t think that a six-pack is quite enough compensation for the glorious Darling Data brand, despite what GoDaddy tells me my domain is worth, which may be about the price of the six-pack, depending on local factors. Erik Darling here with me, I’m recording this video today to talk a little bit, well, talk about local variables in a slightly different way than I usually talk about them. Usually when I talk about them, it’s in the context of, like, there just being one local variable, how SQL Server deals with cardinality estimation when local variables are being used in place of parameters or literal values for filtering queries. Erik Darling here with me, I see this a lot when helping clients tune store procedures where, and again, the clients are nice people who keep my lawyers afloat so that I can fend off BeerGut Magazine hostile takeover attempts. But I see them a lot in store procedures to do something like this, like, where someone just didn’t feel like typing data at day minus one over and over again because they’re going to use it in a bunch of different queries to filter stuff out. So the query, having a good time. The query is end up looking something like this, where on one side you have a local variable like this being used and on the other side you have a parameter that gets passed into the store procedure being used. So I’m going to use a slightly different example to demonstrate what happens sometimes when you mix local variables and parameters in your where clause. Now, for these queries, I’m going to use the nice, safe, happy parameterized dynamic SQL that will keep your SQL injection attempts at bay. So everyone can rest safely and soundly knowing that. And I’m going to start off using values for my filtering that only get one row back from the user’s table. I’ve got two parameters that I’m going to pass into my dynamic SQL here. I’ve got one for upvotes and one for downvotes. And I’ve got a few different iterations of the dynamic SQL that I’m going to run to sort of use as examples here. Now every time I run this, the code in this, I’m going to clear out the plan cache. So they’re going to get a brand new query plan for each time this group of queries executes. But we’ve got this first one here. And this one is going to use parameters for both filtering on upvotes and downvotes. So the values that get passed in from here are what get get get get uses parameters in here.

And then I’m going to switch off having one use upvotes as a local variable as a filtering parameter. And then another one where I do the same thing with downvotes. So I get that there and we can see the local variable being used there. And then I’ve got a final one where both of them use local variables. So these both get the local variable doodad cardinality estimation used. Doodad. Professional, right? So I’m going to run this. And we’re going to look at the query plans together. And what did I do? Oh, did I have something highlighted? I did probably. There we go. Second time’s a charm. Much like me.

So let’s look at these query plans. And hopefully my zoom it skills are still fairly sharp. So we’ve got not too bad. So we’ve got this first query up here that uses parameters for both upvotes and downvotes. And we see that we get a guess of one for both of these. We also get a guess of one for both of the two, both of the queries where one of the parameters was substituted with a local variable. So we’ve got one here and we’ve got one here, but we’ve also got a regular parameter passed in on the flip side. So like there’s downvotes as a parameter there and there’s upvotes as a parameter there.

Only the ones that end in underscore v are the locally declared variables to the batch. Cool. So these both also get a correct guess of one because both of, because SQL Server is able to use the upvotes and downvotes. So it’s a cardinality estimation for the parameters to kind of guess one row and everything goes okay because of that. There’s not too much room for error when you have a single row that gets evaluated. But the last one, all the way down at the bottom where local variables get used for both upvotes and downvotes predicates here, you get a guess of 45.

So SQL Server where it no longer uses like the good part of the histogram to make a cardinality estimate. It uses the density vector stuff that the density vector math for both local variables. Things get thrown off a little bit. In this case, it’s just not the end of the world. Getting one row back when you expect 45 rows, it’s not that big a deal. Go away, zoom it. I’ve got a couple posts that talk about some of these things. They’re in this script file, but they’re here to remind me to put them in the show notes.

So those will be links in the YouTube video blog post wherever this ends up. We’ll see. See how wild I feel later. But those will be available there. Anyway, let’s change this a little bit because when you get when you’re just getting one row back, pretty rare for everything to like fly really badly off the rails. But what I’m going to do is I’m going to replace both of these with zero. And the reason I’m going to do that is because there are a lot more rows where upvotes and downvotes are zero for users because a lot of folks join stack, stack overflow, stack exchange, ask a question, get downvoted into oblivion, never come back, never cast votes, never do anything.

So there’s a whole lot of people qualify for these zero filters here. And this is where things get a little bit more dangerous, right? So like for low numbers of rows, almost any plan is going to be okay. For a big number of rows, it’s less okay. And I see people use this a lot and try to say, well, I did it to fix a parameter sniffing problem. Like, well, if all you’re ever getting back is a small number of rows, you probably don’t have much of a parameter sniffing problem anyway, because the parameter sniffing problem comes from when you have giant variations and how many rows might come back depending on the search argument.

So if you’re just always working with a relatively small number of rows, like you can’t just say, blanket, I have a parameter sniffing problem, because most of the time parameter sniffing is a good and fine thing. You get plan reuse, SQL Server uses the same plan, doesn’t set your CPUs on fire, generating execution plans over and over again, much like a recompile hint would or something like that. So let’s look at these queries now when we are dealing with more rows than just one.

Now, we’re going to get all four results back. And since I don’t have an order by on any of these queries, like we don’t like we don’t, we’re not going to get results back in the same order for any of them. This is actually also kind of a good lesson, like aside from, you know, the local variable thing is this one, the reputation is all scrambled here.

And this one reputation is in fairly decent order. This one reputation is a bit more scrambled here. And in this final one reputation is back to sort of being in order.

And we’ll talk about why when we look at the query plans. But let’s go look at how these performed. Now, the top query makes a startlingly good cardinality estimate only off by 10%. Not bad SQL Server, right?

Good for you SQL Server. But this all finishes pretty quickly. Since I’m using SQL Server 2022, I’m in compat level 160. I get and I’m using developer edition, which is the equivalent of enterprise edition.

I get batch mode on rowstore for some of these queries here. You can see the actual and estimated execution modes are both batch. So batch mode for rowstore kicks in and SQL is like, oh, I have to do some extra work.

Let’s batch mode this baby up. Talking more about batch modes a little bit further than I want to get in this thing. But, you know, whatever.

We can talk more about that later. But what happens is for the other queries SQL Server makes less and less of a good guess for what’s going to come out of these operations that do the filtering. So the second query, the second query plan rather, this is an astoundingly bad guess, right?

SQL Server kind of only made an okay guess for one of the parameters, not for both. And when you combine the cardinality estimates that it came back with and SQL Server was like, well, there’s two of them. I carry the two.

450. But 450 is an astoundingly bad guess. And because of this, we get a less than ideal query plan that takes round about three seconds to finish. Now, there is no mix of batch mode and rowstore.

All of this thing runs entirely in rowstore. I believe one of the seeks might be batch mode, but it’s really neither here nor there whether that happened. But the important thing is that the reason why this second query result set, which is this one.

Well, it’s identical to this one, but we’ll see they have identical query plans. The reason why this comes back in order is, of course, because SQL Server performs a sort by reputation to satisfy the stream aggregate that happens next. The hash match aggregate returns rows back whatever.

There’s no ordering, nothing like that. So you just get rows splatted back to you and you can sort them in the application. Right? That’s what all the smart people say to do.

This third query where, again, result sets were a bit scrambled. We also get a pretty lousy cardinality estimate on this one of 852 rows. But we can see very clearly from the results that we got 1782285.

So 1.78 million back from that. It’s a seven digit number, right? Yes.

That many. Seven. 10 minus three. Got nervous there. I thought maybe I was missing a finger or something. Anyway. So again, we get the hash match aggregate back. We get the hash match operator in this query plan.

So this one, again, was another one that came back with the sort of scrambled results because there’s no ordering to what comes out of a hash match. The third query, which uses both, or sorry, the fourth query plan, which uses a local variable for both upvotes and downvotes, gets, again, a pretty astoundingly bad cardinality estimate of 45 rows out of 1.78 million. Things fall apart a little bit more here.

Sorry, I don’t know why this thing keeps jumping around like that. I’m going to have to highlight. Just the magic of highlighting for context. The sort spills a little bit here, and this thing ends up taking around about three seconds. So even when we use both local variables, that’s what happens in this fourth one.

Things are obviously at their worst because we get this sort of lousy cardinality estimate for both of the local variables. But even for when we mix and match or mismatch or whatever, however you want to talk about, we still get pretty bad cardinality estimates. We don’t get very good query plans.

The top plan, even though it’s a clustered index scan, makes the most sense here because we don’t have to do a bunch of lookups to get a bunch of other rows. And especially because the cardinality estimates for all of these lookup plans are so low. We also have relatively low subtree costs.

So this one, SQL Server thinks this one’s going to cost about $1.50. SQL Server thinks this one is going to cost about $2.8 query bucks. And we get like just low costs on all of these.

So SQL Server is not even choosing like a parallel lookup plan, which probably would have helped here. But again, is that really what you want all the time? Maybe, maybe not. Probably a little bit more than we can talk about here.

Anyway. Yeah. So using local variables often results in pretty bad cardinality estimates. Sometimes you will not notice them because other parameters or other arguments might filter, either filter out enough rows so that a bad plan choice might not matter.

Or you might just get like you might just be working with a generally small set, small number of rows anyway. So you don’t really have all the problems that you run into when you start working with a larger number of rows. One small thing that I want to point out here before I sign off is that when you use local variables, you also break a new optimizer feature in SQL Server 2022 called the parameter sensitive plan optimization.

And I’ll show you real quick what I mean by that. All three of the queries that have at least one local variable involved just sort of end where the query text ends. This top query plan, return control ever comes back to me, has a little bit more stuff in it, right?

We can see all this plan per value object ID, blah, blah, query variant ID. If we click on this little ellipsis over here and we get all this stuff back, we’ll see what SQL, this is what SQL Server injects into the query text to enable multiple plans for the same query so that we get, we get a better optimized plan for different sets of parameters that have different cardinality estimates involved with them. But using a local variable, even just one of them does break the parameter sensitive plan optimization.

So just something to be aware of there. If you’re using SQL Server 2022 and you expect this magical parameter sensitive thing to kick in and fix all of your bad parameter sniffing queries, using local variables will mess that up. So please don’t do that.

Please don’t fix parameter sniffing by using local variables and then expect the parameter sensitive plan optimization to kick in and do any more work. For you, it just won’t do that. It does not, does not work that way. Anyway, I think that’s about good for today.

It’s about 15 minutes on this thing, which is about five minutes more than I was aiming for. So, yeah, I don’t know. I’m just gonna, I’m gonna go, I’m gonna go now and think about my life. Think about why I talked for five minutes more than I should have.

Hopefully you didn’t find it to be a waste of time. But anyway, thank you for watching. I hope you learned something. And I will see you in the next video. I’ve got a bunch of stuff lined up to record. So, yeehaw.

Hopefully that’s… H

Going Further


If this is the kind of SQL Server stuff you love learning about, you’ll love my training. Blog readers get 25% off the Everything Bundle — over 100 hours of performance tuning content. Need hands-on help? I offer consulting engagements from targeted investigations to ongoing retainers. Want a quick sanity check before committing to a full engagement? Schedule a call — no commitment required.
How Indexes Talk To Each Other In SQL Server

Connections


When one thinks of effective communicators, indexes aren’t usually at the top of the list. And for good reason!

They’re more the strong, silent type. Like Gary Cooper, as a wiseguy once said. But they do need to talk to each other, sometimes.

For this post, I’m going to focus on tables with clustered indexes, but similar communication can happen with the oft-beleaguered heap tables, too.

Don’t believe me? Follow along.

Clustered


This post is going to focus on a table called Users, which has a bunch of columns in it, but the important thing to start with is that it has a clustered primary key on a column called Id.

Shocking, I know.

 CONSTRAINT PK_Users_Id 
 PRIMARY KEY CLUSTERED 
(
    Id ASC
)

But what does adding that do, aside from put the table into some logical order?

The answer is: lots! Lots and lots. Big lots (please don’t sue me).

Inheritance


The first thing that comes to my mind is how nonclustered indexes inherit that clustered index key column.

Let’s take a look at a couple examples of that. First, with a couple single key column indexes. The first one is unique, the second one is not.

/*Unique*/
CREATE UNIQUE INDEX 
    whatever_uq 
ON dbo.Users 
    (AccountId)
WITH
    (MAXDOP = 8, SORT_IN_TEMPDB = ON, DATA_COMPRESSION = PAGE);


/*Not unique*/
CREATE INDEX 
    whatever_nuq 
ON dbo.Users 
    (AccountId)
WITH
    (MAXDOP = 8, SORT_IN_TEMPDB = ON, DATA_COMPRESSION = PAGE);

For these queries, pay close attention to the where clause. We’re searching on both the AccountId column that is the only column defined in our index, and the Id column, which is the only column in our clustered index.

SELECT
    records = COUNT(*)
FROM dbo.Users AS u WITH (INDEX = whatever_uq)
WHERE u.AccountId = 1
AND   u.Id = 1;

SELECT
    records = COUNT(*)
FROM dbo.Users AS u WITH (INDEX = whatever_nuq)
WHERE u.AccountId = 1
AND   u.Id = 1;

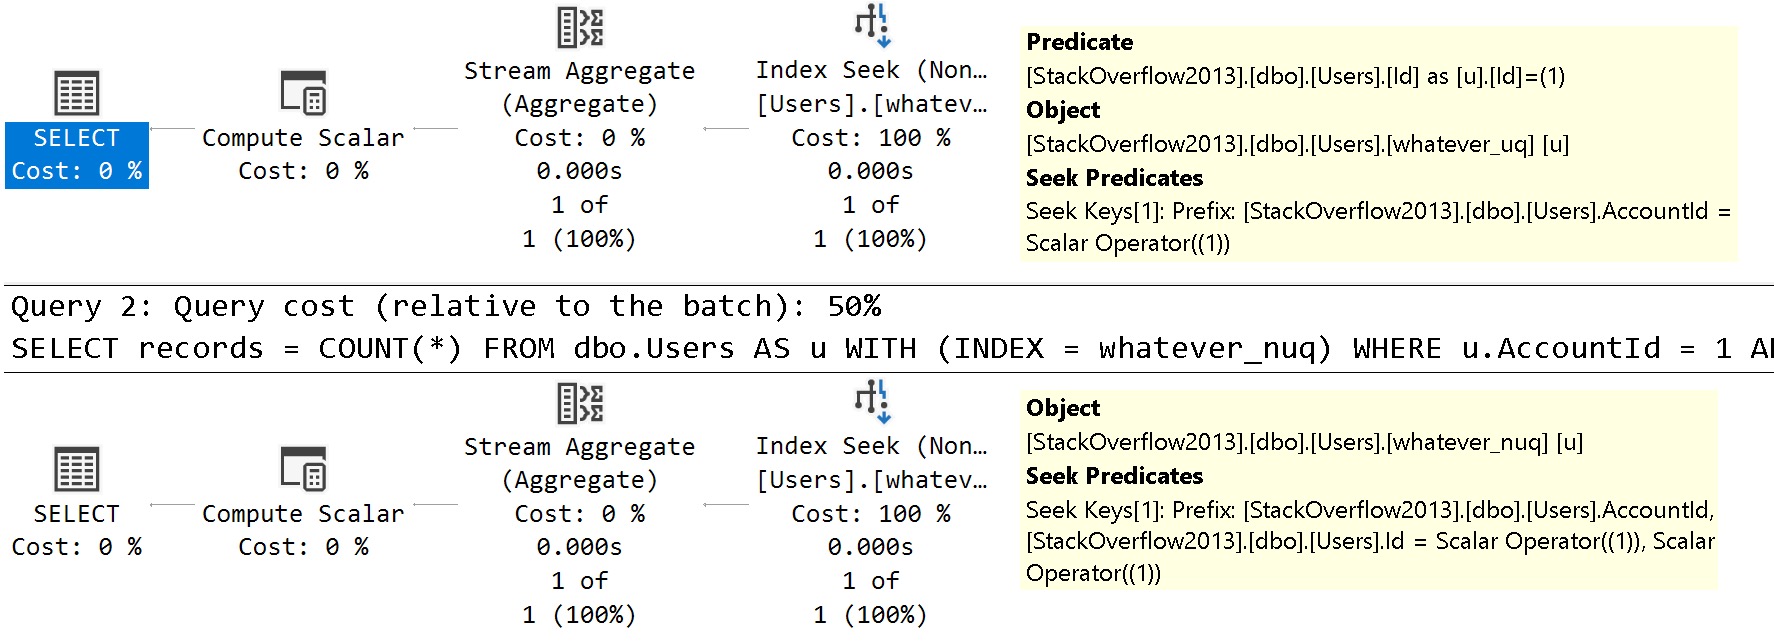
The query plans are slightly different in how the searches can be applied to each index.

SQL Server Query Plan
dedicated

See the difference?

  • In the unique index plan, there is one seek predicate to AccountId, and one residual predicate on Id
  • In the non-unique index plan, there are two seeks, both to AccountId and to Id

The takeaway here is that unique nonclustered indexes inherit clustered index key column(s) are includes, and non-unique nonclustered indexes inherit them as additional key columns.

Fun!

Looky, Looky


Let’s create two nonclustered indexes on different columns. You know, like normal people. Sort of.

I don’t usually care for single key column indexes, but they’re great for simple demos. Remember that, my lovelies.

CREATE INDEX
    l
ON dbo.Users
    (LastAccessDate)
WITH
    (MAXDOP = 8, SORT_IN_TEMPDB = ON, DATA_COMPRESSION = PAGE);

CREATE INDEX
    c
ON dbo.Users
    (CreationDate)
WITH
    (MAXDOP = 8, SORT_IN_TEMPDB = ON, DATA_COMPRESSION = PAGE);

How will SQL Server cope with all that big beautiful index when this query comes along?

SELECT
    c = COUNT_BIG(*)
FROM dbo.Users AS u
WHERE u.CreationDate  >= '20121231'
AND   u.LastAccessDate < '20090101';

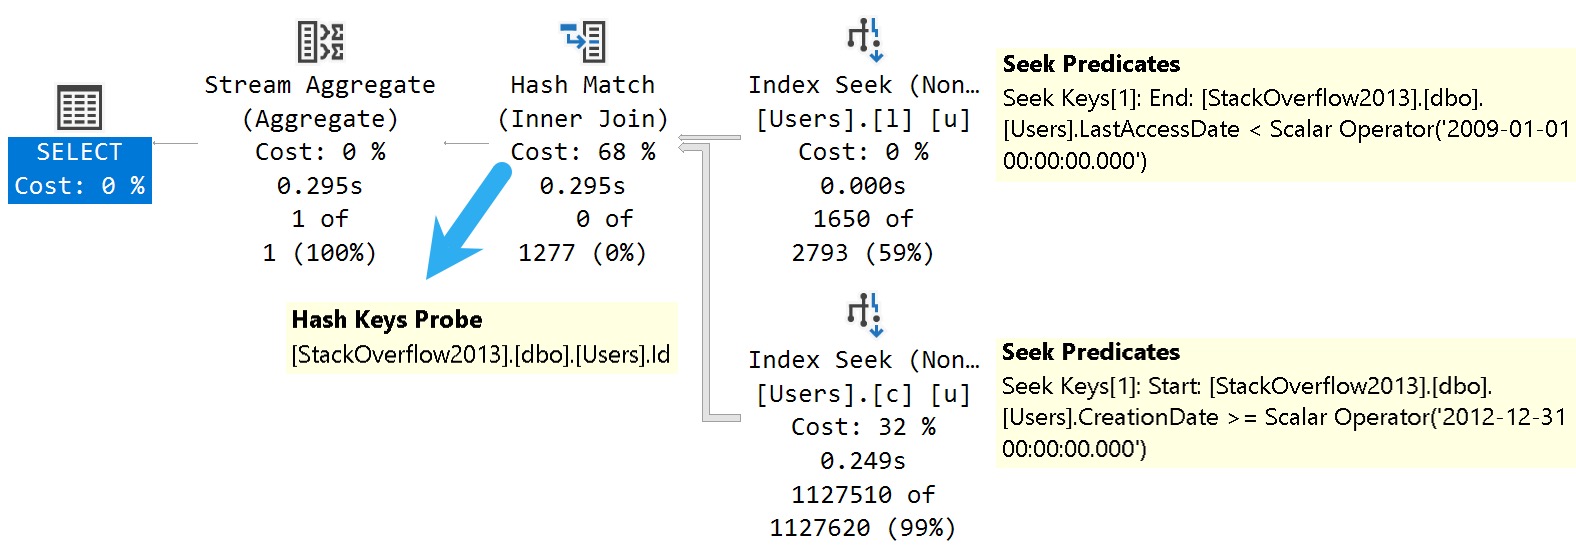
How about this bold and daring query plan?

SQL Server Query Plan
indexified!

SQL Server joins two nonclustered indexes together on the clustered index column that they both inherited. Isn’t that nice?

Danes


More mundanely, this is the mechanism key lookups use to work, too. If we change the last query a little bit, we can see a great example of one.

SELECT
    u.*
FROM dbo.Users AS u
WHERE u.CreationDate  >= '20121231'
AND   u.LastAccessDate < '20090101';

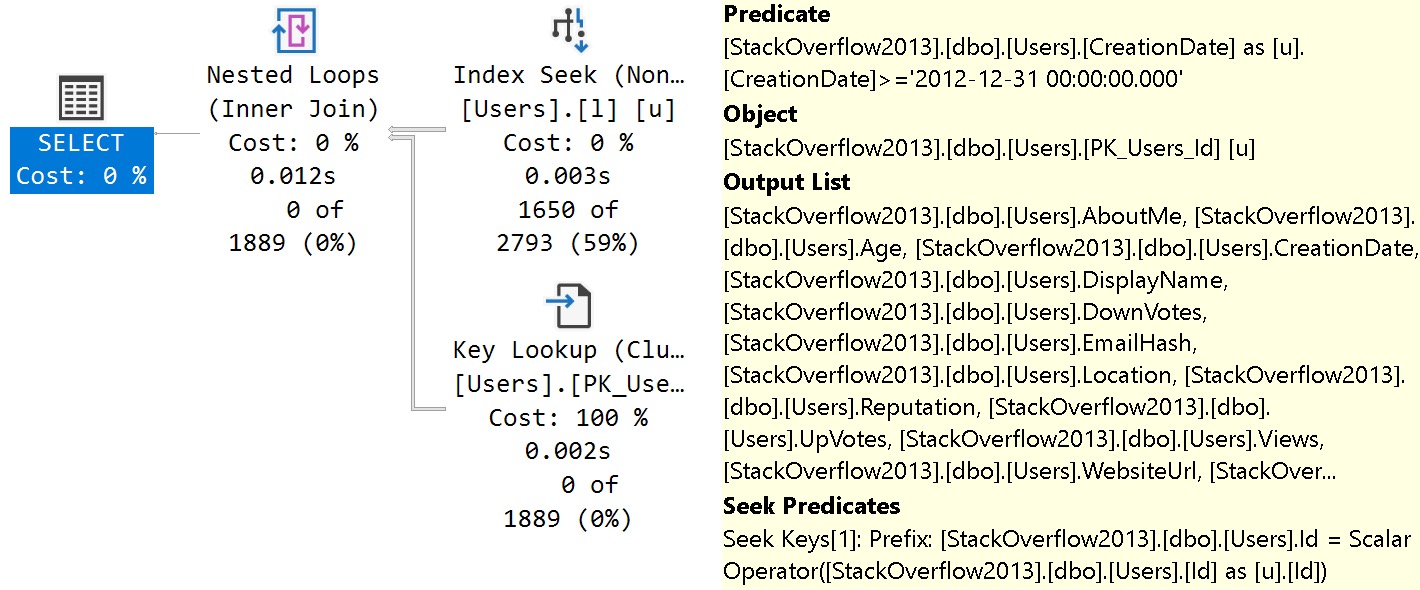
Selecting all the columns from the Users table, we get a different query plan.

SQL Server Query Plan
uplook

The tool tip pictured above is detail from the Key Lookup operator. From the top down:

  • Predicate is the additional search criteria that we couldn’t satisfy with our index on Last Access Date
  • Object is the index being navigated (clustered primary key)
  • Output list is all the columns we needed from the index
  • Seek Predicates define the relationship between the clustered and nonclustered index, in this case the Id column

And this is how indexes talk to each other in SQL Server. Yay.

Thanks for reading!

Going Further


If this is the kind of SQL Server stuff you love learning about, you’ll love my training. Blog readers get 25% off the Everything Bundle — over 100 hours of performance tuning content. Need hands-on help? I offer consulting engagements from targeted investigations to ongoing retainers. Want a quick sanity check before committing to a full engagement? Schedule a call — no commitment required.
Monitoring SQL Server For Query Timeouts With Extended Events

Ready Or Not


Most applications have a grace period that they’ll let queries run for before they time out. One thing that I notice people really hate is when that happens, because sometimes the effects are pretty rough.

You might have to roll back some long running modification.

Even if you have Accelerated Database Recovery enabled so that the back roll is instant, you may have have 10-30 seconds of blocking.

Or just like, unhappy users because they can’t get access to the information they want.

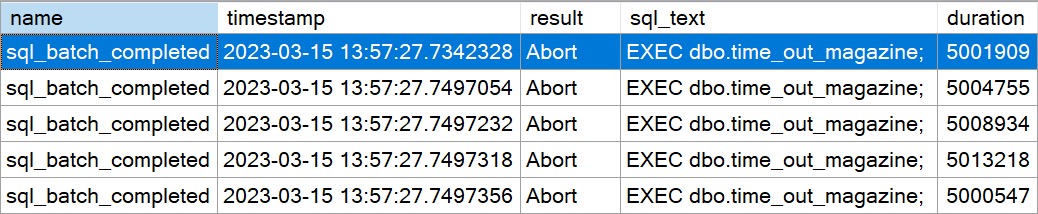
Monitoring for those timeouts is pretty straight forward with Extended Events.

Eventful


Here’s the event definition I used to do this. You can tweak it, and if you’re using Azure SQL DB, you’ll have to use ON DATABASE instead of ON SERVER.

CREATE EVENT SESSION 
    timeouts
ON SERVER 
ADD EVENT 
    sqlserver.sql_batch_completed
    (
        SET collect_batch_text = 1
        ACTION
        (
            sqlserver.database_name,
            sqlserver.sql_text
        )
        WHERE result = 'Abort'
    )
ADD 
    TARGET package0.event_file 
          (
              SET filename = N'timeouts'
          )
WITH 
(
    MAX_MEMORY = 4096 KB,
    EVENT_RETENTION_MODE = ALLOW_SINGLE_EVENT_LOSS,
    MAX_DISPATCH_LATENCY = 5 SECONDS,
    MAX_EVENT_SIZE = 0 KB,
    MEMORY_PARTITION_MODE = NONE,
    TRACK_CAUSALITY = OFF,
    STARTUP_STATE = OFF
);
GO

ALTER EVENT SESSION timeouts ON SERVER STATE = START;
GO

There are a ton of other things you can add under ACTION to identify users running the queries, etc., but this is good enough to get us going.

The sql_batch_completed event is good for capturing “ad hoc” query timeouts, like you might see from Entity Framework queries that flew off the rails for some strange reason 🤔

If your problem is with stored procedures, you might want to use rpc_completed or sp_statement_completed which can additionally filter to an object_name to get you to a specific procedure as well.

Stressful


To do this, I’m going to use the lovely and talented SQL Query Stress utility, maintained by ErikEJ (b|t).

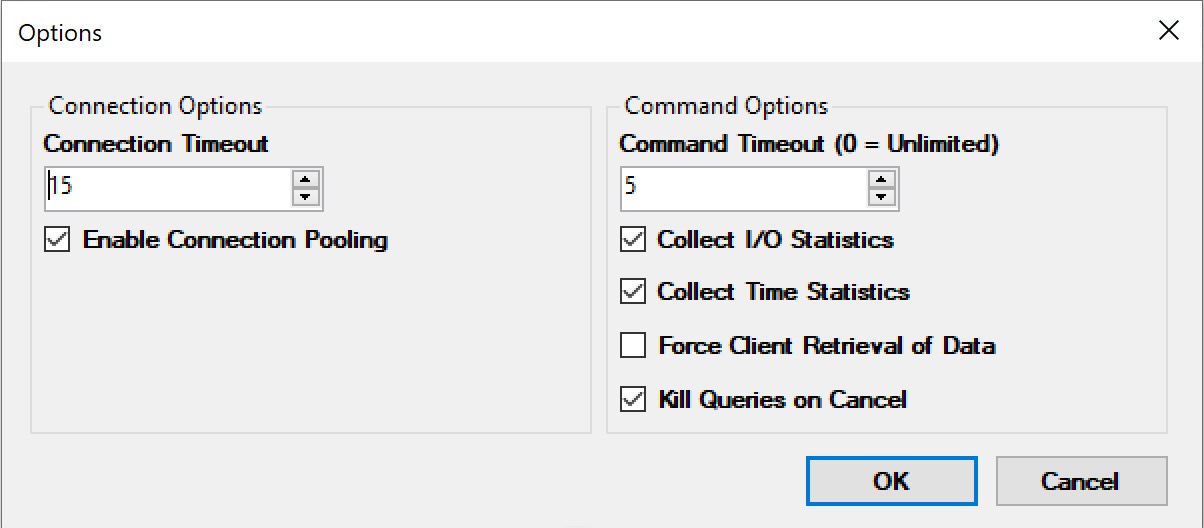
Why? Because the query timeout setting in SSMS are sort of a nightmare. In SQL Query Stress, it’s pretty simple.

SQL Query Stress
command timeout

And here’s the stored procedure I’m going to use:

CREATE OR ALTER PROCEDURE
    dbo.time_out_magazine
AS
BEGIN
    WAITFOR DELAY '00:00:06.000';
END;
GO

Why? Because I’m lazy, and I don’t feel like writing a query that runs for 6 seconds right now.

Wonderful


After a few seconds, data starts showing up in our Extended Event Session Viewer For SSMS Pro Azure Premium For Business 720.

SQL Server Extended Events
caught!

But anyway, if you find yourself hitting query timeouts, and you want a way to capture which ones are having problems, this is one way to do that.

Thanks for reading!

Going Further


If this is the kind of SQL Server stuff you love learning about, you’ll love my training. Blog readers get 25% off the Everything Bundle — over 100 hours of performance tuning content. Need hands-on help? I offer consulting engagements from targeted investigations to ongoing retainers. Want a quick sanity check before committing to a full engagement? Schedule a call — no commitment required.
How To Find Poorly Performing SQL Server Queries To Tune Using Query Store

Stick And Move


If you take performance for your SQL Servers seriously, you should be using Query Store for your business critical databases.

I used to say this about third party monitoring tools, but the landscape for those has really tanked over the last few years. I used to really love SQL Sentry, but it has essentially become abandonware since SolarWinds bought SentryOne.

At this point, I’m happier to enable query store, and then use a couple extended events to capture blocking and deadlocks. While it would be stellar if Query Store also did that, for now life is easy enough.

To analyze blocking and deadlock Extended Events, I use:

This won’t capture absolutely everything, but that’s okay. We can usually get enough to go on with those three things. If you have bad blocking and deadlocking problems, you should start there.

But once you turn on Query Store, where do you go?

Gooey


If you’re okay with all the limitations of the GUI, you can tweak a few things to get more useful information out of it.

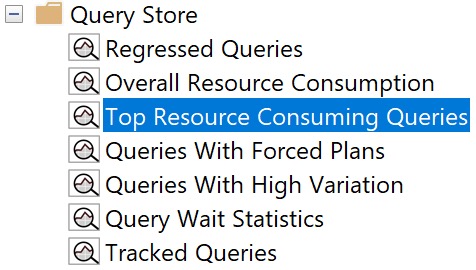
I usually start with the Top Resource Consuming Queries view, since, uh… those are usually good things to tune.

SQL Server Query Store
top resource consuming plans

But the crappy bar graph that Query Store defaults to is not what you want to see. There’s way too much jumping around and mousing over things to figure out what’s in front of you.

I like switching to the grid format with additional details view, by clicking the blue button like so:

SQL Server Query Store
additional details!

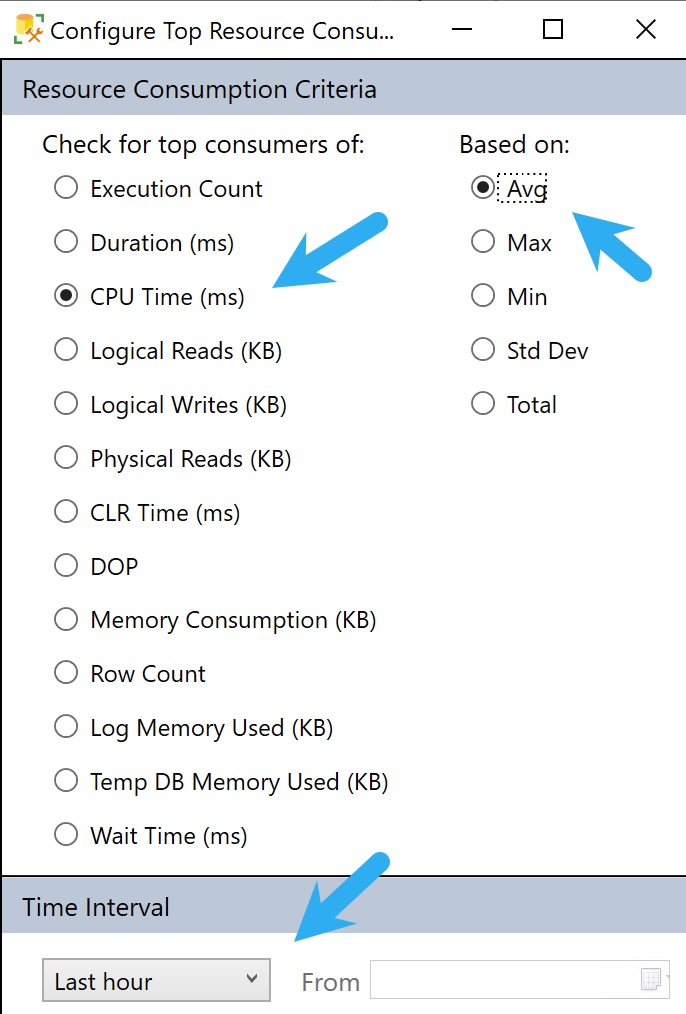
But we’re not done yet! Not by a long shot. The next thing we wanna do is hit the Configure button, and change what we’re looking at. See, the other crappy thing is that Query Store defaults to showing you queries by total duration.

What ends up being in here is a bunch of stuff that runs a lot, but tends to run quickly. You might get lucky and find some quick wins here, but it’s usually not where the real bangers live.

To get to those, we need to hit the Configure button and make a couple tweaks to look at queries that use a lot of CPU on average, and push the time back from only showing the last hour to the last week or so.

You can go back further, but usually the further you go back, the longer it takes to get you results.

SQL Server Query Store
configurator

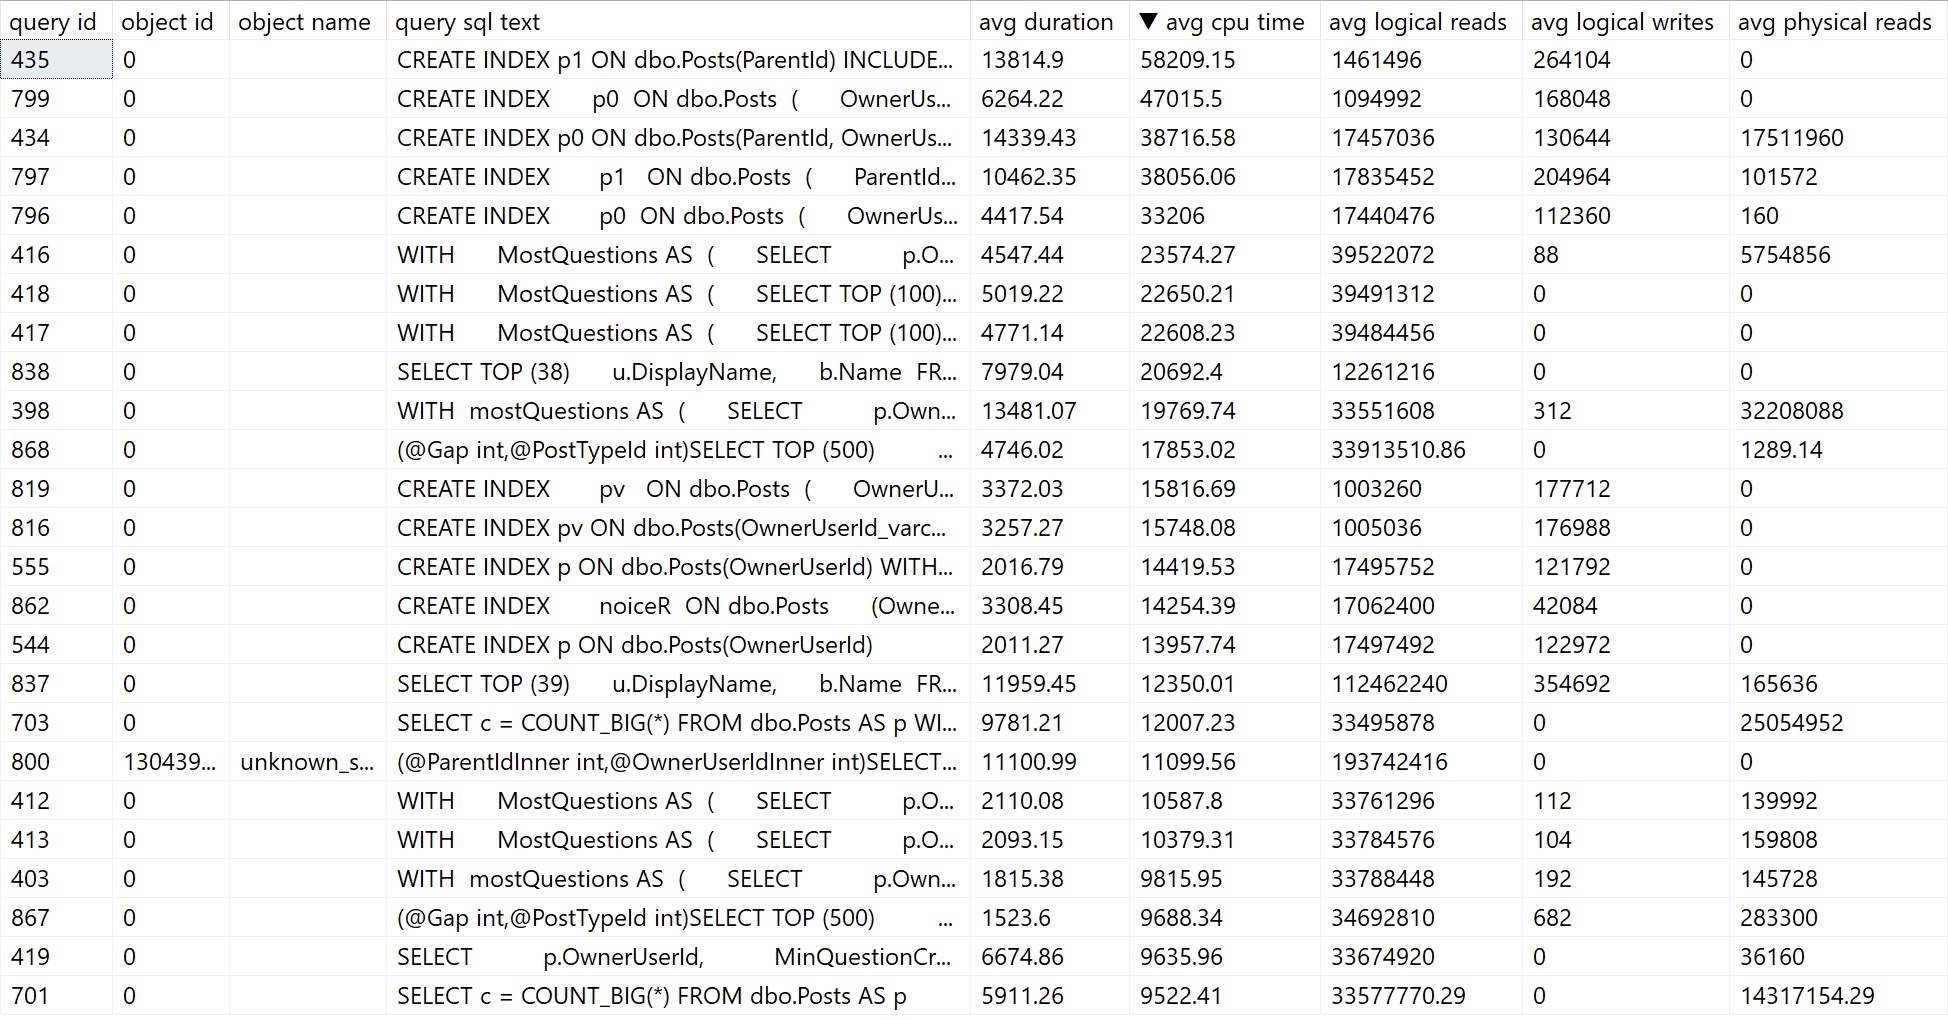
The problem here is that you can often get back quite a bit of noise that you can’t filter out or ignore. Here’s what mine looks like:

SQL Server Query Store
noise noise noise

We don’t really need to know that creating indexes took a long time. Substitute those with queries you don’t necessarily care about fixing, and you get the point.

You can sort of control this by only asking for queries with a certain number of plans to come back, but if your queries aren’t parameterized and you have a lot of “single use” execution plans, you’ll miss out on those in the results.

SQL Server Query Store
min-maxing

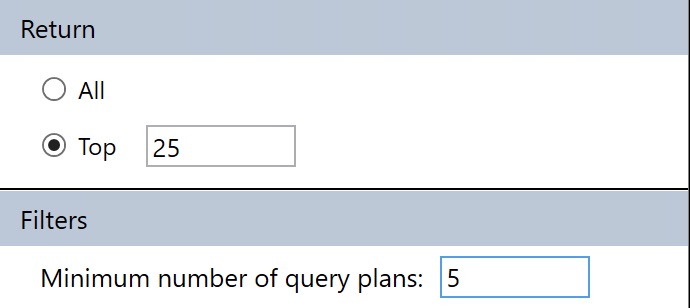
This filter is available under the Configuration settings where we changes the CPU/Average/Dates before.

The major limitation of Query Store’s GUI is that you can’t search through it for specific problems. It totally could and should be in there, but as of this writing, it’s not in there.

That’s where my stored procedure sp_QuickieStore comes in.

Scripted, For Your Pleasure


The nice thing about sp_QuickieStore is that it gets rid of a lot of the click-clacking around to get things set up. You can’t save your Query Store GUI layout to open up and show you what you want every time, you have to redo it.

To get us to where we were with the settings above, all we have to do is this:

EXEC sp_QuickieStore
    @execution_count = 5;

By default, sp_QuickieStore will already sort results by average CPU for queries executed over the last week of Query Store data. It will also filter out plans for stuff we can’t really tune, like creating indexes, updating statistics, and waste of time index maintenance.

You’ll get results that look somewhat like so:

sp_QuickieStore
to the rescue!

There are a number of things you can do with  to include or ignore only certain information, too:

  • @execution_count: the minimum number of executions a query must have
  • @duration_ms: the minimum duration a query must have
  • @execution_type_desc: the type of execution you want to filter
  • @procedure_schema: the schema of the procedure you’re searching for
  • @procedure_name: the name of the programmable object you’re searching for
  • @include_plan_ids: a list of plan ids to search for
  • @include_query_ids: a list of query ids to search for
  • @ignore_plan_ids: a list of plan ids to ignore
  • @ignore_query_ids: a list of query ids to ignore
  • @include_query_hashes: a list of query hashes to search for
  • @include_plan_hashes: a list of query plan hashes to search for
  • @include_sql_handles: a list of sql handles to search for
  • @ignore_query_hashes: a list of query hashes to ignore
  • @ignore_plan_hashes: a list of query plan hashes to ignore
  • @ignore_sql_handles: a list of sql handles to ignore
  • @query_text_search: query text to search for

You straight up can’t do any of that with Query Store’s GUI. I love being able to focus in on all the plans for a specific stored procedure.

Thanks for reading!

Going Further


If this is the kind of SQL Server stuff you love learning about, you’ll love my training. Blog readers get 25% off the Everything Bundle — over 100 hours of performance tuning content. Need hands-on help? I offer consulting engagements from targeted investigations to ongoing retainers. Want a quick sanity check before committing to a full engagement? Schedule a call — no commitment required.
The SQL Server Documentation About Parallelism Is Misleading

Free Work


Recently I answered a question on Stack Exchange that forced me to read the Microsoft documentation about query parallelism.

When I first read the question, and wrote the answer, I thought for sure that the OP was just misreading things, but no… the documentation was indeed misleading.

And then I had to read more of the documentation, and then I had to write demos to show what I’m talking about.

If you’re on the docs team and you’re reading this, don’t get mad because it’s in a blog post instead of a pull request. I made one of those, too.

Y’all have a lot of work to do, and putting all of this into a pull request or issue would have been dismal for me.

If you want to follow along, you can head to this link.

Constructs


The section with the weirdest errors and omissions is right up at the top. I’m going to post a screenshot of it, because I don’t want the text to appear here in a searchable format.

That might lead people not reading thoroughly to think that I condone any of it, when I don’t.

SQL Server Documentation
0 for 6

Let’s walk through these one by one.

Scalar UDFs


While it’s true that scalar UDFs that can’t be inlined will force the query that calls them to run single-threaded, the work done inside of the scalar UDF is still eligible for parallelism.

This is important, because anyone looking at query wait stats while troubleshooting might see CX* waits for an execution plan that is forced to run single threaded by a UDF.

Here’s a function written with a Common Table Expression, which prevents UDF inlining from taking place.

CREATE OR ALTER FUNCTION
    dbo.AnteUp
(
    @UserId int
)
RETURNS integer
WITH SCHEMABINDING
AS
BEGIN
    DECLARE
        @AnteUp bigint = 0;

    WITH
        x AS
    (
        SELECT
            p.Score
        FROM dbo.Posts AS p
        WHERE p.OwnerUserId = @UserId
          UNION ALL
        SELECT
            c.Score
        FROM dbo.Comments AS c
        WHERE c.UserId = @UserId
    )
    SELECT
        @AnteUp =
            SUM(CONVERT(bigint, x.Score))
    FROM x AS x;

    RETURN @AnteUp;
END;

Getting the estimated execution plan for this query will show us a parallel zone within the function body.

SELECT
    u.DisplayName,
    TotalScore =
        dbo.AnteUp(u.AccountId)
FROM dbo.Users AS u
WHERE u.Reputation >= 500000;

If you get an actual execution plan, you can’t see the work done by the scalar UDF. This is sensible, since the function can’t be inlined, and the UDF would run once per row, which would also return a separate query plan per row.

For functions that suffer many invocations, SSMS may crash.

SQL Server Query Plan
query and function

The calling query runs single threaded with a non-parallel execution plan reason, but the body of the function scans both tables that it touches in a parallel zone.

The documentation is quite imprecise in this instance, and many of the others in similar ways.

Remote Queries


This one is a little tough to prove, and I’ll talk about why, but the parallelism restriction is only on the local side of the query. The portion of the query that executes remotely can use a parallel execution plan.

The reasons why this is hard to prove is that getting the execution plan for the remote side of the query doesn’t seem to be an easy thing to accomplish.

I couldn’t find a cached execution plan for my attempts, nor could I catch the query during execution with a query plan attached to it using the usual methods.

Here’s what I did instead:

  • Create a loopback linked server
  • Clear wait stats
  • Query wait stats
  • Run my linked server/openquery query
  • Query wait stats again

Here’s the linked server:

DECLARE 
    @ServerName sysname = 
    (
        SELECT 
            CONVERT
            (
                sysname, 
                SERVERPROPERTY(N'ServerName')
            )
    );

EXEC sp_addlinkedserver 
    @server = N'loop',
    @srvproduct = N' ',
    @provider = N'SQLNCLI', 
    @datasrc = @ServerName;
GO

Here’s the query stuff:

DBCC SQLPERF('sys.dm_os_wait_stats', CLEAR);
GO 

SELECT
    dows.wait_type,
    dows.waiting_tasks_count,
    dows.wait_time_ms,
    dows.max_wait_time_ms,
    dows.signal_wait_time_ms
FROM sys.dm_os_wait_stats AS dows
WHERE dows.wait_type LIKE N'CX%'
ORDER BY dows.wait_time_ms DESC;
GO 

SELECT TOP (1000)
    u.Id
FROM loop.StackOverflow2013.dbo.Users AS u
ORDER BY
    u.Reputation
GO
SELECT 
    u.*
FROM
OPENQUERY
(
    loop,
    N'
        SELECT TOP (1000)
            u.Id,
            u.Reputation
        FROM loop.StackOverflow2013.dbo.Users AS u
        ORDER BY
        	u.Reputation;
    '
) AS u;
GO

SELECT
    dows.wait_type,
    dows.waiting_tasks_count,
    dows.wait_time_ms,
    dows.max_wait_time_ms,
    dows.signal_wait_time_ms
FROM sys.dm_os_wait_stats AS dows
WHERE dows.wait_type LIKE N'CX%'
ORDER BY dows.wait_time_ms DESC;

You can quote in/out either the linked server or the OPENQUERY version, but each time a consistent amount of parallel query waits were returned by the second wait stats query.

Given that this is a local instance with no other activity, I’m pretty confident that I’m right here.

Dynamic Cursors


It is true that dynamic cursors will prevent a parallel execution plan, but the documentation leaves out that fast forward cursors will also do that.

That does get noted in the table of non-parallel execution plan reasons decoder ring a little further down, but it’s odd here because only one type of cursor is mentioned, and the cursor documentation itself doesn’t say anything about which cursors inhibit parallelism.

Bit odd since there’s a note that tells you that you can learn more by going there.

DECLARE
    ff CURSOR FAST_FORWARD
FOR
SELECT TOP (1)
    u.Id
FROM dbo.Users AS u
ORDER BY u.Reputation DESC

OPEN ff;

FETCH NEXT 
FROM ff;

CLOSE ff;
DEALLOCATE ff;

Anyway, this cursor gives us this execution plan:

SQL Server Cursor Query Plan
out of luck

Which has a non parallel execution plan reason that is wonderfully descriptive.

Recursive Queries


This is only partially true. The “recursive” part of the CTE cannot use a parallel execution plan (blame the Stack Spool or something), but work done outside of the recursive common table expression can.

Consider this query, with a recursive CTE, and then an additional join outside of the portion that achieved maximum recursion.

WITH
    p AS
(
    SELECT
        p.Id,
        p.ParentId,
        p.OwnerUserId,
        p.Score
    FROM dbo.Posts AS p
    WHERE p.Id = 184618

    UNION ALL

    SELECT
        p2.Id,
        p2.ParentId,
        p2.OwnerUserId,
        p2.Score
    FROM p
    JOIN dbo.Posts AS p2
      ON p.Id = p2.ParentId
)
SELECT
    p.*,
    u.DisplayName,
    u.Reputation
FROM p
JOIN dbo.Users AS u
  ON u.Id = p.OwnerUserId
ORDER BY p.Id;

In this execution plan, the join to the Users table is done in a parallel zone after the recursive common table expression “completes”:

SQL Server Query Plan
that’s a thing.

These do not force a totally serial execution plan, as the documentation suggests.

Multi-Statement Table Valued Functions


This is another area where the documentation seems to indicate that a completely serial execution plan is forced by invoking a multi-statement table valued function, but they don’t do that either.

They only force a serial zone in the execution plan, both where the table variable is populated, and later returned by the functions. Table variables read from outside of multi-statement table valued functions, and even table variables used elsewhere in the function’s body may be read from in a parallel zone, but the returned table variable does not support that.

Here’s a function:

CREATE OR ALTER FUNCTION
    dbo.BadgerJoin
(
    @h bigint
)
RETURNS
    @Out table
(
    UserId int,
    BadgeCount bigint
)
AS
BEGIN
    INSERT INTO
        @Out
    (
        UserId,
        BadgeCount
    )
    SELECT
        b.UserId,
        BadgeCount =
            COUNT_BIG(*)
    FROM dbo.Badges AS b
    GROUP BY b.UserId
    HAVING COUNT_BIG(*) > @h;
    RETURN;
END;

Here’s a query that calls it:

SELECT
    u.Id,
    o.*
FROM dbo.Users AS u
JOIN dbo.BadgerJoin(0) AS o
    ON o.UserId = u.Id
WHERE u.LastAccessDate >= '20180901';

And here’s the query execution plan:

SQL Server Query Plan
hard knocks life

Again, only a serial zone in the execution plan. The table variable modification does force a serial execution plan, but that is more of a side note and somewhat unrelated to the documentation.

Completion is important.

Top


Finally, the TOP operator is documented as causing a serial execution plan, but it’s only the TOP operator that doesn’t support parallelism.

Consider this query:

SELECT
    *
FROM
(
    SELECT TOP (1)
        u.*
    FROM dbo.Users AS u
    ORDER BY 
        u.Reputation DESC,
        u.Id
) AS u
INNER JOIN
(
    SELECT TOP (1)
        u.*
    FROM dbo.Users AS u
    ORDER BY 
        u.Reputation DESC,
        u.Id
) AS u2
  ON u.Id = u2.Id
ORDER BY
    u.Reputation,
    u2.Reputation;

Both of the derived selects happen fully in parallel zones, but there is a gather streams operator prior to each top operator, to end each parallel zone.

SQL Server Query Plan
DOUBLE TOP!

It would be a little silly to re-parallelize things after the tops going into the nested loops join, but you probably get the point.

You may see some query execution plans where there is a parallel zone, a gather streams operator, a top operator, and then a distribute streams operator to reinitialize parallelism out in the wild.

This is almost no different than global aggregates which also cause serial zones in query plans. Take this query for example:

SELECT 
    s = SUM(x.r)
FROM 
(
    SELECT 
        r = COUNT(*)
    FROM dbo.Users AS u
    WHERE u.Age < 18

    UNION ALL

    SELECT 
        r = COUNT(*)
    FROM dbo.Users AS u
    WHERE u.Age IS NULL
) AS x;

Which gives us this query plan, where each count operation (stream aggregate) occurs in a serial zone immediately after gather streams.

SQL Server Query Plan
vlad

But no one’s getting all riled up and shouting that from the docs pages.

Afterthoughts


There are some other areas where the documentation is off, and it’s a shame that Microsoft didn’t choose to link to the series of index build strategy posts that it has had published locally since ~2006 or so.

But hey. It’s not like the internet is forever, especially when it comes to Microsoft content.

I’ve also submitted a pull request to address other issues in the documentation.

Thanks for reading!

Going Further


If this is the kind of SQL Server stuff you love learning about, you’ll love my training. Blog readers get 25% off the Everything Bundle — over 100 hours of performance tuning content. Need hands-on help? I offer consulting engagements from targeted investigations to ongoing retainers. Want a quick sanity check before committing to a full engagement? Schedule a call — no commitment required.

When Should I Use A Trigger Instead Of A Foreign Key In SQL Server?

Mediation


The really annoying thing about foreign keys is that you can’t do anything to affect the query plans SQL Server uses to enforce them.

My good AND dear friend Forrest ran into an issue with them that I’ve seen played out at dozens of client sites. Sometimes there are actually foreign keys that don’t have indexes to help them, but even when there are, SQL Server’s optimizer doesn’t always listen to reason, or other cardinality estimation issues are at play. Some can be fixed, and some can’t.

When they can’t, sometimes implementing triggers which are more under your control can be used in place of foreign keys.

The following code isn’t totally suitable for production, but is good enough to illustrate examples.

If you need production-ready code, hit the link at the end of the post to schedule a sales call.

Setup


I’m going to use some slightly modified code from Forrest’s post linked above, since that’s what I started with to see if the foreign key issue still presents in SQL Server 2022 under compatibility level 160.

It does! So. Progress, right? Wrong.

CREATE TABLE
    dbo.p
(
    id int
       PRIMARY KEY,
    a char(1),
    d datetime DEFAULT SYSDATETIME()
);

CREATE TABLE
    dbo.c
(
    id int
       IDENTITY
       PRIMARY KEY,
    a varchar(5),
    d datetime DEFAULT SYSDATETIME(),
    pid int,
        INDEX nc NONCLUSTERED(pid)
);

INSERT
    dbo.p WITH(TABLOCKX)
(
    id,
    a
)
SELECT TOP (1000000)
    ROW_NUMBER() OVER
    (
        ORDER BY
            (SELECT 1/0)
    ),
    CHAR(m.severity + 50)
FROM sys.messages AS m
CROSS JOIN sys.messages AS m2;

INSERT
    dbo.c WITH(TABLOCKX)
(
    a,
    pid
)
SELECT TOP (1100000)
    REPLICATE
    (
        CHAR(m.severity + 50),
        5
    ),
    ROW_NUMBER() OVER
    (
        ORDER BY
            (SELECT 1/0)
    ) % 1000000 + 1
FROM sys.messages AS m
CROSS JOIN sys.messages AS m2;

For Fun


With the boring stuff out of the way, let’s skip to how to set up triggers to replace foreign keys.

For reference, this is the foreign key definition that we want to replicate:

ALTER TABLE
    dbo.c
ADD CONSTRAINT
    fk_d_up
FOREIGN KEY 
    (pid)
REFERENCES
    dbo.p (id)
ON DELETE CASCADE
ON UPDATE CASCADE;

While it’s a bit contrived to have an update cascade from what would be an identity value for most folks, we’re gonna run with it here for completeness.

Here at Darling Data we care about completion.

Inserts


I’m a big fan of instead of insert triggers for this, because they take a shortcut around all the potential performance ramifications of letting a thing happen and checking it afterwards.

Now, you’re going to notice that this trigger silently discards rows that would have violated the foreign key. And you’re totally right! But it’s up to you to decide how you want to handle that.

  • Ignore them completely
  • Log them to a table
  • Correct mismatches via lookup tables

Anyway, here’s the basic trigger I’d use, with hints included to illustrate the points from above about you getting control of plan choices.

CREATE OR ALTER TRIGGER
    dbo.instead_insert
ON
    dbo.c
INSTEAD OF INSERT
AS
BEGIN
    IF @@ROWCOUNT = 0
    BEGIN
        RETURN;
    END;

    SET NOCOUNT ON;

    INSERT
        dbo.c
    (
        a,
        pid
    )
    SELECT
        i.a,
        i.pid
    FROM Inserted AS i
    WHERE EXISTS
    (
        SELECT
            1/0
        FROM dbo.p AS p WITH(FORCESEEK)
        WHERE p.id = i.id
    )
    OPTION(LOOP JOIN);
END;

Updates


To manage updates, here’s the trigger I’d use:

CREATE OR ALTER TRIGGER
    dbo.after_update
ON
    dbo.p
AFTER UPDATE
AS
BEGIN
    IF @@ROWCOUNT = 0
    BEGIN
        RETURN;
    END;

    SET NOCOUNT ON;

    UPDATE c
        SET
           c.pid = i.id
    FROM dbo.c AS c WITH(FORCESEEK)
    JOIN Inserted AS i
      ON i.id = c.id
    OPTION(LOOP JOIN);
END;

Deletes


To manage deletes, here’s the trigger I’d use:

CREATE OR ALTER TRIGGER
    dbo.after_delete
ON
    dbo.p
AFTER DELETE
AS
BEGIN
    IF @@ROWCOUNT = 0
    BEGIN
        RETURN;
    END;

    SET NOCOUNT ON;

    DELETE c
    FROM dbo.c AS c WITH(FORCESEEK)
    JOIN Inserted AS i
      ON i.id = c.id
    OPTION(LOOP JOIN);
END;

Common Notes


All of these triggers have some things in common:

  • They start by checking to see if any rows actually changed before moving on
  • The SET NOCOUNT ON happens after this, because it will interfere with @@ROWCOUNT
  • You may need to use the serializable isolation level to fully protect things, which cascading foreign keys use implicitly
  • We don’t need to SET XACT ABORT ON because it’s implicitly used by triggers anyway

Thanks for reading!

Going Further


If this is the kind of SQL Server stuff you love learning about, you’ll love my training. Blog readers get 25% off the Everything Bundle — over 100 hours of performance tuning content. Need hands-on help? I offer consulting engagements from targeted investigations to ongoing retainers. Want a quick sanity check before committing to a full engagement? Schedule a call — no commitment required.
Why SQL Server’s OPTIMIZE FOR UNKNOWN Hint Hurts Performance

“Best Practice”


It’s somewhat strange to hear people carry on about best practices that are actually worst practices.

One worst practice that has strong staying power is the OPTIMIZE FOR UNKNOWN hint, which we talked about yesterday.

It probably doesn’t help that Microsoft has products (I’m looking at you, Dynamics) which have a setting to add the hint to every query. Shorter: If Microsoft recommends it, it must be good.

Thanks, Microsoft. Dummies.

Using the OPTIMIZE FOR UNKNOWN hint, or declaring variables inside of a code block to be used in a where clause have the same issue, though: they make SQL Server’s query optimizer make bad guesses, which often lead to bad execution plans.

You can read great detail about that here.

Mistakenly


We’re going to create two indexes on the Posts table:

CREATE INDEX
    p0
ON dbo.Posts
(
    OwnerUserId
)
WITH
(
    SORT_IN_TEMPDB = ON,
    DATA_COMPRESSION = PAGE
);
GO

CREATE INDEX
    p1
ON dbo.Posts
(
    ParentId,
    CreationDate,
    LastActivityDate
)
INCLUDE
(
    PostTypeId
)
WITH
(
    SORT_IN_TEMPDB = ON,
    DATA_COMPRESSION = PAGE
);
GO

The indexes themselves are not as important as how SQL Server goes about choosing them.

Support Wear


This stored procedure is going to call the same query in three different ways:

  • One with the OPTIMIZE FOR UNKNOWN hint that uses parameters
  • One with local variables set to parameter values with no hints
  • One that accepts parameters and uses no hints
CREATE OR ALTER PROCEDURE
    dbo.unknown_soldier
(
    @ParentId int,
    @OwnerUserId int
)
AS
BEGIN
SET NOCOUNT, XACT_ABORT ON;

    SELECT TOP (1)
        p.*
    FROM dbo.Posts AS p
    WHERE p.ParentId = @ParentId
    AND   p.OwnerUserId = @OwnerUserId
    ORDER BY
        p.Score DESC,
        p.Id DESC
    OPTION(OPTIMIZE FOR UNKNOWN);

    DECLARE
        @ParentIdInner int = @ParentId,
        @OwnerUserIdInner int = @OwnerUserId;

    SELECT TOP (1)
        p.*
    FROM dbo.Posts AS p
    WHERE p.ParentId = @ParentIdInner
    AND   p.OwnerUserId = @OwnerUserIdInner
    ORDER BY
        p.Score DESC,
        p.Id DESC;

    SELECT TOP (1)
        p.*
    FROM dbo.Posts AS p
    WHERE p.ParentId = @ParentId
    AND   p.OwnerUserId = @OwnerUserId
    ORDER BY
        p.Score DESC,
        p.Id DESC;

END;
GO

Placebo Effect


If we call the stored procedure with actual execution plans enabled, we get the following plans back.

EXEC dbo.unknown_soldier 
    @OwnerUserId = 22656, 
    @ParentId = 0;
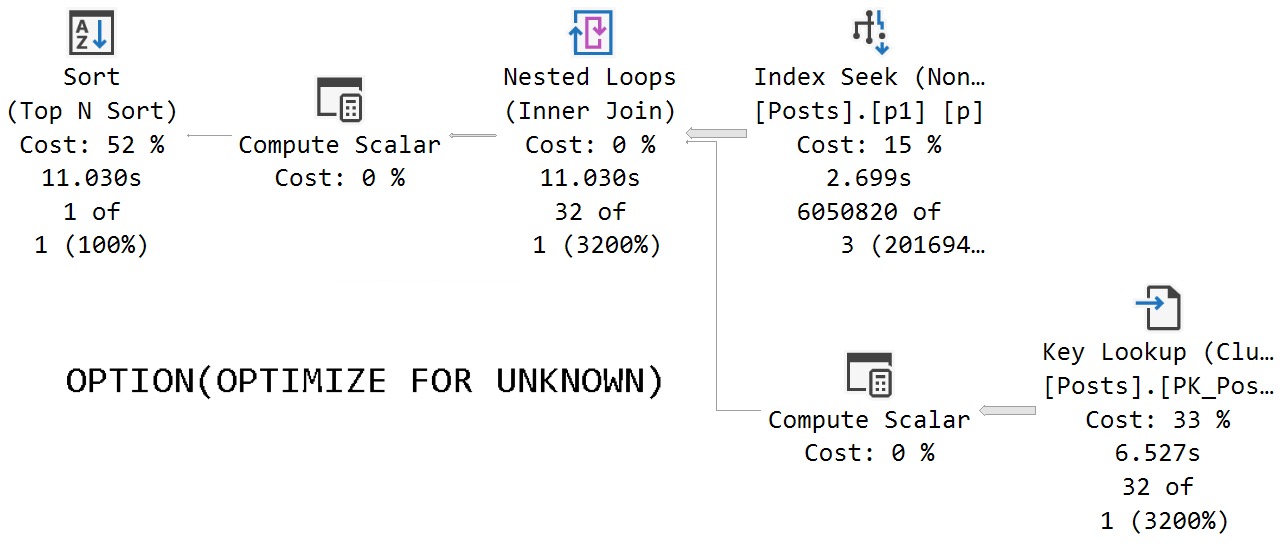
SQL Server Query Plan With Optimize For Unknown Hint
Not a good guess.

The assumed selectivity that the OPTIMIZE FOR UNKNOWN hint produces as a cardinality estimate is way off the rails.

SQL Server thinks three rows are going to come back, but we get 6,050,820 rows back.

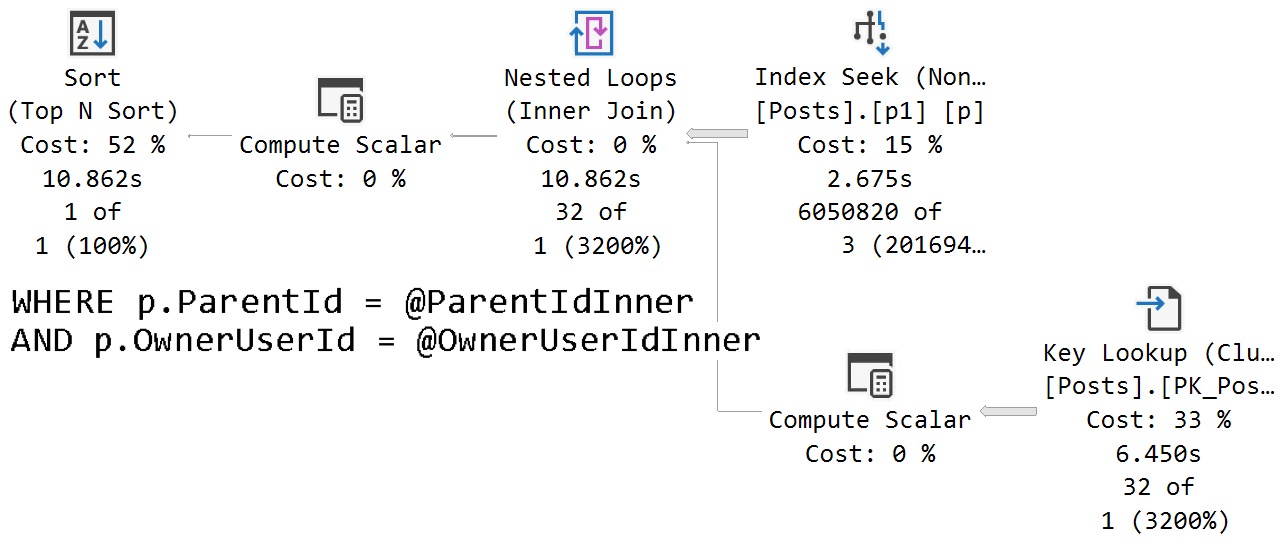
We get identical behavior from the second query that uses variables declared within the stored procedure, and set to the parameter values passed in.

SQL Server Query Plan With Local Variables
release me

Same poor guesses, same index choices, same long running plan.

Parameter Effect


The query that accepts parameters and doesn’t have any hints applied to it fares much better.

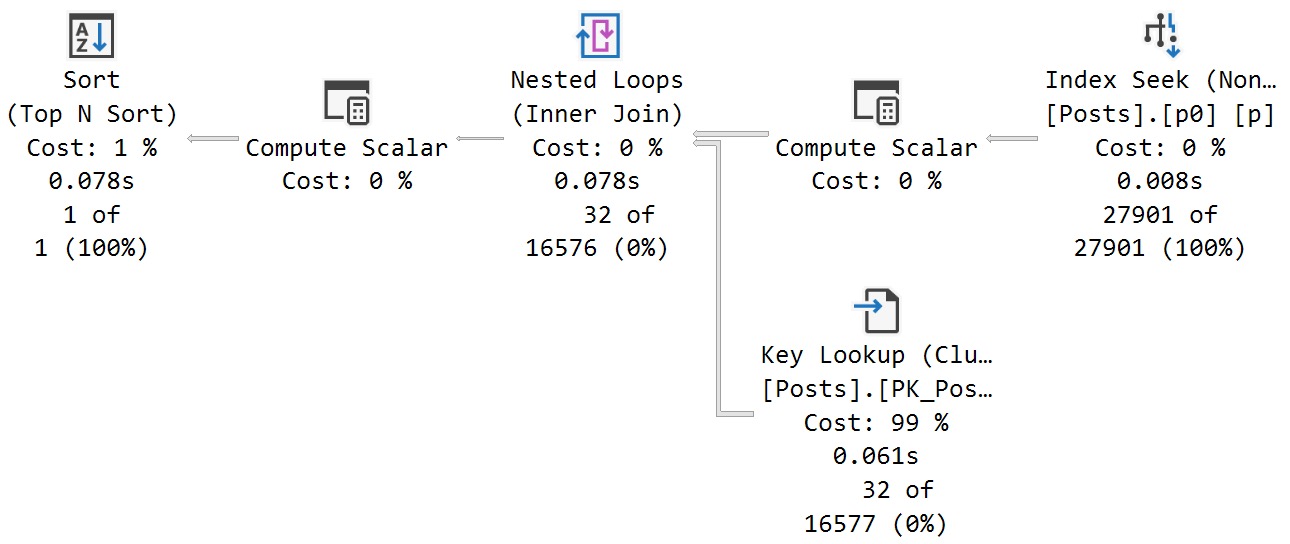
SQL Server Query Plan
transporter

In this case, we get an accurate cardinality estimate, and a more suitable index choice.

Note that both queries perform lookups, but this one performs far fewer of them because it uses an index that filters way more rows out prior to doing the lookup.

The optimizer is able to choose the correct index because it’s able to evaluate predicate values against the statistics histograms rather than using the assumed selectivity guess.

Thanks for reading!

Going Further


If this is the kind of SQL Server stuff you love learning about, you’ll love my training. Blog readers get 25% off the Everything Bundle — over 100 hours of performance tuning content. Need hands-on help? I offer consulting engagements from targeted investigations to ongoing retainers. Want a quick sanity check before committing to a full engagement? Schedule a call — no commitment required.
Why Are Parameter Details Missing From SQL Server Execution Plans?

Compiled


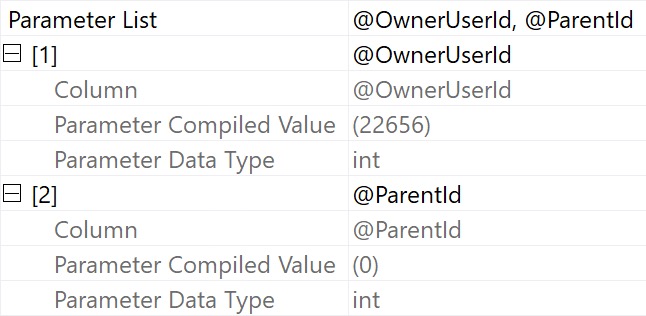
For a long while now, when parameterized queries get executed in SQL Server, whether they’re in stored procedures or from ORMs, execution plans stored in the plan cache or in query store will keep information about what the compile-time parameter values are.

You can see this list in the details of the query plan by going to the properties of whatever the root node is.

SQL Server Query Plan Properties
compile time, baby!

This is useful for when you want to execute the code to reproduce and address any performance issues.

You know, very professional stuff.

If you use local variables, apply the OPTIMIZE FOR UNKNOWN hint, or disable parameter sniffing using a database scoped configuration, cached and query store-d plans no longer have those parameters lists in them. Likewise, if you have queries where a mix of parameters and local variables are used, the local variable compile time values will be missing from the plan XML.

Thanks for reading!

Going Further


If this is the kind of SQL Server stuff you love learning about, you’ll love my training. Blog readers get 25% off the Everything Bundle — over 100 hours of performance tuning content. Need hands-on help? I offer consulting engagements from targeted investigations to ongoing retainers. Want a quick sanity check before committing to a full engagement? Schedule a call — no commitment required.
All The Wrong Ways To Search Numbers In SQL Server Queries

Patternistic


I see this mistake quite a bit! Golly do I. And then I cry and drink and drink and cry and why do you people insist on ruining my makeup?

Most of the time, it’s some query that looks like this:

SELECT
    c = COUNT_BIG(*)
FROM dbo.Posts AS p
WHERE p.OwnerUserId LIKE '2265%'

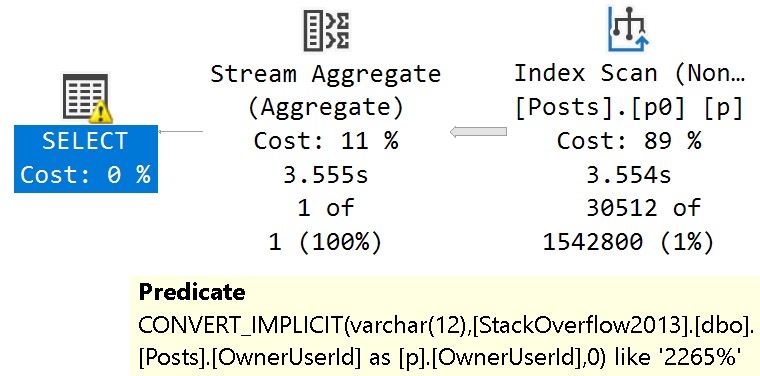
The cruddy thing here is that… SQL Server doesn’t handle this well.

SQL Server Query Plan
tanked

Even with this index on OwnerUserId, bad things happen in the form of a full scan instead of a seek, because of the implicit conversion function.

CREATE INDEX
    p0
ON dbo.Posts
(
    OwnerUserId
);

Because the OwnerUserId column has to be converted to varchar(12) to accommodate the wildcard search, we’re unable to directly seek to data we care about.

Many Other Wrongs


As if LIKE weren’t bad enough, I often see other patterns that attempt to mimic the behavior with more typing involved:

SELECT
    c = COUNT_BIG(*)
FROM dbo.Posts AS p
WHERE LEFT(p.OwnerUserId, 4) = '2265'; 

SELECT
    c = COUNT_BIG(*)
FROM dbo.Posts AS p
WHERE SUBSTRING
      (
          CONVERT(varchar(12), 
          p.OwnerUserId), 
          0, 
          5
      ) = '2265'; 

SELECT
    c = COUNT_BIG(*)
FROM dbo.Posts AS p
WHERE PATINDEX
      (
          '2265%', 
          CONVERT(varchar(12), p.OwnerUserId)
      ) > 0;

And even this, which doesn’t even work correctly because it’s more like saying ‘%2265%’.

SELECT
    c = COUNT_BIG(*)
FROM dbo.Posts AS p
WHERE CHARINDEX('2265', p.OwnerUserId) > 0;

These will have all the same problems as the original LIKE search pattern shown above, where we get a scan instead of a seek and a conversion of the OwnerUserId column from an integer to a varchar(12).

Is there a way to fix this? You betcha.

Computered


Adding a computed column does the job for us:

ALTER TABLE 
    dbo.Posts 
ADD OwnerUserId_varchar 
AS  CONVERT(varchar(12), OwnerUserId);

CREATE INDEX 
    pv 
ON dbo.Posts
(
    OwnerUserId_varchar
);

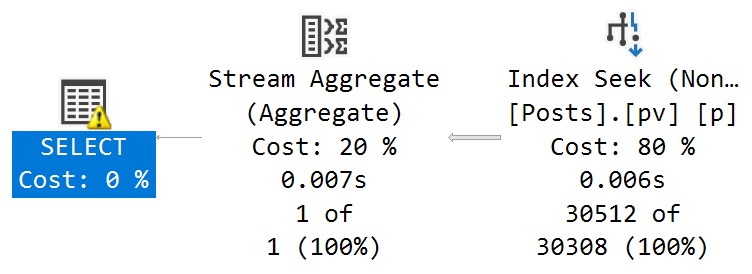
And without changing the original LIKE query, the optimizer will match it with our indexed computed column.

SQL Server Query Plan
inflammatory

Note that none of the other attempts at rewrites using left, substring, or patindex will automatically match with new indexed computed column.

Thanks for reading!

Going Further


If this is the kind of SQL Server stuff you love learning about, you’ll love my training. Blog readers get 25% off the Everything Bundle — over 100 hours of performance tuning content. Need hands-on help? I offer consulting engagements from targeted investigations to ongoing retainers. Want a quick sanity check before committing to a full engagement? Schedule a call — no commitment required.