This week’s posts are a series of short, and, admittedly lazy ones about improvements I’d like to see in Query Store.
I’m away from home for the Holiday Week, and I don’t have a lot of time to write at the moment. Normally I’d put these all into one post. I do hope you, dear reader, will forgive me. In the spirit of the holidays, or something.
Problem Four
A lot of dumb things end up in Query Store that you can’t do anything about, but which skew the graphs you have to look at and make things hard to decipher.
For example:
Query store queries from the GUI
Index rebuilds
Statistics updates
Index creation
Some dumb thing that runs at 3am that no one cares about
But there they are, acting like the biggest, baddest thing to ever touch SQL Server.
Except you know they’re not. And they have no business showing up when you know better. For as many options to tweak things as are getting added to Query Store, being able to quarantine some stuff would be a nice option.
Thanks for reading!
Going Further
If this is the kind of SQL Server stuff you love learning about, you’ll love my training. Blog readers get 25% off the Everything Bundle — over 100 hours of performance tuning content. Need hands-on help? I offer consulting engagements from targeted investigations to ongoing retainers. Want a quick sanity check before committing to a full engagement? Schedule a call — no commitment required.
This week’s posts are a series of short, and, admittedly lazy ones about improvements I’d like to see in Query Store.
I’m away from home for the Holiday Week, and I don’t have a lot of time to write at the moment. Normally I’d put these all into one post. I do hope you, dear reader, will forgive me. In the spirit of the holidays, or something.
Problem Three
Not every application is designed well. This may be shocking news to some of you.
One area where I consistently see application developers go wrong is with parameterization. Either their ORM doesn’t use parameters at all, or it only partially parameterizes queries.
When this happens, you can end up with a lot of duplicate plans both in your plan cache and in Query Store.
For queries that have no parameterization, the Forced Parameterization database setting can be very useful, but it doesn’t help with queries that are only partially parameterized.
It would be absolutely stellar if Query Store had a mechanism for associating queries with the same query or plan hashes are “morally equivalent” even if they’re not parameterized and be able to force them to use the same query plan, when you have a good one.
This would solve many applications problems that I see out there, where the developers refuse to lift a finger to solve basic problems that end users end up feeling.
Thanks for reading!
Going Further
If this is the kind of SQL Server stuff you love learning about, you’ll love my training. Blog readers get 25% off the Everything Bundle — over 100 hours of performance tuning content. Need hands-on help? I offer consulting engagements from targeted investigations to ongoing retainers. Want a quick sanity check before committing to a full engagement? Schedule a call — no commitment required.
This week’s posts are a series of short, and, admittedly lazy ones about improvements I’d like to see in Query Store.
I’m away from home for the Holiday Week, and I don’t have a lot of time to write at the moment. Normally I’d put these all into one post. I do hope you, dear reader, will forgive me. In the spirit of the holidays, or something.
Problem Two
When you run a query, you might get a memory grant, for example to hash or sort data. In the query plan, there are a whole bunch of columns that give you information about the memory grant:
Provide memory grant estimate as well as actual runtime memory grant information. Serial required/desired memory attributes are estimated during query compile time for serial execution. The rest of attributes provide estimates and counters for query execution time considering actual degree of parallelism. SerialRequiredMemory: Required memory in KB if the query runs in serial mode. The query will not start without this memory. SerialDesiredMemory: Memory estimated to fit intermediate results in KB if the query runs in serial mode. RequiredMemory: Required memory in KB for the chosen degree of parallelism. If the query runs in serial mode, this is the same as SerialRequiredMemory. DesiredMemory: Memory estimated to fit intermediate results in KB for the chosen degree of parallelism. If the query runs in serial mode, this is the same as SerialDesiredMemory. RequestedMemory: Memory in KB which the query requests the memory manager to grant. This can be smaller than sum of RequiredMemory and DesiredMemory if it exceeds the maximum allowed for single query. GrantWaitTime: Time in seconds if the query has to wait for successful memory grant. MaxUsedMemory: Maximum memory in KB used by the query. MaxQueryMemory: Maximum memory in KB allowed for single query. LastRequestedMemory: Memory in KB which was requested by the query from the memory manager during the last execution. IsMemoryGrantFeedbackAdjusted: Information regarding if the memory grant in this plan is adjusted based on memory grant feedback.
It’s a much more complete view of the memory grant, and it’s a damn shame that you have to rely on the plan cache for this, because it’s so unreliable. Clearing out, dropping plans, recompiles, etc. etc. etc.
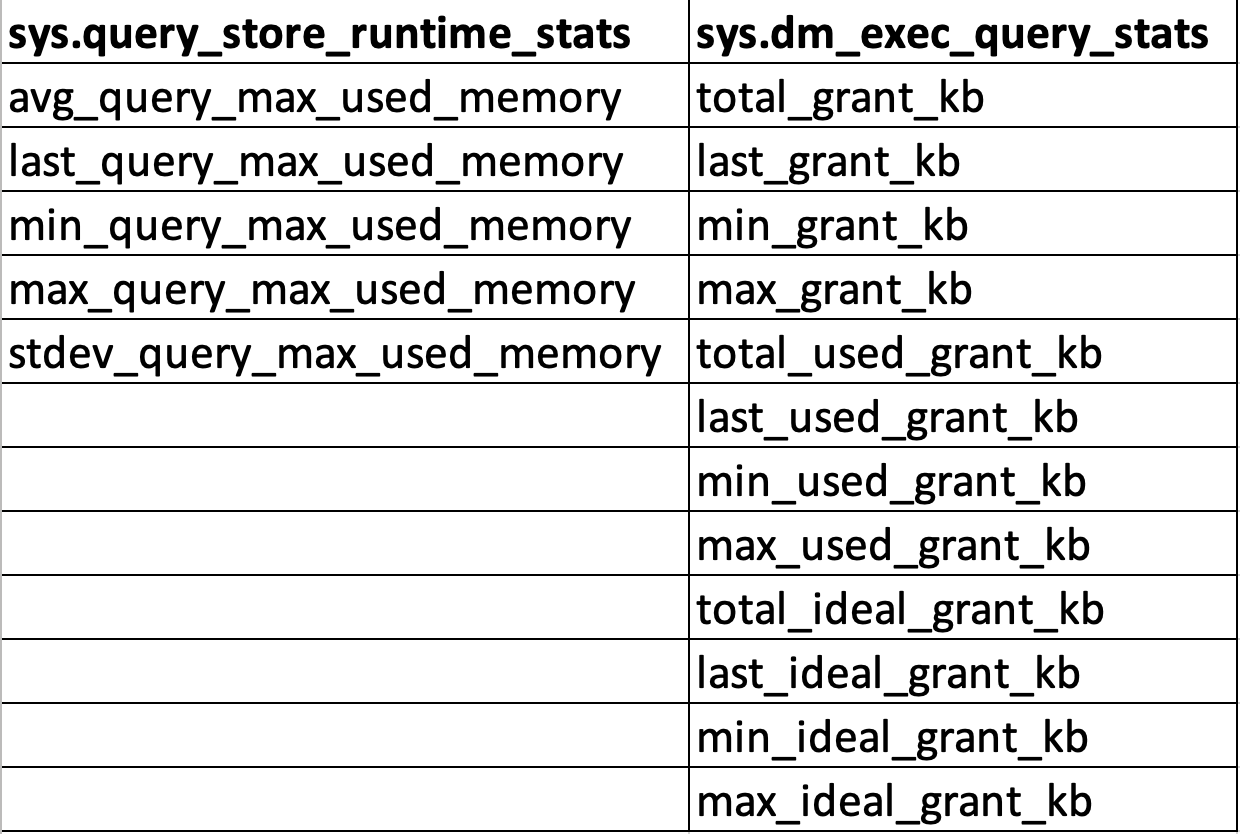
It would be marvelous if Query Store retained information like the size of the grant, so you can figure out if the amount of memory that it used was anywhere near reality. The ideal columns are not very useful to me, but the total and used are wonderful to compare.
Thanks for reading!
Going Further
If this is the kind of SQL Server stuff you love learning about, you’ll love my training. Blog readers get 25% off the Everything Bundle — over 100 hours of performance tuning content. Need hands-on help? I offer consulting engagements from targeted investigations to ongoing retainers. Want a quick sanity check before committing to a full engagement? Schedule a call — no commitment required.
This week’s posts are a series of short, and, admittedly lazy ones about improvements I’d like to see in Query Store.
I’m away from home for the Holiday Week, and I don’t have a lot of time to write at the moment. Normally I’d put these all into one post. I do hope you, dear reader, will forgive me. In the spirit of the holidays, or something.
Problem One
Query Store plans are equivalent to cached plans, which are equivalent to estimated plans. You get what SQL Server thought was gonna happen.
Sometimes, that can have very little in common with reality.
Other times, it can be misleading because of parameter sniffing.
Right now, SQL Server has a plan cache view in SQL Server 2019+ that holds the last actual plan. It would be really cool if Query Store tracked a configurable number of recent actual plans.
That’d really help folks out where the performance problem isn’t easy to deduce or reproduce from what they’ve got available.
Actual plans are incredibly valuable these days, with operator times included, and a whole bunch of other stuff that isn’t surfaced in estimated plans, like spills.
In real life, I see all sorts of weird things popping up as the bottleneck in query plans:
TOP above a SCAN
Repartition Streams
Compute Scalar
You only see the pain when operator times are involved, and Query Store needs to start collecting those to make query tuning easier.
Thanks for reading!
Going Further
If this is the kind of SQL Server stuff you love learning about, you’ll love my training. Blog readers get 25% off the Everything Bundle — over 100 hours of performance tuning content. Need hands-on help? I offer consulting engagements from targeted investigations to ongoing retainers. Want a quick sanity check before committing to a full engagement? Schedule a call — no commitment required.
As a counterpart to yesterday’s post, I have a list of Great Ideas™ that sometimes it’s hard to get people on board with, for some reason.
Don’t get me wrong, some people can’t jump on this stuff fast enough — I’ve had people take “unscheduled maintenance” during engagements to flip the right switches — but other times there’s a hem and a haw and a whole lot of’em to go along with the plan.
Somehow people who have auto close and Priority Boost turned on and haven’t checked for corruption since 30 Rock went off the air want a full-bore fisking of every change and every assurance that no edge case exists that could ever cross their path.
Okay pal. You go on with your bad 2012 RTM self.
Lock Pages In Memory
“Please don’t pop my balloon animals.”
To say that this setting only lets SQL Server hang onto memory is a grand injustice. It also lets SQL Server use completely different APIs to access memory through Windows, including skipping over virtual memory space. That can be an awesome benefit for servers with gobs of memory.
What are people worried about, here? Usually some article they read about balloon drivers in 2011, or something.
But the same people aren’t afraid to set min server memory to max server memory, and then wonder why they have no plan cache.
I love this setting though, and if you can also get away with turning on trace flag 834, there are some nice additional benefits.
DBCC CHECKDB
“Well, our index maintenance job runs for 9 hours, so we don’t have time for this. Besides, won’t it cause a lot of blocking?”
Lord have mercy, the foot dragging on this. Part of your job as a DBA is to keep data safe and backed up. Running CHECKDB is part of that.
No DBA got fired over fragmented indexes. More than a few have for data going corrupt.
Granted, this can get a little more complicated for really big databases. Some people break it up into different steps, and other people offload the process.
Some third party backup tools from vendors like Quest and Red Gate allow you to automate processes like that, too. Full backup, restore to new server, run CHECKDB, tell us what happened.
How nice, you get a tested restore, too.
Query Store
“Won’t this catch my server on fire and leak PII to hackers?”
If you’re too cheap to spring for a proper monitoring tool, Query Store makes a pretty okay pseudo replacement. Especially in 2017 and up where you can track wait stats too, you can get some pretty good insights out of it.
Microsoft has also gotten pretty smart about better default settings for this thing, and in 2019 you have more knobs to set smarter standards for which plans get tracked in there.
It’d be really nice if you could choose to ignore queries, too, but you know. Can’t always get what you want, there.
I’d much rather look at Query Store than that unreliable old plan cache, too.
Read Committed Snapshot Isolation
“Why do I want tempdb to be full of old data?”
Remember yesterday? Me either. Nothing good happened, anyway. Do you remember what that row looked like before the update started? No?
Read Committed Snapshot Isolation does. And it wants you to, too. This setting solves so many dumb problems that people run headlong into because Microsoft committed to a garbage isolation level.
One complaint I hear all the time is that a particular application runs a lot better on Oracle with no other changes. This setting is usually the reason why: It’s not turned on.
Once you turn it on, reader/writer blocking and deadlocking goes away, and you don’t need to add a SSMS keyboard shortcut that inserts WITH NOLOCK.
Changing Indexes
“They’re fine the way they are, trust me. That burning smell is another server.”
Index tuning needs to be a process that starts with cleaning up indexes, and ends with adding in better ones.
What makes an index bad? When it’s unused, and/or duplicative.
What makes an index good? When it gets read from more than it’s written to, and it’s a usefully different way for queries to access data.
There are other index anti-patterns that are good to look for too, like lots of single key column indexes, but they usually get cleaned up when you start merging duplicates.
There’s a near fully eclipsed Venn Diagram of people who are worried about having too many indexes and people who have never dropped an index in their career.
Talk, Talk
These are the kinds of changes and processes people should be comfortable with making when they work with SQL Server.
Sure, there are a ton of others, but some of them have become part of the installer and get a little more leeway — parallelism settings, instant file initialization, tempdb etc. — I only wish that more of this stuff would follow suit.
One wonders quite loudly why setting MAXDOP made it into the installer, but setting Cost Threshold For Parallelism did not.
Thanks for reading!
Going Further
If this is the kind of SQL Server stuff you love learning about, you’ll love my training. Blog readers get 25% off the Everything Bundle — over 100 hours of performance tuning content. Need hands-on help? I offer consulting engagements from targeted investigations to ongoing retainers. Want a quick sanity check before committing to a full engagement? Schedule a call — no commitment required.
There are lots of examples of how to do this with the plan cache, but, well, the plan cache can be an awfully unstable place.
Query store being a bit more historically reliable, we can use some of the same tricks to track them down there too.
SELECT
    x.total_query_plans,
    qsq.query_hash,
    qsp.query_plan_hash,
    query_plan =
        TRY_CONVERT
        (
            xml,
            qsp.query_plan
        )
FROM
(
    SELECT
        qsq.query_hash,
        distinct_query_plans =
            COUNT_BIG(DISTINCT qsp.query_plan_hash),
        total_query_plans =
            COUNT_BIG(qsp.query_plan_hash)
    FROM sys.query_store_query AS qsq
    JOIN sys.query_store_plan AS qsp
        ON qsq.query_id = qsp.query_id
    GROUP BY
        qsq.query_hash
    HAVING  COUNT_BIG(DISTINCT qsp.query_plan_hash) > 1
    AND     COUNT_BIG(DISTINCT qsp.query_plan_hash)
                <= COUNT_BIG(qsp.query_plan_hash)
) AS x
CROSS APPLY
(
    SELECT TOP (x.total_query_plans)
        qsq.*
    FROM sys.query_store_query AS qsq
    WHERE x.query_hash = qsq.query_hash
) AS qsq
CROSS APPLY
(
    SELECT
        qsp.*
    FROM sys.query_store_plan AS qsp
    WHERE qsp.query_id = qsq.query_id
) AS qsp
ORDER BY
    x.total_query_plans DESC;
Thanks for reading!
Going Further
If this is the kind of SQL Server stuff you love learning about, you’ll love my training. Blog readers get 25% off the Everything Bundle — over 100 hours of performance tuning content. Need hands-on help? I offer consulting engagements from targeted investigations to ongoing retainers. Want a quick sanity check before committing to a full engagement? Schedule a call — no commitment required.
This metric gets looked at a lot in the plan cache to see how effective it is. The main problem is that with high enough churn, you might not catch all the queries involved in the problem. Here are a couple ways to look at this in Query Store.
WITH x AS
(
    SELECT
        single_use_queries =
            SUM
            (
                CASE
                    WHEN qsrs.count_executions = 1
                    THEN 1
                    ELSE 0
                END
            ),
        total_queries =
            COUNT_BIG(*)
    FROM sys.query_store_runtime_stats AS qsrs
)
SELECT
    x.*,
    percent_single_use_plans =
        CONVERT
        (
            decimal(5,2),
            single_use_queries /
                (
                    1. *
                    NULLIF
                    (
                        x.total_queries,
                        0
                    )
                ) * 100.
        )
FROM x;

SELECT
    qsqt.query_sql_text
FROM sys.query_store_query_text AS qsqt
WHERE EXISTS
      (
          SELECT
              1/0
          FROM sys.query_store_query AS qsq
          JOIN sys.query_store_plan AS qsp
              ON qsq.query_id = qsp.query_id
          JOIN sys.query_store_runtime_stats AS qsrs
              ON qsp.plan_id = qsrs.plan_id
          WHERE qsqt.query_text_id = qsq.query_text_id
          AND   qsrs.count_executions = 1
      );
Thanks for reading!
Going Further
If this is the kind of SQL Server stuff you love learning about, you’ll love my training. Blog readers get 25% off the Everything Bundle — over 100 hours of performance tuning content. Need hands-on help? I offer consulting engagements from targeted investigations to ongoing retainers. Want a quick sanity check before committing to a full engagement? Schedule a call — no commitment required.
Over the years, there have been a lot of requests to get sp_BlitzCache to sort results by query cost. I understand why. It’s assumed that the optimizer is never wrong and that cost is directly associated with poor performance.
There are also rather misguided efforts to figure out parallelism settings based on plan costs. The main problem with that being that if you currently have a lot of parallel queries, all that means is that the estimated cost of the serial plan was higher than your current Cost Threshold For Parallelism setting, and the cost of the parallel plan was less than the cost of the serial plan.
If you increase Cost Threshold For Parallelism, you may very well still end up with a parallel plan, because the serial version was still more expensive. If you eventually change Cost Threshold For Parallelism to the point where some queries are no longer eligible for parallelism, you may eventually find yourself unhappy with the performance of the serial version of the query plan.
Albeit with less overall wait time on CX* doodads.
Next you’ll be complaining about all the SOS_SCHEDULER_YIELD waits you’ve got.
Insteads
Rather than look at estimated metrics, you should be looking at how queries actually perform. For most servers I look at, that means looking at queries with high average CPU time, and large memory grants. Those metrics typically represent tunable aspects of the query.
In other cases, you might look at wait stats to direct the type of queries you want to go after. Reads, writes, and executions are also valuable metrics at times.
One danger of looking at totals rather than averages is that you may find things that do a little bit of something a whole lot of times, and there’s no real way to tune the small bit of activity they generate other than to run the query less.
What’s A Cost For?
In general, I only tend to look at costs to figure out plan choices within a query, or when comparing two different plans for “the same” query.
This is where experimenting with hints to change the plan shapes and choices can show you why you got the plan you did, and what you might have to do to get the plan you want naturally.
Let’s say you want to figure out why you got a specific join type. You hint the type of join you want, and there’s a missing index request now. Adding the index gets you the plan shape you want without the hint. Everyone lived happily ever after.
Until the index got fragmented ???
Thanks for reading!
Going Further
If this is the kind of SQL Server stuff you love learning about, you’ll love my training. Blog readers get 25% off the Everything Bundle — over 100 hours of performance tuning content. Need hands-on help? I offer consulting engagements from targeted investigations to ongoing retainers. Want a quick sanity check before committing to a full engagement? Schedule a call — no commitment required.
In this video, I delve into the intricacies of how thread pool weights do not appear in QueryStore, despite generating significant thread pool waits during execution. I walk through a detailed experiment using my custom `ThreadPooler` stored procedure and StackOverflow 2013 database on SQL Server 2019, running 150 concurrent queries to simulate high thread demand. Despite hitting the thread pool limits and experiencing contention, QueryStore fails to capture any thread pool weights, leading me to question the current implementation and documentation of the query store waitstats view. This video is a deep dive for my dear friend William at Microsoft, aimed at clarifying these details and potentially improving the user experience in the query store GUI.
Full Transcript
Erik Darling here with Erik Darling Data. Recently voted the consultant most likely to die in front of their computer by BearGut Magazine. So I’d like to thank the editors, the writers, and all the voters out there, all the BearGut heads out there who voted for me. I think what really pushed me over the edge was when I shared my Windows Update notifications where it said, we notice that you use your computer mostly between 5am and 9pm, so we’re not going to restart your computer. I think that’s what really sealed the deal for me, but, you know, just want to make sure, make sure they show everyone at BearGut Magazine my appreciation there. Love you guys and gals, all you fine people at BearGut Magazine. So, this video is for my dear friend William at Microsoft, and it is to hopefully clarify some details around how I think that thread pool weights do not actually end up in QueryStore. So, to kind of step through a couple things up front, this is QueryStore. I have recently purged all QueryStore data from here because I don’t, I want to start fresh. I had a little bit of a difficult time clearing that out. There were some really interesting things that I had created in there. That’s okay.
What was I going to do? Take a backup? Okay. So, that’s that. So, this is QueryStore. It’s on. The capture mode is on. The wait stats capture mode is on. Everything is good to go here. That’s StackOverflow 2013. The store procedure that I’m using to generate thread pool is a store procedure called ThreadPooler right here, and the query in it is written in kind of a funny, silly way in order to do a very specific thing. And that very specific thing is run at, come on, buddy, run at DOP8 and reserve eight threads per concurrent parallel branch, which brings us to 24 threads, because the best way to generate thread pool is to generate parallel queries and run a whole bunch of them at the same time.
In order to run a whole bunch of them at the same time, we’re going to be using Osterest, but we’ll talk about that in a minute. So, this is a freshly restarted SQL Server. I just restarted it before recording this because I want wait stats to be buck naked.
We have nine thread pool waits on the server. We have nine thread pool waits because the thread pool is an artifact of both of creating threads, which happens during SQL Server’s lifetime. It will create and trim the family of threads that run queries on here. So, when you create threads, you hit thread pool waits.
Not for a very long time. You can see the max wait time is one millisecond. And, you know, that’s pretty good. That’s pretty fast. Fast threads. It must be using lightweight pooling or something. It must have priority boost turned on to get threads created that quickly.
But we have these thread pool waits on the servers. We have a few of them. Not a lot, though. So, fine. In sys.queryStoreWeightStats, this should be completely empty because I haven’t run anything. WeightCategory2 is, of course, the one that would be responsible for tracking thread pool waits.
So, I have SPPressureDetector, my shameless plug for my store procedure here, which is going to tell us some information about CPU pressure on the server. I’m using the remote DAC so that I don’t get held up by the test that causes thread pool waits because there’s nothing more useless than sitting there waiting for DMV queries to finish.
So, my server is allowed… Oops, I didn’t do that very well. I didn’t frame that up very well. My server is allowed to use up to 744 threads. We have currently used 39 threads, and we have 665 threads available.
Nearly 666 threads available, which would be devil worship, which is the only way that consultants actually get business. So, I don’t know.
I don’t know what the correlation there is. Maybe I should worry about business if I only have 665 threads. But, yeah. So, this is the current setup for this. The way I’m going to be testing things is running my thread pooler procedure against the StackOverflow 2013 database.
Again, making sure that context is ultra clear here. This is the server we’re hitting, SQL Server 2019. And I’m going to be running 150 threads over 20 rounds of executions. So, 150 concurrent queries of thread pooler.
I was running this up higher before, but I was getting a lot of timeouts from Ostrust. And I don’t want timeouts. I want queries that hit thread pool, but complete.
I don’t want there to be failed executions getting into the mix and mucking things up. Because, even though I know Query Store tracks failed executions, this is a failure before anything even happens. So, there’s no way the Query Store would be able to say, oh, you were going to run that query, but you couldn’t get a thread.
So, there’s no way to put that together. So, I don’t want failures. I want contention, but not like timeout, disaster, the usual kind of thread pool stuff that I demo. So, let’s kick that off and get that working.
And we’re immediately going to see SP Pressure Detector telling us about thread pool weights. All right. So, you can see that we are the 704 threads that we are allowed to use. We have used 755 now.
We’re at negative 59. So, that’s a bad time. And we have 17 requests waiting for threads. And that’s going to be just about 17 down. Oh, wow. More than that. So, in the span of time between this query running and this query running, 10 extra threads got on a line waiting for CPU.
That’s fun. Or 10 extra tasks started waiting for the thread, rather. If we run this a couple few times during the course of things going, we’re going to see more thread pool weights here and there.
So, we’re going to see some. We’re going to see them come and go. And we’re going to see, if we look at Ostrass first, we’re not going to see anything timing out. When Ostrass has queries time out, it gets very, very loud about it.
There’s all sorts of messages and flooding and going on in there. But if we run this, you know, and we find some stuff with this thread pool, come on, baby, give me something. Anything.
One row, one row. Screw you. Make me look bad in front of my friend William. What we’re going to see over here is something kind of interesting. You know, there’s a bunch of queries executing at DOP8 that have 24 worker threads. But then as we get down a little bit lower, we’ll see SQL Server starting to force some queries to use lower DOPs because we’re hitting these thread pool weights.
Right? So, we’ll see DOP7, DOP3, DOP1, and then, you know, whatever. So, we can tell that we’re hitting thread pool. But we can also tell that queries are at least finishing.
Right? Like, queries are getting through and eventually completing. So, there’s that. Great. Wonderful everything. We’re going to see as this thing starts executing that weights are going to, or thread pool weights are going to go up on the server.
Not constantly because we’re not constantly hitting thread pool anymore. You know, it was sort of inconsistent in the pressure detector stuff where, like, some queries were and some queries weren’t. But, you know, we see that from the, I think, nine waiting tasks that we had before, we’re up to 616 now.
So, we added a whole bunch of them in. You know, if we run this, we might see some more. I don’t know. I forget. So, whatever.
This thing has been dragging on long enough. Oh, there’s a whole bunch more. Woo-hoo! We hit more thread pool. We did our job. Let’s come back over here and look. Okay. Maybe it hasn’t quite made it to that DMV yet. Consistency is an eventual thing, I suppose.
So, let’s kill that. And let’s poke around a little bit. We’ll see thread pool weights down here. We don’t see any weights in here.
We don’t see any thread pool weights in query store. And if we run here, we’re going to see, you know, queries and stuff running. We see all sorts of other weights get populated, but nothing for that weight category of thread pool. So, that’s a bummer.
And, you know, we can probably see if we poke through query store. Maybe. I mean, I hope we do anyway. If we go look at query store. And we go look at top resource consuming queries.
And let’s view those. And let’s see here. There’s our top resource consuming query. And that’s from our stored procedure thread pooler, which had 293 executions. All right.
So, it did a lot of work. Did a lot of stuff. Executed a whole bunch of times. We did a bunch of thread pool. But we have no thread pool weights in here. All right. If you look at wait time, query ID 37, you know, there’s no wait time. So, I don’t know.
Whatever. I’m exhausted. Give me a break. If the query store GUI worked better, that would be probably more illustrative that we didn’t have any of that in there. So, I don’t know.
Maybe that’s a separate issue that I’ll open up. Fix the query store GUI. Get some UX in the query store GUI. Something like that. User experience points. Tell a user story.
Great user story with the GUI. Anyway. William. I hope you enjoyed this video. I hope it helps you in your quest to fix the documentation in the query store waitstats view. Anyone else watching this?
You shouldn’t have watched it. This video was only for my best friend William at Microsoft. So, you’re a disgusting individual. And I’ve lost all respect for you. All the non-Williams out there. How dare you intrude on this special time that we had together.
Anyway. It’s Friday. So are you. I’m going to leave now.
Going Further
If this is the kind of SQL Server stuff you love learning about, you’ll love my training. Blog readers get 25% off the Everything Bundle — over 100 hours of performance tuning content. Need hands-on help? I offer consulting engagements from targeted investigations to ongoing retainers. Want a quick sanity check before committing to a full engagement? Schedule a call — no commitment required.
One is that RESOURCE_SEMAPHORE_QUERY_COMPILE is listed as a collected wait, but with an asterisk that says it’s not actually collected. I’ve tested workloads that generate lots of that wait, and just like the docs say, it doesn’t end up there.
Of course, since I added wait stats recently to sp_QuickieStore, I wanted to make sure other waits that I care about actually show up in there.
THREADPOOL Doesn’t
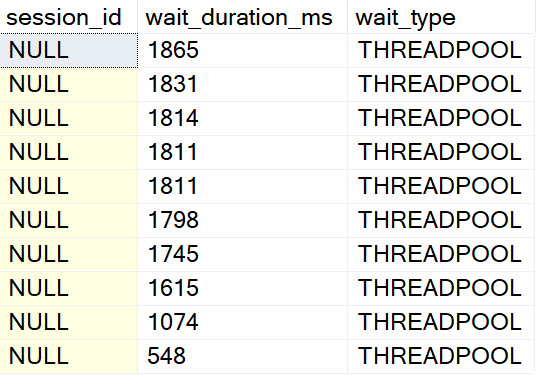
I ran a workload where 747 queries waited on THREADPOOL before running and completing.
el threado
But nothing shows up in query store wait stats. The stored procedure I ran to create the THREADPOOL waits shows up, and it has other waits — CPU and stuff — but nothing about workers. My guess why is because that’s a pre-compilation wait. When they pile up, there’s no execution context.
They’re quite not-figuratively spidless.
lezz than zero
So, uh, I had to pull filtering for that wait out.
RESOURCE_SEMAPHORE Does
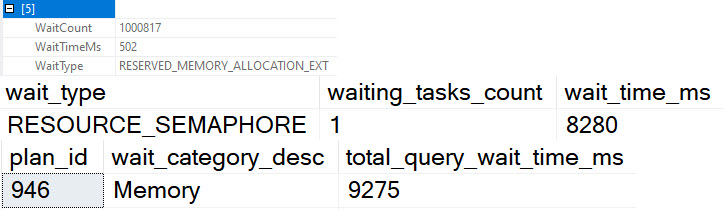
Running a similar workload, I can see where queries start to rack up RESOURCE_SEMAPHORE waits. At least, I’m pretty sure they do.
See, those waits are buried in a bunch of memory waits that are usually insignificant — and hell, on well-functioning server so is RESOURCE_SEMAPHORE — but I see the time spent on that, plus some other memory related waits.
carry the um
And that’s probably good enough for hand grenades.
Thanks for reading!
Going Further
If this is the kind of SQL Server stuff you love learning about, you’ll love my training. Blog readers get 25% off the Everything Bundle — over 100 hours of performance tuning content. Need hands-on help? I offer consulting engagements from targeted investigations to ongoing retainers. Want a quick sanity check before committing to a full engagement? Schedule a call — no commitment required.