Rewriting Multi Statement Table Valued Functions To Fix SQL Server Performance Problems

Hey You Should Do This


Video Summary

In this video, I dive into the world of multi-statement table-valued functions and why they can be a performance nightmare in SQL Server. I share my experience of rewriting these functions to inline table-valued functions using startup expression predicates, demonstrating how to handle complex logic within them without compromising performance. I walk you through the process step-by-step, showing that even if your function has conditional blocks like `IF` statements, there are ways to refactor it into a more efficient form. By leveraging Common Table Expressions (CTEs) and careful predicate handling, we can achieve significant improvements in execution plans and overall query performance. So, whether you’re dealing with simple or complex logic within these functions, this video will equip you with the knowledge to tackle them head-on!

Full Transcript

I’m so ready. So ready to leave. I just have two videos left. After this one, there’s one video, but I have succumbed to my weaknesses, and it is champagne time at Shea Darling. And so, because it is champagne time, we should get this before it’s too much champagne time. So I wanted to talk about rewriting multi-statement table-valued functions, because they are generally bad for performance, even if the query that populates them is fairly simple. You just have like the goofy overhead of the table variable. On versions prior to SQL Server 2017, there was like almost no hope for these things. 2017 got something called interleaved execution, which gave you table cardinality for the, for like, cardinality estimates coming out of the function. Prior to that it was 100 rows for 2014 and one row for that. It was like a bad time. It was a bad time across the board.

The thing is when I talk to a lot of people, they’re like, I can’t rewrite this. It’s too complicated. There are if blocks. I’m like, yes, you can. Don’t be ridiculous. We can do this together. Hold your hand. Run through the, run, run through the field. Pick some flowers. I don’t know. It’ll be fun. Be romantic. So this is our multi-statement table-valued function. We have, it takes some stuff in here, user ID and a post type ID, and we declare a table variable with some columns in it. They’re all very, very useful, necessary columns. And then based on which post type ID we pass in, we will execute a block depending on, on that. And this is where people are often like, well, there’s just no way to do this. There’s no way to rewrite this.

I’m like, I’m very silly. Now, no, you, if, if you were to rewrite this, you couldn’t just do this, right? You couldn’t say this return table as, and then if blah, blah, do this, blah, blah, do this, blah, blah, do this. That will not work. There are red squiggles everywhere. We can see from the red squiggles that this will not work. This will not compile. If I try to create this, we’ll get, we’ll get some funk thrown at us. Incorrect syntax near the keyword if. Sorry to hear that. But what you can do inside of an inline table-valued function that does not require an if branch is take advantage of startup expression predicates.

And what I mean by that is we can stack some CTE. Now, this is a good use for CTE. I mean, granted, we could have used derived tables here or something too, but whatever. So what we’ll do is we’ll still pass in a user ID and a post type ID.

And what we’ll do is we’ll have a CTE called questions, and that’ll take care of the post type ID equals one stuff up here. And we’ll add a filter inside of here and say you only fire off if post type ID equals one. And we’ll do the same thing for answers and say you only fire off if post type ID equals two.

And we’ll do the same thing for other where if post type ID is greater than two, then we’ll fire this off. And then we’ll have a third CTE that is a union all of those three, right? So we have questions, answers. I don’t know why I put that in the kind of funny order, but questions, answers, and other.

And then we’ll just select the top one from that order by score descending. And this will work just fine, and it will work just wonderfully. And something that I think is nice about this is that even if we don’t need data from one of them, they won’t fire.

So the execution plan will be complicated. But if we look at it kind of closely, we’ll see that we only fired off and hit the post table the once. The rest of the time we got constant scans from the other two accesses there.

Now, oh rather, sorry, we have to quote this one out. That’s what I was doing wrong. Ha ha ha. If we quote this out, ooh la la, and we zoom out a little bit, we can see that we only touched the post table once.

We did not touch it three times because of the startup expression predicates. The three other times we got, or the two other times, rather, we got these constant scan operators. What I messed up before is that, you know, I ran the cross-apply part.

So even with this quoted out, that did happen. But if I flip things around and I bring this in and I bring this out and I get rid of you, and actually I should probably get rid of you too. There we go.

And we run this, the same thing will happen where SQL Server will look at what was going on and say, oh, I don’t need that first one. I’m only going to use that second one this time. And then if I need both, of course, then we’ll run both and we’ll get stuff from both, I guess. Lucky us.

All right. We got all that good stuff there. Yep. So we hit things twice because we had the two applies run. But anyway, that’s not really the point. The point is that there are ways to write more complicated multi-statement table-valued functions as inline table-valued functions.

It does take, you know, some practice. It does take some getting used to. But you can do it.

And you can often get much better performance from them in general. So that’s that. I don’t know. If you don’t like it, you don’t have to. Just do whatever you want.

It’s your life. Anyway, I’ll drink to that. I will see you over in the next video. We will talk about where filtered indexes are still broken.

See you there. Thanks for watching.

Going Further


If this is the kind of SQL Server stuff you love learning about, you’ll love my training. Blog readers get 25% off the Everything Bundle — over 100 hours of performance tuning content. Need hands-on help? I offer consulting engagements from targeted investigations to ongoing retainers. Want a quick sanity check before committing to a full engagement? Schedule a call — no commitment required.
Tuning Performance Problems With Aggregates In SQL Server, Part 3

3/3


Going Further


If this is the kind of SQL Server stuff you love learning about, you’ll love my training. Blog readers get 25% off the Everything Bundle — over 100 hours of performance tuning content. Need hands-on help? I offer consulting engagements from targeted investigations to ongoing retainers. Want a quick sanity check before committing to a full engagement? Schedule a call — no commitment required.
Tuning Performance Problems With Aggregates In SQL Server, Part 2

2/3


Video Summary

In this video, I delve into a fascinating SQL Server query optimization scenario where we encountered an “eager index spool” in the execution plan—a notorious performance bottleneck. To tackle it, I explored alternative ways to structure our query and improved statistics on key columns to refine aggregate estimates. By doing so, we managed to reduce the query’s runtime from several minutes down to just seven seconds, showcasing the power of better data estimation and query reordering. This video is part of a series focusing on optimizing complex queries with aggregates, and I hope you find it helpful as you navigate your own SQL challenges!

Full Transcript

I ain’t got nobody. Just kidding. Just avoiding going out and doing things. Sometimes David Lee Roth karaoke is the best way to do that. Just kidding. It’s recording SQL Server videos on Saturday. Ah, so in the last video we talked about aggregates with bad guesses and I want to show you another aggregate with a bad guess. This one coming to you live and direct from a client inspired event where they had this big crazy query and at the heart of this query was this two counts where we had to filter on stuff. Um, but I, my, my idea, my big idea was we are going to do one count and filter on that rather than two separate counts and filter on those because that’s, we could, we could do that. We could, we could use math to our advantage. Who would use math in a database? Insanity. Certainly not the optimizer. Just kidding. The optimizer is lovely.

Uh, so the, the, the, the query that we were working on was much, much bigger, but this was sort of at the heart of it. And, uh, so let’s say we have, we had an index on the comments table on the post ID column. Um, and I wanted to do my count in here like this. And when I wrote this rewrote this query, um, what happened was, uh, not good. Uh, I ended up with a query plan that looked a bit like this. Yeah. You can see what’s going on here. You can see where my least favorite thing to ever see in a query plan popped up. That is the old eager index spool. Yeah. I hate this thing. I hate this thing for so many reasons.

And you can see why I hate it here. We spent nearly three minutes building this index. Uh, and the reason why it takes so long is because it’s, it says that it’s happening in parallel. But if we go into the properties and we look over here, we can see that, oh boy, all just about 53 million rows from the votes table end up on a single thread to build that index. And this will happen each and every time. We don’t have a missing index request either here and the XML and the missing index DMVs. We guts nothing.

So even though there isn’t physically a lot of distance between here and here, time wise, there is a very large amount of distance between here and here. Uh, the query in full runs for about two minutes and 56 seconds. So we can figure out pretty well that, guess what? We spent most of the time building that stupid spool. So let’s figure out what happened, how we can fix it, what went wrong, what was going on.

Now, the thing is, um, I was confounded by this. And often when I am confounded by things, my first reaction is to do something stupid. So I did what I normally do, which is something stupid. And I just flipped the order that we were union all-ing things from. So I went from up here where comments was on top and votes was on the bottom to votes on top and comments on the bottom.

And when I did that and ran the query, it was a little bit faster. And, um, it w it was faster because the execution plan changed and we no longer had the index spool. And the query was overall faster, but I was still, I was still annoyed with a few things in the query. Uh, so when we look at the plan, we’ll start to sort of see why. All right. We can, we can, we can see some more rather large percentages in here, where perhaps maybe, uh, we don’t need, there shouldn’t be larger percentages in here.

Uh, we’ll start with this one where, uh, the optimizer thought that it could squish our results down by a significant amount, right? From 5.6 million, uh, to, or rather from 17 million to, uh, 141,000, right? The 17 million that came out of here. So it, it, it, it, it’s guess was we could get down to this number, but we can only get down to this number.

So we, we stopped early. Uh, and then of course with along with that bad guess, we get a bad guess here and a bad guess is over here. Uh, some bad guess is over here. Now you’re probably wondering why we have such bad guesses here. And I’m going to show you. So, uh, in a normal batch, uh, sorry, in a normal role mode plan where we had a hash join, we may, in a parallel role mode plan where we have a hash join, we may see a bitmap get created. In batch mode plans, we don’t see that anymore.

But what we will see is in the properties of the hash match operator, we will see bitmap creator true. And we can see that it created optimized bitmap 1085. Very special bitmap. Just kidding. It’s just optimized bitmap 1085. There’s really nothing all that special about it at all.

And if we look down here where we, where, where that bitmaps hopefully get applied, we can see in the, the clustered index scan of votes that, uh, optimized bitmap 1085 was pushed over here. And if we look at the scan of comments that optimized bitmap 1085 was in fact pushed down here. So this bitmap, we, we made some guesses based on this bitmap. And those guesses turned out to be very, very, very, very, very, very wrong.

Mm-hmm. Yes. I mean, we were still, we still did a lot better than, uh, what was it? 30, uh, three minutes, but still not fast enough. Eric, you’re a query tuner. You need to make things faster.

So again, um, let’s just try to improve the estimate here. Let’s not even, let’s not create another index. Um, let’s just, we need to make a better guess. We need to make a better guess on the post table, on the parent ID column, because that’s what we were trying to squish here. Parent ID.

If we make, we have better statistics on what’s going on in parent ID, then we can make better choices elsewhere in the plan. So let’s create those with a sample of 25%. Again, this isn’t, this isn’t even pushing the bound. 25% is like nothing. It’s not a whole lot. It finishes in about four seconds.

It’s something that, you know, even people with the most demanding maintenance windows can get away with. And now when we rerun that query with those statistics in place, things will improve a little bit more. At least they, they, they do without Camtasia running. So we’ll find out what happens with Camtasia running.

So seven seconds. So we cut the time about in half again. And we can see that we started making quite reasonable guesses in many places. I mean, not like, like fully reasonable guesses, but you know, much better guesses, I think.

Like not like thousands of times wrong guesses. And I don’t know, things, things look better to me here. Don’t they look better to you? They look much better to me. I like it.

So just by improving the estimate over on the post table on that parent ID column, we were able to make better guesses about like what, what rows are going to come out of things. Oh, we got optimized bitmap 1077 that time.

A wonderful vintage of that bitmap. Wonderful vintage. Yeah. You know, we were able to improve some guesses. We were able to get faster queries and I think better query plans.

And sure. Like, you know, just like in the other video, we could go the next step and we could add, we could add indexes to tune this further. But I think getting a query down from several minutes to seven seconds is a pretty good start. So we’re going to pause there and actually we’re going to, we’re going to stop there completely.

And we are going to go record another video. Oh, but I wanted to, wanted to say with those statistics in place, we even get a good plan with things in the original order. So we, we still get the plan there. We didn’t even have to change the order anymore.

So lucky for us, isn’t that, isn’t that lucky for us? We can write this in any order we want now and things, things don’t get wacky. Ah, that’s amazing. Anyway.

Uh, thanks for watching and I will see you in the third and final installment of the Angry Aggregates. All right. Goodbye. All right.

Bye.

Going Further


If this is the kind of SQL Server stuff you love learning about, you’ll love my training. Blog readers get 25% off the Everything Bundle — over 100 hours of performance tuning content. Need hands-on help? I offer consulting engagements from targeted investigations to ongoing retainers. Want a quick sanity check before committing to a full engagement? Schedule a call — no commitment required.

Tuning Performance Problems With Aggregates In SQL Server, Part 1

1/3


Going Further


If this is the kind of SQL Server stuff you love learning about, you’ll love my training. Blog readers get 25% off the Everything Bundle — over 100 hours of performance tuning content. Need hands-on help? I offer consulting engagements from targeted investigations to ongoing retainers. Want a quick sanity check before committing to a full engagement? Schedule a call — no commitment required.

But WHY Does ISNULL Have To Scan A SQL Server Index?

No Answers


I wish I had an answer here, because sometimes when I think about these things it feels a bit silly.

Maybe someday.

This is the post I wrote over at Brent’s site that I reference in the video.

Video Summary

In this video, I delve into the intriguing behavior of SQL Server indexes when dealing with null values, specifically focusing on why a perfectly good index might be scanned rather than sought using `IS NULL` conditions. I walk through various examples, from scenarios where no indexes are present to cases involving an indexed column that is always null, exploring how these situations impact query plans and the optimizer’s decision-making process. Through these demonstrations, I aim to spark discussion on why SQL Server struggles with determining if a column filled entirely with nulls can be efficiently sought using `IS NULL`, even when the index data is known to contain only null values.

Full Transcript

Erik Darling here with Erik Darling Data. That’s cool, isn’t it? I’m hoping that second time’s a charm. The first time I recorded this video, I had the screen recorder positioned in the wrong place, so I missed like three-ish quarters of what I meant to record. So hopefully this time, everything is coming up lucky for me. And I wanted to ask this question, because I think it’s a question that will lead to a lot of other questions getting answered. And I think it’s an interesting question, specifically for databases, because of the way that indexes store data. And that question is, why, if we know the order of a column, does using something like isNull on that column result in a perfectly good index being scanned? I’m going to give you some examples. So let’s start off with nothing, right? We have no indexes on this table. I have query plans turned on. And if I run this query, I get two results back, and they are not going to be scanned.

So they are both the same result. 2465713. That is as phony as 50% of the phone numbers that I have gotten in my life. And when I look at the execution plan for these two phony phone numbers, I will see that they did roughly the exact same thing. The top query scan the top query scan the entire clustered index, read all 2465713 rows, and did not ask for an index because I wouldn’t expect it to because there’s no where clause. What would you index to improve this? There’s nothing. But the second query, where I say select count from the user’s table where age is null, I get a missing index request because there is a where clause where a SQL Server could filter data where it is null.

Not very interesting there at all. Where things start to get interesting to me is when I run queries like this. So let’s say that knowing that the entire age column is null, and knowing that nothing has changed in the database, there are no modifications to that column, like what would have gotten changed in the last two seconds?

I’m but a lowly consultant with just a simple demo database working for Erik Darling data. There we go. There we go. There’s that slow-mo bounce that I was looking for. If I run these two queries, I mean, I’m not going to get a missing index request.

Like SQL services like, index on age? Nah. Could never help. What would we do with that? How would we know? How would we know if it was null? We would never know. It’s crazy. It’s crazy to think about.

Even though in the first query we were just replacing a column that’s all null with a null, and in the second query we were replacing a column that’s all null with an empty string, you should be able to figure this out. SQL Server, you cost $7,000 a core.

For a standard edition, we can’t even get you to take more than 128 gigs of memory for the buffer pool. But you can’t figure out if a column that’s all null is null. This is what we’re stuck with.

I mean, if you budged on the memory thing, we might forgive you for this, but… Mamacito, what’s going on? This all gets even more interesting when we actually add an index that could be helpful.

So let’s add an index on this age column, which is always null. Now, it wasn’t always null, but I have it on the authority of the most senior DBA at Stack Overflow. That they recent…

Though, not recently, actually. They broke all my demos like two years ago. They started nullifying this column because of GDPR. So if you want to re-break my demos, I don’t know, repeal GDPR, do something like that.

So this is where things start to get a little bit more interesting for me, is now that we have an index on age just by itself, if we run a count against the age column where age is null, and we look at the query results and the query plan, we now have an index seek.

And this is an important question for all you people out there who get very hung up on if indexes have seeked or scanned to find their data. Is it really a seek if we read the entire index?

Hmm. Hmm. No. I hate to spoil this.

No, it’s not. Likewise, if we run this query where we say select count from users where is null age replaced with a null is null, all of a sudden, I mean, we no longer seek.

We now scan to read the entire index, but… Who cares? I think what’s interesting here is that even though we know that that entire index comprises null values, we do not…

We are not able to seek to any portion of it that might be null. Now, if this were a column that had some null values and some not null values, we create the index on it.

The index data would be sorted by nulls, and then whatever comes sequentially next. If it’s a number column, it could be negative numbers, and then positive numbers.

If it’s a string column, it could be numbers and then letters. It doesn’t matter too much. We just know that nulls come first. There should be no real pathological forensic reason for nulls to come last.

Even if we had the index definition as sort of descending, like what’s the worst that happens? We replace nulls at the end rather than nulls at the beginning.

Now, we have covered examples over several iterations of these queries where we have replaced the null in the column, in the indexed column, with a literal value, either a null or another number, or I think that’s all I’ve done.

But in all of these cases, we have had to scan. Now, I’m less forgiving for these cases because these cases are manure to me. The optimizer is very smart.

It’s been worked on by doctors for 30 years. If I had doctors working on me for 30 years and I still looked like this, I would get my money back. The optimizer has had doctors working on it for 30 years, and it still can’t figure out where nulls fall in an index.

That’s a little weird to me. Now, where I am forgiving, now where I understand why this might cause some weirdness, is if, let’s say, we said is null, a column, and then another column.

I’m partially forgiving of this. And I say I’m only partially forgiving of this because under normal circumstances, if you run is null against a column that does not allow nulls, it will skip the is null check, which is a departure from the coalesce function, which is internally a case expression, which will check that column regardless.

I blogged about this a while back on Brent’s site. If you’re really lucky, I’ll put a link to it in the description of this video. But that is absolutely true. If you have a not nullable column and you say is null not nullable column equals something, SQL Server will say I don’t need to run an is null check on this because I know that this column is not nullable.

Coalesce, it will still run the entire internal case expression. So if you’re ever looking for a reason to use is null over coalesce, there you have it. So where I am more forgiving is, let’s take an example where we select a count from users where we say is null age, even though we know all of age is null.

And then we compare it, maybe replace those null values for the count ID, which is at least a nullable column. Well, okay, fine.

If they’re not in an index together and they’re not sorted together, I totally understand why this would be confusing. But in the case where we take a column like age and replace it with the primary key clustered index, which you know is not nullable, but this could go for any column that is not nullable.

It doesn’t have to be this. I’m a little bit less understanding. Why would you be so confused over what’s null or not? So I think that a pretty fair thing to ask for would be if we have is null wrapped around a column that is indexed and we have that is null expression replacing the nullable column with a literal value, that literal value should be applied to the constant folding portion of index optimization.

We should take that literal value and we should be able to compare that pretty easily to another literal value. I don’t expect this to go for where is null age, some other value equals another column, or is null age, some other value equals, what was I saying?

No, is null age, another column equals something, but I do expect that like if we have an index on age, we should be able to at least see to that, like bare minimum, bare minimum, because we know, we know what’s going on in there.

We have that data sorted the way we want it. Anyway, I think I can hear my wife yelling at me through the door, so I’m going to get going and I’m going to go watch a television program.

I’m going to finish my tea while I watch a television program. But thank you for watching. I hope that I get to see you live and in person at an event so that I can give you a cool sticker.

Look at the rainbows on that thing. You are not having a stroke. You are seeing cool rainbows. So anyway, I hope to see you so I can give you a sticker.

I hope that you enjoyed this video. I hope that you at least thought about something, especially if you work at Microsoft. I hope you thought about something. And I will see you in another video, another time, another place.

Farewell.

Going Further


If this is the kind of SQL Server stuff you love learning about, you’ll love my training. Blog readers get 25% off the Everything Bundle — over 100 hours of performance tuning content. Need hands-on help? I offer consulting engagements from targeted investigations to ongoing retainers. Want a quick sanity check before committing to a full engagement? Schedule a call — no commitment required.
When Should You Index Temp Tables In SQL Server?

What I Mean Is


You already know that your temp table needs an index. Let’s say there’s some query plan ouchie from not adding one. You’ve already realized that you should probably use a clustered index rather than a nonclustered index. Adding a nonclustered index leaves you with a heap and an index, and there are a lot of times when nonclustered indexes won’t be used because they don’t cover the query columns enough.

Good. We’ve fixed you.

But, like, when should you create the index?

Options


You can do one of these things:

  • Inline, when you create the table
  • After you create the table
  • After you load data into the table

This requires a bit of testing to get right.

Inline


In many cases, this is the best option, for reasons outlined by Pam Lahoud.

Do not explicitly drop temp tables at the end of a stored procedure, they will get cleaned up when the session that created them ends.
Do not alter temp tables after they have been created.
Do not truncate temp tables
Move index creation statements on temp tables to the new inline index creation syntax that was introduced in SQL Server 2014.

Where it can be a bad option is:

  • If you can’t get a parallel insert even with a TABLOCK hint
  • Sorting the data to match index order on insert could result in some discomfort

After Creation


This is almost always not ideal, unless you want to avoid caching the temp table, and for the recompilation to occur for whatever reason.

It’s not that I’d ever rule this out as an option, but I’d wanna have a good reason for it.

Probably even several.

After Insert


This can sometimes be a good option if the query plan you get from inserting into the index is deficient in some way.

Like I mentioned up above, maybe you lose parallel insert, or maybe the DML Request Sort is a thorn in your side.

This can be awesome! Except on Standard Edition, where you can’t create indexes in parallel. Which picks off one of the reasons for doing this in the first place, and also potentially causes you headaches with not caching temp tables, and statement level recompiles.

One upside here is that if you insert data into a temp table with an index, and then run a query that causes statistics generation, you’ll almost certainly get the default sampling rate. That could potentially cause other annoyances. Creating the index after loading data means you get the full scan stats.

Hooray, I guess.

This may not ever be the end of the world, but here’s a quick example:

DROP TABLE IF EXISTS #t;
GO 

--Create a table with an index already on it
CREATE TABLE #t(id INT, INDEX c CLUSTERED(id));

--Load data
INSERT #t WITH(TABLOCK)
SELECT p.OwnerUserId
FROM dbo.Posts AS p;

--Run a query to generate statistics
SELECT COUNT(*)
FROM #t AS t
WHERE t.id BETWEEN 1 AND 10000
GO 

--See what's poppin'
SELECT hist.step_number, hist.range_high_key, hist.range_rows, 
    hist.equal_rows, hist.distinct_range_rows, hist.average_range_rows
FROM tempdb.sys.stats AS s
CROSS APPLY tempdb.sys.dm_db_stats_histogram(s.[object_id], s.stats_id) AS hist
WHERE OBJECT_NAME(s.object_id, 2) LIKE '#t%'
GO 
DROP TABLE #t;


--Create a query with no index
CREATE TABLE #t(id INT NOT NULL);

--Load data
INSERT #t WITH(TABLOCK)
SELECT p.OwnerUserId
FROM dbo.Posts AS p;

--Create the index
CREATE CLUSTERED INDEX c ON #t(id);

--Run a query to generate statistics
SELECT COUNT(*)
FROM #t AS t
WHERE t.id BETWEEN 1 AND 10000

--See what's poppin'
SELECT hist.step_number, hist.range_high_key, hist.range_rows, 
    hist.equal_rows, hist.distinct_range_rows, hist.average_range_rows
FROM tempdb.sys.stats AS s
CROSS APPLY tempdb.sys.dm_db_stats_histogram(s.[object_id], s.stats_id) AS hist
WHERE OBJECT_NAME(s.object_id, 2) LIKE '#t%'
GO 
DROP TABLE #t;
2020 02 11 12 22 38
Neckin’ Neck

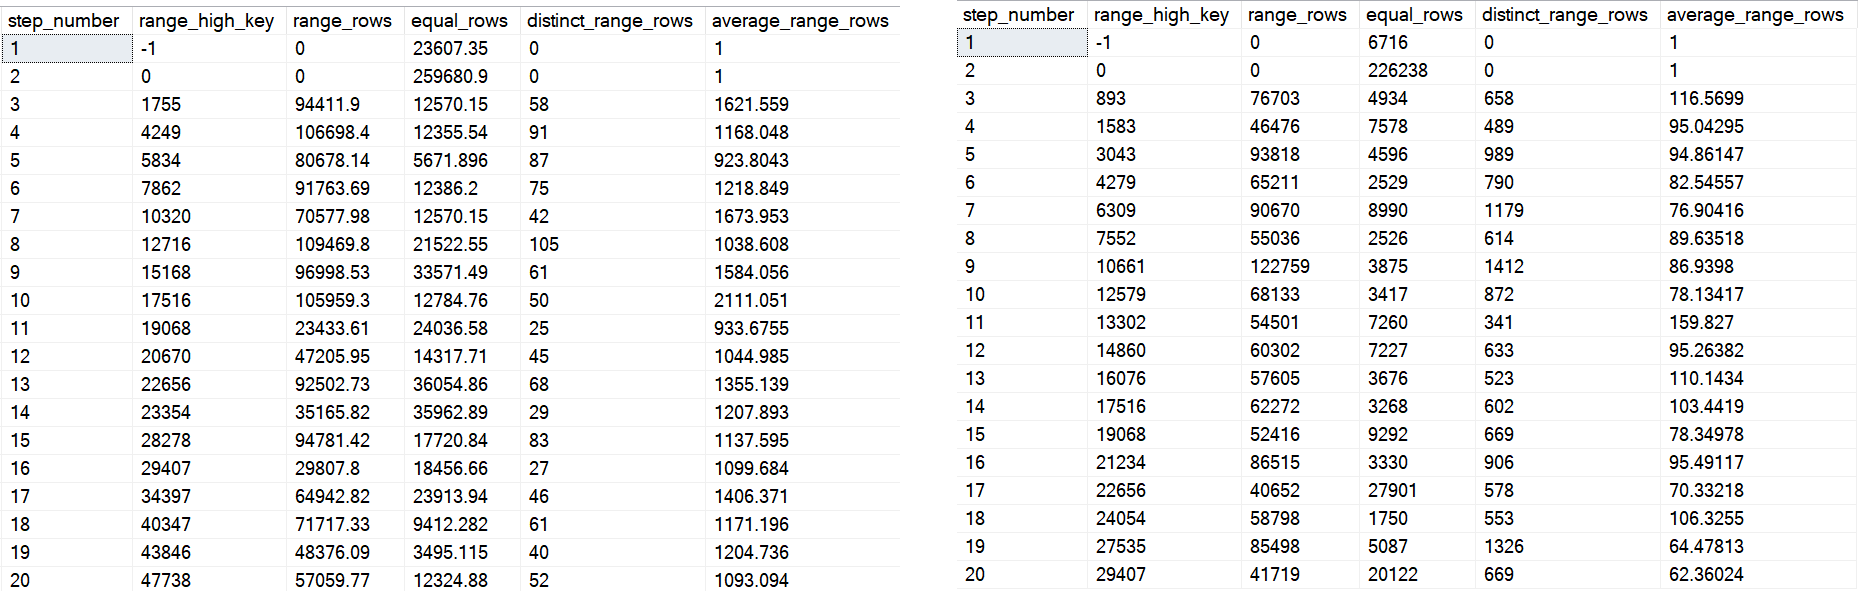
On the left is the first 20 steps from the first histogram, and on the right is the first 20 from the second one.

You can see some big differences — whether or not they end up helping or hurting performance would take a lot of different tests. Quite frankly, it’s probably not where I’d start a performance investigation, but I’d be lying if I told you it never ended up there.

All Things Considerateded


In general, I’d stick to using the inline index creation syntax. If I had to work around issues with that, I’d create the index after loading data, but being on Standard Edition brings some additional considerations around parallel index creation.

Thanks for reading!

Going Further


If this is the kind of SQL Server stuff you love learning about, you’ll love my training. Blog readers get 25% off the Everything Bundle — over 100 hours of performance tuning content. Need hands-on help? I offer consulting engagements from targeted investigations to ongoing retainers. Want a quick sanity check before committing to a full engagement? Schedule a call — no commitment required.
How Functions Can Make Performance Tuning SQL Server Queries Harder

Sensational


I’ve posted quite a bit about how cached plans can be misleading.

I’m gonna switch that up and talk about how an actual plan can be misleading, too.

In plans that include calling a muti-statement table valued function, no operator logs the time spent in the function.

Here’s an example:

SELECT TOP (100)
     p.Id AS [Post Link],
     vs.up,
     vs.down
FROM dbo.VoteStats() AS vs --The function
JOIN dbo.Posts AS p
    ON vs.postid = p.Id
WHERE vs.down > vs.up_multiplier
AND   p.CommunityOwnedDate IS NULL
AND   p.ClosedDate IS NULL
ORDER BY vs.up DESC

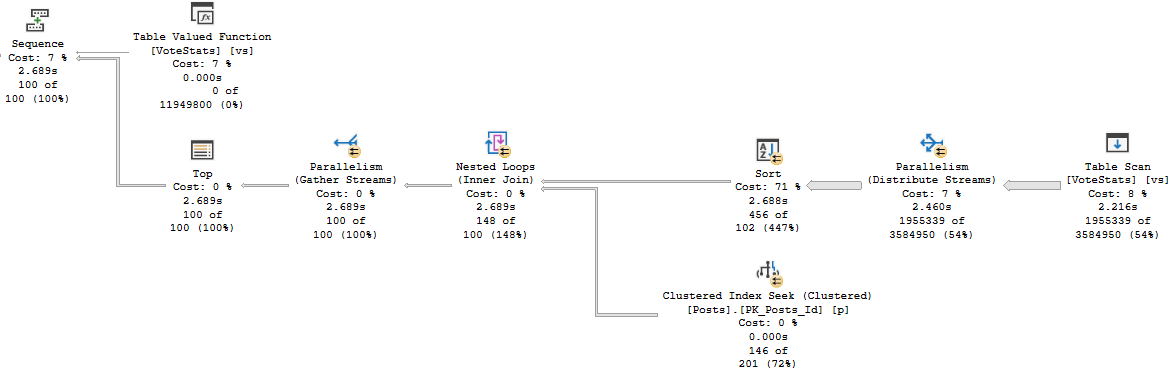
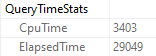
When I run the query, it drags on for 30-ish seconds, but the plan says that it only ran for about 2.7 seconds.

SQL Server Query Plan
As we proceed

But there it is in Query Time Stats! 29 seconds. What gives?

SQL Server Query Times From Execution Plan
Hi there!

Estimations


If we look at the estimated plan for the function, we can see quite a thick arrow pointing to the table variable we populate for our results.

SQL Server Query Plan
Meatballs

That process is all part of the query, but it doesn’t show up in any of the operators. It really should.

More specifically, I think it should show up right here.

SQL Server Query Plan

Thanks for reading!

Going Further


If this is the kind of SQL Server stuff you love learning about, you’ll love my training. Blog readers get 25% off the Everything Bundle — over 100 hours of performance tuning content. Need hands-on help? I offer consulting engagements from targeted investigations to ongoing retainers. Want a quick sanity check before committing to a full engagement? Schedule a call — no commitment required.

Help! My SQL Server Query Got Slower Without A NOLOCK Hint!

(NOSERIOUSLY)


Going Further


If this is the kind of SQL Server stuff you love learning about, you’ll love my training. Blog readers get 25% off the Everything Bundle — over 100 hours of performance tuning content. Need hands-on help? I offer consulting engagements from targeted investigations to ongoing retainers. Want a quick sanity check before committing to a full engagement? Schedule a call — no commitment required.

Scalar Aggregates Can Use Hash Matches With Batch Mode

GREAT


Video Summary

In this video, I share a minor yet intriguing discovery related to SQL Server 2019 and its batch mode for rowstore operations. Specifically, I delve into how the query optimizer behaves differently when running scale R aggregate queries—those that should return only one result—and how adding a phony GROUP BY clause can lead to unexpected execution plans. The video highlights the transition from row mode to batch mode in SQL Server 2019 and explains why this change might impact memory grants and stop-and-go operators, offering insights for those moving to or already using this version of SQL Server.

Full Transcript

Happy Sunday, isn’t it? What a, what a day, what a time, what a date time to be alive. The year get date, we are, we are alive and well and happy. I wanted to record a video before I go off to do other things about a very mild, minor discovery. I’m probably late to this discovery by months. But I don’t care. That never stopped me before. When I, I’ll, I’ll discover new things all day. Just the other day, I discovered South Brooklyn. It’s amazing. Can’t believe how well it was developed for something that I just discovered. Anyway, so with SQL Server 2019, we get batch mode for Roastore if we’re on Enterprise Edition and then compat level 150 and all sorts of things. other good stuff. But yeah, it used to be. Now I learned this from a, a Craig Friedman talk on the query processor, like years ago, that the only option when we run a, a scale R aggregate, meaning an aggregate that will only, only ever return one result. Like if I select some score from comments with this where clause, we’re only going to get one line back or one row back or whatever. But then we’re going to get one line back or whatever. But we’re going to get one line back or one row back or whatever. But we’re going to get one line back or one row back or whatever.

But if I were to say like group by user ID or group by post, then we get a whole list of scores. I mean, without, if we don’t put those columns in the select list, then, you know, it’s not very helpful because we don’t know which user, which, which posts we have the sum of scores for. But we could still do that and return a bunch of sums back, which is not helpful, but something we could do. With the old way of doing things in row mode plans, the only option available to the optimizer when you run a query like this is to use a stream aggregate. We have one stream there. This is a partial aggregate and then one stream over here and that’s a global aggregate and whatever. That’s, that’s nice. That’s all well and good. And I don’t know. It’s interesting. Now, what’s even more interesting, I think, is that even if we add a phony group by and we tell the optimizer, we’re like, buddy, listen, I want you to use a hash group on this. And we run this query.

Well, we, we don’t get an error. A lot of times if you add an option hint to a query and the optimizer can’t come up with a feasible execution plan, you’ll get that error. That’s like, yeah, I couldn’t generate a good plan. I can generate a plan based on those hints. Please remove them and try again. We don’t get that. We don’t get that here, but we also don’t get the hash group. We get one to stream aggregate. So we’re at, we have a very disobedient optimizer. We need to spank this optimizer. Optimizer needs a spank and probably a grounding and take its iPad away or something. But this all changes with SQL Server 2019, assuming you are on enterprise edition and also perhaps assuming that you are in compat level 150.

Now, if we run these queries, right, we select some creation date and slept blah, blah, blah, blah, blah, blah, blah, blah, option hash group. Now, when we run those, we can see that the optimizer had a hash match aggregate in the plan. We did not do the, the partial stream and then go serial and then another than the full stream aggregate. We have just a single hash match aggregate in here. It’s exciting stuff, right? Why, why do we have that? Well, in compat level 140, we were in row mode, but now the magic of compat level 150, our, our clustered index scan over here is, uh, is in batch mode.

Nice, nice. And our hash match aggregate over here is in batch mode. Nice, nice. There we go. All right. So why is that interesting? Why does that make a difference? Why is this a big deal? Well, there’s a couple things at play here. Uh, internally, uh, stream aggregates are, uh, non-blocking, meaning that, uh, like with, so like if you have a, a hash aggregate or a hash join, there is a pause within the query for the hash table to get built. And then when things begin probing, things carry on in the plan. That’s what they’re called blocking or stop and go operators.

Uh, stream aggregates don’t have that. The other thing about stream aggregates is that stream aggregates don’t require a memory grant where hash aggregates do because we need some scratch space to write all that stuff down in. So if you have queries where you’re, uh, uh, performing a scalar aggregate and, uh, perhaps where, uh, you had, you know, some reliance on there being a streaming operation or perhaps just where you didn’t have a memory grant before, you may find yourself having memory grants. Now you might find yourself having stop and go operations in your, in your query plans now, because with this additional choice available, we change the query plans that are available for these queries. So is this incredibly interesting?

Eh, it’s sort of interesting. Um, is this incredibly dangerous? Probably not any more dangerous than any of the, of the other possibilities that, uh, become, become available with, uh, batch mode on rowstore. But it is something interesting to consider. Um, you know, if, if you, especially if you are getting, uh, scalar aggregates for very large data sets, you may find that those, uh, those hash match aggregates ask for potentially large amounts of memory.

That could, that could change the, uh, the face of your workload if this is happening, like, during some overnight process that, like, populates, I don’t know, let’s just call it like ETL ish, right? Like you might load a bunch of summary data into a table. You might actually have an ETL process. You might actually do something. Uh, and like, you might even try to make it concurrent.

So you’re like, I’m going to do a bunch of these sums at once and I’m just going to send them on and, you know, pass stuff over. Whatever it is, whatever it is, it doesn’t matter. Just, it’s different. It’s new. It’s different. And I want to tell you about it. So I want you to be aware of it and I want you to not be astounded or shocked or dismayed when you find these new things in your query plans as you all slowly move to SQL Server 2019, which I think you should, because that’ll give me more interesting stuff to do, other than like, we must fix the function. We, this, this, this, this, this, this, this, this, this, this, this, this, this, this, this, this, this, and we got an inappropriate joy.

Like, there’s a lot of stuff that I, I wish we were all on SQL Server 2019. So I could, I could, I could start fixing more, more, more things than this sort of groundhog day stuff that it’s been a problem in SQL Server forever and ever. Anyway, I’m not going to turn down groundhog day work. Just keep in mind that, um, you know, SQL Server 2019 does fix a lot of the groundhog day stuff that has, has been shocking and dismaying and annoying and aggravating people for 20 years now.

So I’m excited. I can’t wait. I can’t wait for, uh, for it to be widely adopted or who knows, maybe by the time it’s, it’s even close to widely adopted, we’ll be on like SQL Server 2025 or something. Maybe I’ll have opened a gym by then. Maybe I’ll just not even be looking at SQL Server anymore. Who knows? Who knows? I don’t know.

Um, but heck, I’m optimistic about the future. All right. Goodbye. See you in the next video.

Going Further


If this is the kind of SQL Server stuff you love learning about, you’ll love my training. Blog readers get 25% off the Everything Bundle — over 100 hours of performance tuning content. Need hands-on help? I offer consulting engagements from targeted investigations to ongoing retainers. Want a quick sanity check before committing to a full engagement? Schedule a call — no commitment required.

SQL Server 2019: A Heuristic Evening With The Optimizer

The Land Of Do-Overs


Of the new things in SQL Server 2019 that I plan on presenting about, the Batch Mode on Row Store (BMOR, from here) enhancements are probably the most interesting from a query tuning point of view.

Things like Accelerated Database Recovery, Optimize For Sequential Key, and In-Memory Tempdb Metadata are cool, but they’re server tuning. I love’em, but they’re more helpful for tuning an entire workload than a specific query.

The thing with BMOR is that it’s not just one thing. Getting Batch Mode also allows Adaptive Joins and Memory Grant Feedback to kick in.

But they’re all separate heuristics.

Getting Batch Mode


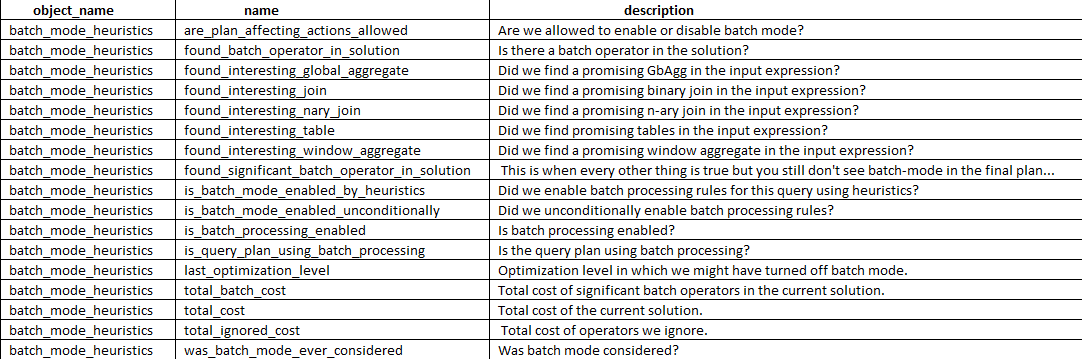
To get Batch Mode to kick in for a Row Store query, it has to pass a certain set of heuristics, which can be viewed in Extended Events.

SELECT dxoc.object_name, dxoc.name, dxoc.description
FROM sys.dm_xe_object_columns AS dxoc
JOIN sys.dm_xe_objects AS dxo
    ON  dxo.package_guid = dxoc.object_package_guid
    AND dxo.name = dxoc.object_name
WHERE dxo.name = 'batch_mode_heuristics' AND dxoc.column_type = 'data'
ORDER BY dxoc.name;

SQL Server Extended Events

Once we’ve got Batch Mode, we can use the other stuff. But they have their own jim-jams.

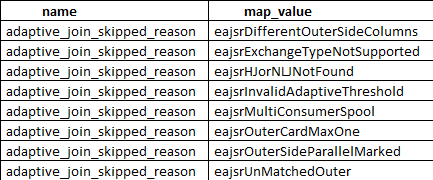
Getting Adaptive Joins


To get Adaptive Joins, you need to pass these heuristics.

SELECT dxmv.name,
       dxmv.map_value,
       dxo.description
FROM sys.dm_xe_map_values AS dxmv
    JOIN sys.dm_xe_objects AS dxo
        ON dxmv.object_package_guid = dxo.package_guid
           AND dxmv.name = dxo.name
WHERE dxmv.name = 'adaptive_join_skipped_reason';
SQL Server Extended Events
Try refreshing

No, those aren’t plain English, but you can decode most of them. They mostly deal with index matching, and cardinality making sense to go down this route.

Getting Memory Grant Feedback


There isn’t a lot in Extended Events to tell you when this will happen, but it is documented. And written about.

For excessive grants, if the granted memory is more than two times the size of the actual used memory, memory grant feedback will recalculate the memory grant and update the cached plan.  Plans with memory grants under 1MB will not be recalculated for overages.

For insufficiently sized memory grants that result in a spill to disk for batch mode operators, memory grant feedback will trigger a recalculation of the memory grant. Spill events are reported to memory grant feedback and can be surfaced via the spilling_report_to_memory_grant_feedback XEvent event. This event returns the node id from the plan and spilled data size of that node.

We can still see some stuff, though.

SELECT dxoc.object_name,
       dxoc.name,
       dxoc.description
FROM sys.dm_xe_object_columns AS dxoc
JOIN sys.dm_xe_objects AS dxo
ON dxo.package_guid = dxoc.object_package_guid
AND dxo.name = dxoc.object_name
WHERE dxo.name = 'memory_grant_feedback_loop_disabled'
AND dxoc.column_type = 'data'

UNION ALL 

SELECT dxoc.object_name,
       dxoc.name,
       dxoc.description
FROM sys.dm_xe_object_columns AS dxoc
JOIN sys.dm_xe_objects AS dxo
ON dxo.package_guid = dxoc.object_package_guid
AND dxo.name = dxoc.object_name
WHERE dxo.name = 'memory_grant_updated_by_feedback'
AND dxoc.column_type = 'data'
ORDER BY dxoc.name;
SQL Server Extended Events
Leeches

Getting All Three


In SQL Server 2019, you may see plans with Batch Mode operators happening for Row Store indexes, but you may not get an Adaptive Join, or Memory Grant Feedback. If you have a lot of single-use plans, you’ll never see them getting Memory Grant Feedback (I mean, they might, but it won’t matter because there won’t be a second execution, ha ha ha).

It’s important to remember that this isn’t all just one feature, but a family of them for improving query performance for specific scenarios.

On Enterprise Edition.

In compat level 150.

Say, where’d I put that scotch…

Thanks for reading!

Going Further


If this is the kind of SQL Server stuff you love learning about, you’ll love my training. Blog readers get 25% off the Everything Bundle — over 100 hours of performance tuning content. Need hands-on help? I offer consulting engagements from targeted investigations to ongoing retainers. Want a quick sanity check before committing to a full engagement? Schedule a call — no commitment required.