SQL Server Needs Built-In Performance Views

No, Not More DMVs


Though I would be cool with new ones, as long as they’re not memes.

When you’re trying to gauge some high level performance metrics on a new server, you probably have your favorite scripts.

They could be various Blitzes, they could be some stuff you’ve had sitting in your script folder, maybe they’re from the Tiger Toolbox.

Whatever.

The point is that you, dear reader, are smart and engaged enough to know about and use these things.

A lot of people aren’t.

I’m not talking about another thing to go find and install. I mean these should come with the product.

Perf Schema


It would be really cool if SQL Server had a system schema called perf. In there you could have views to all sorts of neat things.

It would exist in every database, and it would have views in it to fully assemble the mess of DMVs that accompany:

  • Query Store
  • Plan Cache
  • Index Usage
  • Missing Indexes
  • File Stats
  • Wait Stats
  • Locking
  • Deadlocks

Assembling all those views is painful for beginners (heck Query Store is painful for everyone). Worse, they may find scripts on the internet that are wrong or outdated (meaning they may not have new columns, or they may give outdated advice on things).

What would make these particularly helpful is that they could aggregate metrics at the database level. Server-wide counters are cool until your server is really wide, and it’s impossible to tell where stuff like wait stats are coming from. This wouldn’t be too difficult to implement, since Azure SQLDB already has to have a bunch of self-contained stuff, due to the lack of cross-database queries.

Best of all, Microsoft can keep them up to date based on which version and edition of SQL Server you’re on, and if certain changes get back ported.

Thanks for reading!

Going Further


If this is the kind of SQL Server stuff you love learning about, you’ll love my training. I’m offering a 75% discount to my blog readers if you click from here. I’m also available for consulting if you just don’t have time for that and need to solve performance problems quickly.
SQL Server 2019: WAIT_ON_SYNC_STATISTICS_REFRESH Redux

Here’s Another One


In the first post, I looked at a relatively large table. 50 million rows is a decent size.

But 50 million row tables might not be the target audience for this wait.

So, we’re gonna go with a >2 billion row table. Yes, dear reader, this table would break your PUNY INTEGER limits.

Slightly different


The full setup scripts are pretty long, but I’ll show the basic idea here.

Because this table is going to be fairly large, I’m gonna use clustered column store for maximum compressions.

USE StackOverflow2013;
GO

DROP TABLE IF EXISTS dbo.Vetos;
GO

CREATE TABLE dbo.Vetos
(
    Id INT NOT NULL,
    PostId INT NOT NULL,
    UserId INT NULL,
    BountyAmount INT NULL,
    VoteTypeId INT NOT NULL,
    CreationDate DATETIME NOT NULL,
    INDEX c CLUSTERED COLUMNSTORE
);


INSERT INTO dbo.Vetos WITH(TABLOCKX)
SELECT ISNULL(v.Id, 0) AS Id,
       v.PostId,
       v.UserId,
       v.BountyAmount,
       v.VoteTypeId,
       v.CreationDate
FROM
(
SELECT * FROM dbo.Votes
UNION ALL

-- I'm snipping 18 union alls here

SELECT * FROM dbo.Votes
) AS v;

The first test is just with a single statistics object.

CREATE STATISTICS s_UserId ON dbo.Vetos (UserId);

Fork In The Road


Since every sane person in the world knows that updating column store indexes is a donkey, I’m switching to an insert to tick the modification counter up.

INSERT INTO dbo.Vetos WITH(TABLOCKX)
SELECT ISNULL(v.Id, 0) AS Id,
       v.PostId,
       v.UserId,
       v.BountyAmount,
       v.VoteTypeId,
       v.CreationDate
FROM
(
SELECT * FROM dbo.Votes
UNION ALL
SELECT * FROM dbo.Votes
UNION ALL
SELECT * FROM dbo.Votes
UNION ALL
SELECT * FROM dbo.Votes
UNION ALL
SELECT * FROM dbo.Votes
) AS v;

Query Time


To test the timing out, I can use a pretty simple query that hits the UserId column:

SELECT COUNT_BIG(*)
FROM dbo.Vetos
WHERE UserId = 138
AND 1 = (SELECT 1);

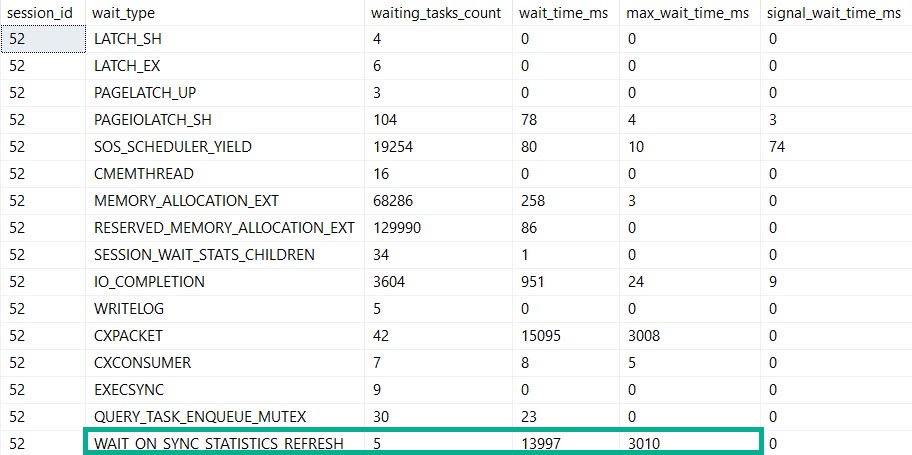
The query runs for ~3 seconds, and…

SQL Server Wait Stats
Takeover

We spent most of that three seconds waiting on the stats refresh.

I know, you’re looking at those parallelism waits.

But what if the stats update went parallel? I’ll come back to this in another post.

Query Times Two


If you’re thinking that I could test this further by adding more stats objects to the UserId column you’d be dreadfully wrong.

SQL Server will only update one stats object per column. What’s the sense in updating a bunch of identical stats objects? I’ll talk about this more in another post, too.

If I reload the table, and create more stats objects on different columns, though…

CREATE STATISTICS s_UserId ON dbo.Vetos (UserId);
CREATE STATISTICS s_PostId ON dbo.Vetos (PostId);
CREATE STATISTICS s_BountyAmount ON dbo.Vetos (BountyAmount);
CREATE STATISTICS s_VoteTypeId ON dbo.Vetos (VoteTypeId);
CREATE STATISTICS s_CreationDate ON dbo.Vetos (CreationDate);

And then write a bigger query after inserting more data to tick up modification counters…

SELECT COUNT(*)
FROM dbo.Vetos
WHERE UserId = 138
AND   PostId = 138
AND   BountyAmount = 138
AND   VoteTypeId = 138
AND   CreationDate = 138;
SQL Server Wait Stats
Dangalang

This query runs for 14 seconds, and all of it is spent in the stats update.

Bigger, Badder


Alright, prepare to be blown away: things that are fast against 50 million rows are slower against 2 billion rows.

That include automatic stats updates.

So yeah, if you’re up in the billion row range, automatic stats creation and updates might just start to hurt.

If you move to SQL Server 2019, you’ll have some evidence for when refreshes take a long time, but still nothing for when the initial creation takes a long time.

Thanks for reading!

Going Further


If this is the kind of SQL Server stuff you love learning about, you’ll love my training. I’m offering a 75% discount to my blog readers if you click from here. I’m also available for consulting if you just don’t have time for that and need to solve performance problems quickly.
What Is The PVS_PREALLOCATE Wait Type In SQL Server?

I was workload testing on SQL Server 2019 RC1 when I ran into a wait type I’d never noticed before: PVS_PREALLOCATE. Wait seconds per second was about 2.5 which was pretty high for this workload. Based on the name it sounded harmless but I wanted to look into it more to verify that.

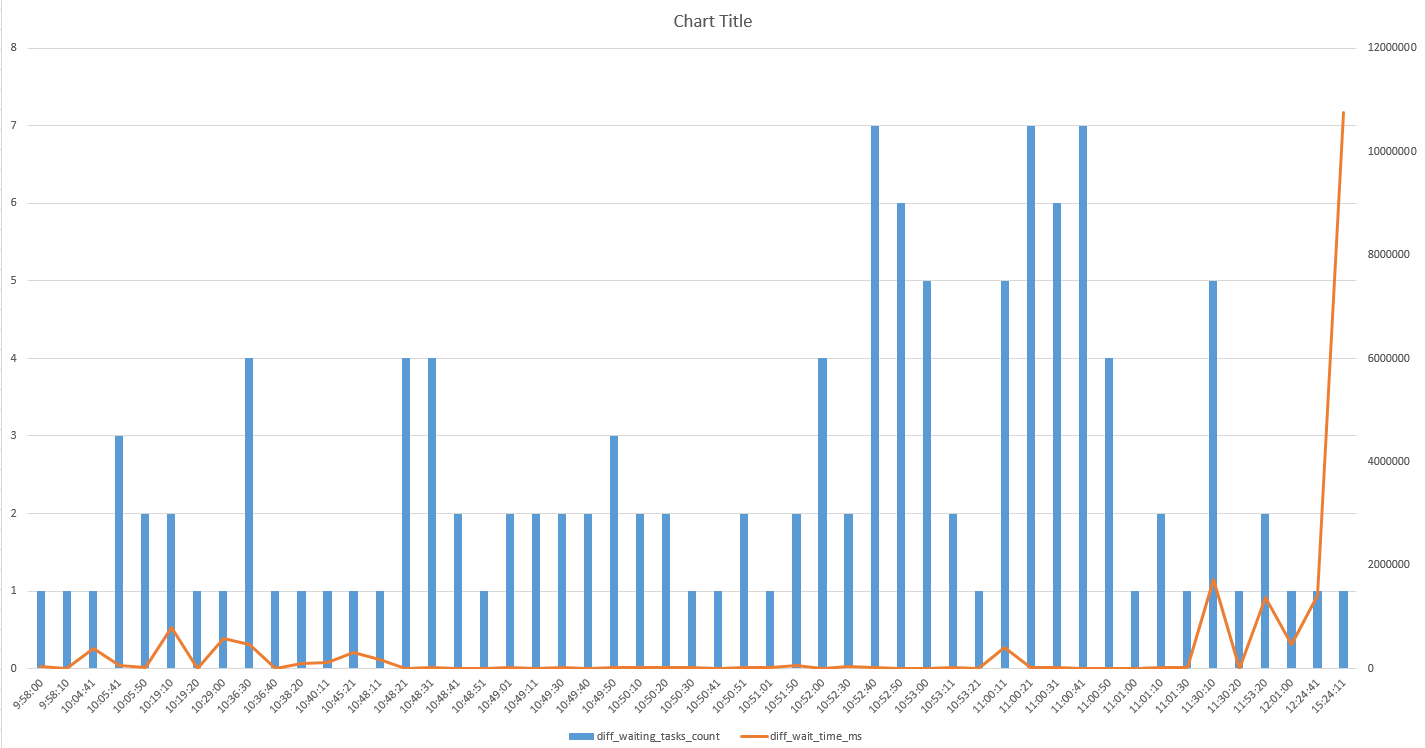
The first thing that I noticed was that total signal wait time was suspiciously low at 12 ms. That’s pretty small compared to 55000000 ms of resource wait time and suggested a low number of wait events. During testing we log the output of sys.dm_os_wait_stats every ten seconds so it was easy to graph the deltas for wait events and wait time for PVS_PREALLOCATE during the workload’s active period:

SQL Server Wait Stats

This is a combo chart with the y-axis for the delta of waiting tasks on the left and the y-axis for the delta of wait time in ms on the right. I excluded rows for which the total wait time of PVS_PREALLOCATE didn’t change. As you can see, there aren’t a lot of wait events in total and SQL Server often goes dozens of minutes, or sometimes several hours, before a new wait is logged to the DMV.

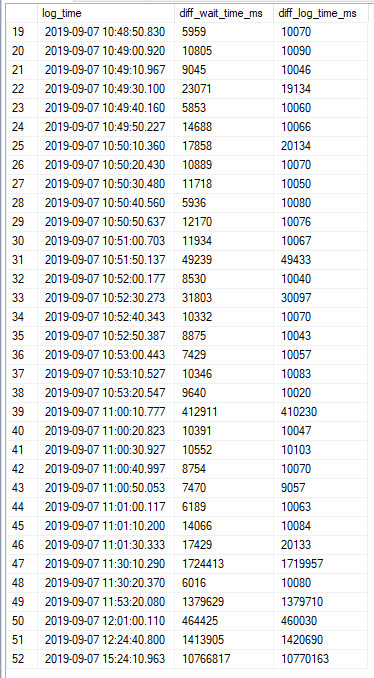
This pattern looked like a single worker that was almost always in a waiting state. To get more evidence for that I tried comparing the difference in logging time with the difference in wait time. Here are the results:

SQL Server Wait Times

Everything matches within a margin of error of 10 seconds. Wait stats are logged every 10 seconds so everything fits. The data looks exactly as it should if a single session was almost always waiting on PVS_PREALLOCATE. I was able to find said session:

SQL Server Wait Types

I did some more testing on another server and found that all waits were indeed tied to a single internal session id. The PVS_PREALLOCATOR process starts up along with the SQL Server service and has a wait type of PVS_PREALLOCATE until it wakes up and has something to do. Blogging friend Forrest found this quote about ADR:

The off-row PVS leverages the table infrastructure to simplify storing and accessing versions but is highly optimized for concurrent inserts. The accessors required to read or write to this table are cached and partitioned per core, while inserts are logged in a non-transactional manner (logged as redo-only operations) to avoid instantiating additional transactions. Threads running in parallel can insert rows into different sets of pages to eliminate contention. Finally, space is pre-allocated to avoid having to perform allocations as part of generating a version.

That’s good enough for me. This wait type appears to be benign from a waits stats analysis point of view and I recommend filtering it out from your queries used to do wait stats analysis.

Thanks for reading!

Going Further


If this is the kind of SQL Server stuff you love learning about, you’ll love my training. I’m offering a 75% discount to my blog readers if you click from here. I’m also available for consulting if you just don’t have time for that and need to solve performance problems quickly.
SQL Server 2019: WAIT_ON_SYNC_STATISTICS_REFRESH

Well Have You Ever


I mean ever really wondered just how long a query of yours waited on stats to automatically update before running?

Have you ever been absolutely, positively sure that those gosh dang darn stats updates were putting your query on the trolley to Slowsville?

Your wishes will be 100% granted in SQL Server 2019.

Now, this wait doesn’t show up when stats are created the first time.

So if you run a query with a where clause on a column that doesn’t already have stats, the initial gather won’t show.

This is only for updates. Not creates.

Got it?

In Action


The following script will take the Votes table, and make a copy of it called Vetos.

Then it’ll create a PK/CX (for some reason?), and run a query against a couple columns that are mostly NULL.

Voting data gets cleaned out of the SO data dump.

SELECT ISNULL(Id, 0) AS Id,
       PostId,
       UserId,
       BountyAmount,
       VoteTypeId,
       CreationDate
INTO dbo.Vetos
FROM dbo.Votes;

ALTER TABLE dbo.Vetos
 ADD CONSTRAINT PK_Vetos_Id 
    PRIMARY KEY CLUSTERED(Id);

SELECT TOP 10 * 
FROM dbo.Vetos 
WHERE UserId > 0 
AND BountyAmount > 0;

The last query is important because it generates the initial stats on both of those columns.

Now let’s put some work into it!

UPDATE v
SET v.BountyAmount = 50000
FROM dbo.Vetos AS v
WHERE v.BountyAmount IS NULL;

UPDATE v
SET v.UserId = v.VoteTypeId
FROM dbo.Vetos AS v
WHERE v.UserId IS NULL;

This table has 52,928,720 rows in it. Not the biggest, but a decent size to maybe have to wait on stats to update.

Ready Steady


In separate windows, I’ll run these:

SELECT COUNT(*) AS records
FROM dbo.Vetos AS v
WHERE v.BountyAmount > 500;

SELECT COUNT(*) AS records
FROM dbo.Vetos AS v
WHERE v.UserId < 16;

They’ll trigger the stats refresh.

Fun. Yes.

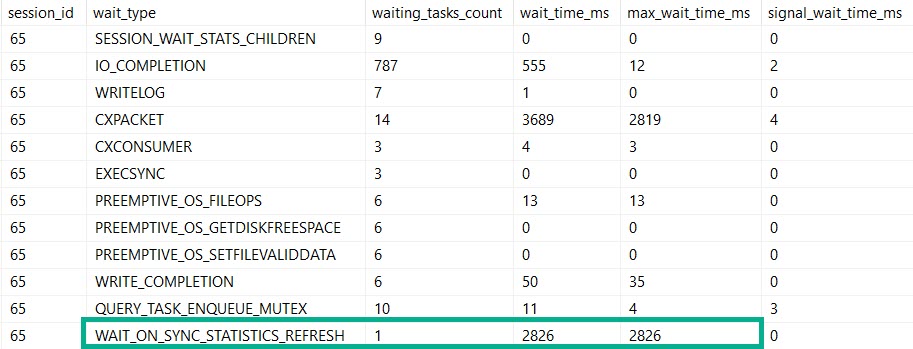
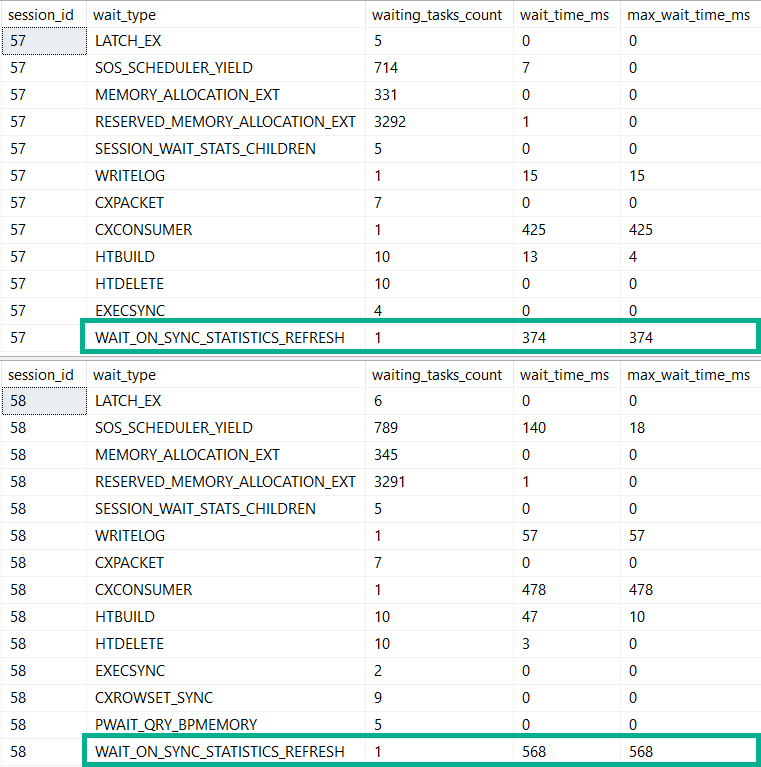
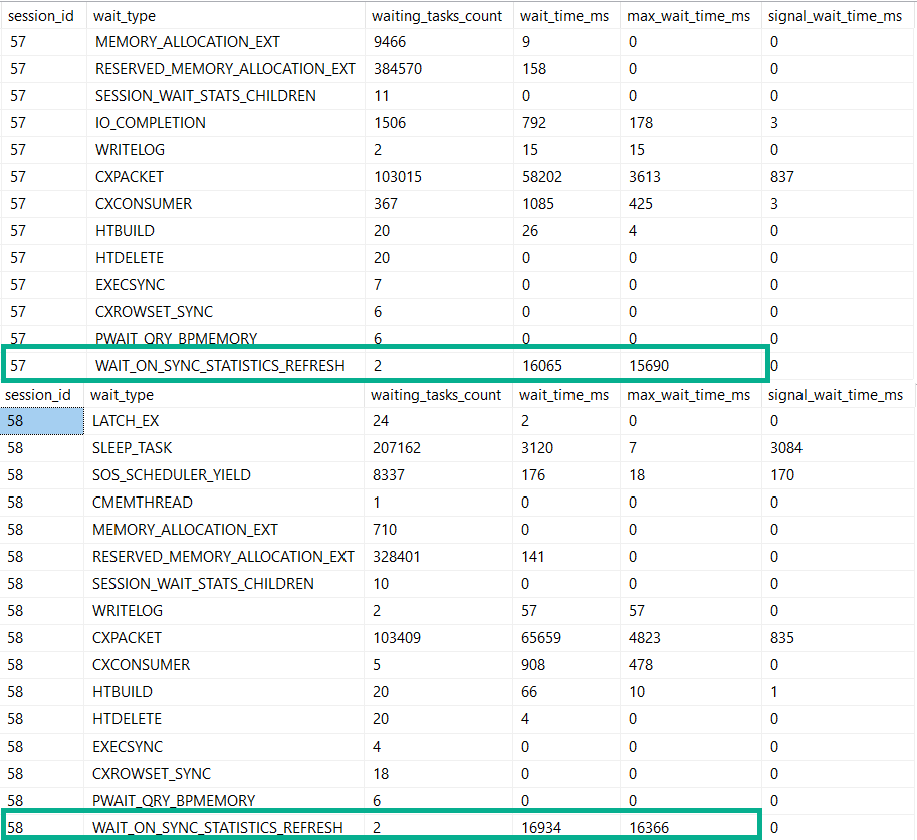
Checking in on each session’s wait stats using dm_exec_session_wait_stats, our wild wait appears.

SQL Server Wait Stats
I thought you were dead.

So there you have it. 52 million row stats refreshes take about half a second.

That wasn’t very exciting. Let’s try something else.

Tricks, Kids


If we start from scratch, but instead of letting SQL Server create stats automatically by running a query, let’s create statistics with some funny options, and then update the columns.

CREATE STATISTICS s_b ON dbo.Vetos(BountyAmount) 
WITH FULLSCAN, PERSIST_SAMPLE_PERCENT = ON;

CREATE STATISTICS s_u ON dbo.Vetos(UserId) 
WITH FULLSCAN, PERSIST_SAMPLE_PERCENT = ON;

Now, when we run our select queries, things really slow down.

SQL Server Wait Stats
Sunny

Quite a bit longer on those.

Actionable?


What would one do if they encountered 15-16 waits on this in real life?

Well, you have some options.

  • Update stats asynchronously
  • Create stats with no recompute and handle stats updates yourself
  • Update statistics more often than you currently do, trying to stay ahead of automatic updates

It’s hard to see this being a really big issue outside of very large tables, and perhaps only on under-powered servers.

Or if someone created statistics with some rather impolite settings.

Thanks for reading!

Going Further


If this is the kind of SQL Server stuff you love learning about, you’ll love my training. I’m offering a 75% discount to my blog readers if you click from here. I’m also available for consulting if you just don’t have time for that and need to solve performance problems quickly.

When Are Wait Stats Actually Useful For SQL Server Performance Tuning?

The People Who Stare At Plans


I’m going to be honest with you, dear readers. I’ve fallen out of like with wait stats.

Unless there’s a massive resource or blocking problem, they’re a bit bland.

Tuning a single query, I don’t look at them at all.

Sure, they can be a good detail when you’re painting an overall picture of a server, but they’re misleading a lot.

They could be more useful, if:

  • You knew when they happened
  • You knew which queries caused them
  • You knew which queries were impacted by them

Let’s say I look at your server. Let’s say I run any script that analyzes wait stats.

Even Your Worst


Holy cow, you sure have a lot of (THREADPOOL, RESOURCE_SEMAPHORE) waits here, pal.

You got a big problem with hardware.

Well, maybe.

Let’s say they happen at night, when no one’s around.

We could sit there all day hitting F5 and never see a sign of the problem.

It sure would be nice to know when they happened.

It Was Really Something


Not everyone’s server is a 24/7 performance nightmare.

Lots of people have servers that get steadily used from 9-5, but don’t really have spikes normally.

Except at the beginning or end of the month/year/quarter.

If you look at wait stats in general, the server might look very bored most of the time.

All those sums and averages smooth out over time.

Most people don’t always have a heart rate of 180 bpm, but they might for the 5 minutes they have a heart attack.

That’s sort of important.

The Sanest Days Are Mad


What if we see a lot of long lock waits?

I bet users are really mad about those.

Have you heard about our Lord and Savior, RCSI?

You’re definitely gonna need that.

Which database?

Oh, that logging database that users never query.

Darn.

Again, knowing which queries were on the giving and receiving end of that would be stellar.

Toolio, My Toolio


It’s not that wait stats themselves are dull, it’s the way we’re forced to look at them today.

You either have to hit F5 at the magic moment to catch them, log them on your own, or buck up for a monitoring tool.

It’s a matter of how and what, and when data gets logged for them, not a matter of tool quality.

I’d love to see a more complete picture of these things when trying to diagnose or troubleshoot issues.

Thanks for reading!

Going Further


If this is the kind of SQL Server stuff you love learning about, you’ll love my training. I’m offering a 75% discount to my blog readers if you click from here. I’m also available for consulting if you just don’t have time for that and need to solve performance problems quickly.
Too Much Of A Harmless SQL Server Wait Type Can Be Harmful

Absence Of Evidence


There’s a pinky-out saying about wine: don’t hate the grape.

People say it because the same kind of grape can be grown by different people in different places.

Due to many, ahem, local factors, wine made with that grape can taste miraculously different.

It’s with that in mind that I’m going to say this: don’t ignore the wait.

No matter what script you’re using to look at wait stats, try unquoting the ignoreable list and seeing what shows up.

Get curious. Poke around. You might find something interesting.

Twosifer


While experimenting with FROID, I came up with a function and query that generate some weird waits.

Those waits are EXECSYNC, and CXCONSUMER. Now, under normal circumstances, you might be able to ignore them.

But things are rarely normal when you’re experiencing performance problems, are they? If you ignore too much, you can miss big problems.

Going back to running this query, I can see the wait stats that get generated in sys.dm_exec_session_wait_stats when the query is finished.

SELECT u.DisplayName, 
       dbo.TotalScore(u.Id) AS TotalScore
FROM dbo.Users AS u
WHERE u.Reputation >= 200000
ORDER BY u.Id;

Here’s what those waits look like:

SQL Server Wait Stats
Better Off Dead

If one were to follow advice — even advice from Microsoft — one may miss important clues as to what happened.

CXCONSUMER waits being high is fairly tightly correlated to skewed parallelism, and this is no exception.

EXECSYNC represents a serial zone within a parallel plan, in this case building two Eager Index Spools:

SQL Server Query Plan
SPOOL-TA-TOES

When you spend a long time building indexes single threaded, you spend a long time waiting on CXCONSUMER (and not so much time at all waiting on CXPACKET).

Being able to put the waits together with the query plan can help you tune queries more efficiently.

This is especially true if you’re on earlier versions of SQL Server/SSMS where the kind of detail shown in query plans here doesn’t exist.

Thanks for reading!

Running Query Confusion In SQL Server

Somewhat Solved


This bit of confusion is largely solved in SQL Server 2019 under compatibility level 150, when FROID (scalar udf inlining) kicks in.

But, you know, we’re a ways off from 2019 dropping, being adopted, and compat level 150 being the operating norm.

So here goes!

Functional Querying


I’ve got a scalar valued function. What it does is unimportant, but I’m calling it in a query like this:

SELECT u.DisplayName, 
       dbo.TotalScore(u.Id) AS TotalScore --<functione
FROM dbo.Users AS u
WHERE u.Reputation >= 200000
ORDER BY u.Id;

When I run this in SSMS, it’s obvious to us what’s going on.

But if I’m watching what’s happening on a server using sp_WhoIsActive, what’s going on might not be obvious.

I’m doing all this with just my query running to show how confusing things can get.

First Confusion: Query Text

SQL Server sp_WhoIsActive
Foggy

This doesn’t look at all like the text of our query. We can guess that it’s the function running in the select list since we know what we’re doing, but, you know…

We can bring some clarity by running sp_WhoIsActive like this:

sp_WhoIsActive @get_plans = 1, 
               @get_outer_command = 1;

The outer command parameter will show us the query calling the function, which’ll look more familiar.

SQL Server sp_WhoIsActive
Headline News

Second Confusion: Phantom Parallelism

We’re hitting more of those harmless, silly little CXCONSUMER waits.

But how? Our query plan is serial!

SQL Server Query Plan
Glam Chowder

This part is a little less obvious, but if we get an estimated plan for our query, or track down the query plan for the function, it becomes more obvious.

SQL Server Query Plan
Questionable Taco

The query plan for the function is parallel — a cute ~nuance~ about scalar udfs is that they only prevent the query calling them from going parallel.

The function itself can go parallel. So that’s… nice.

I guess.

They Walked Inlined


In compat level 150, things are more clear.

SQL Server sp_WhoIsActive
CLRLY

The inner and outer text are the same. There’s more of that CXCONSUMER, though. Hoowee.

SQL Server Query Plan
Might as well jump.

But at least now we have a query plan that matches the parallel waits, right?

In the next post, we’re gonna talk more about those wait stats, though.

Thanks for reading!

What Are Your Weirdest SQL Server Wait Stats?

Common People


I know, you probably have questions about CXPACKET.

Maybe you look at a wait stats report and nod sagely at the caps lock extravaganza of variably descriptive names.

The unformatted numbers that you tally on your fingers, and then have to look up what 12 digits is.

When you search around, you can figure out what most of your waits are, and why they happen. You might even be able to figure out how to fix them.

(I know, you’re gonna read advice on a blog from 2003 telling you to set “MaxDOP” to 1, but forchrissakes don’t do it.)

What I’m looking for are waits that pop up, but you haven’t been able to find answers to. The real nut crackers.

If you’ve got those, leave a comment and let me know.

Going Further


If this is the kind of SQL Server stuff you love learning about, you’ll love my training. I’m offering a 75% discount to my blog readers if you click from here. I’m also available for consulting if you just don’t have time for that and need to solve performance problems quickly.
Hey SQL Server Query, What Were You Waiting On?

Surreal Plans


In a parallel plan with an eager index spool, we can observe EXECSYNC waits for the duration of the spool being built.

In a serial plan, we’re not so lucky. There’s no obvious wait that indicates we built an index.

Let’s run a familiar query:

SELECT      TOP ( 10 )
            u.DisplayName, 
			u.Reputation, 
			ca.*
FROM        dbo.Users AS u
CROSS APPLY 
(   
    SELECT   TOP ( 1 )
			   p.Score
    FROM     dbo.Posts AS p
    WHERE    p.OwnerUserId = u.Id
    AND      p.PostTypeId = 1
    ORDER BY p.Score DESC 
) AS ca
ORDER BY    u.Reputation DESC;

The plan is fully serial:

SQL Server Query Plan
Meat Lovers

It’s obvious looking at the actual plan in SSMS 18 what took a long time.

If we’re not so lucky, and we have a cached plan, it would be less obvious:

SQL Server Query Plan
Back Like That

Look how bad scans are! Ha ha ha!

?

What’s A Wait?


If you wanna figure out the runtime, you have to do some math.

SQL Server Wait Stats
What times what?

If you take the SOS_SCHEDULER_YIELD waits and multiply them by 4ms, you can get about accurate runtime (12,444).

We’re lucky on my laptop that our query isn’t competing with other queries for processor time, so there’s not a long queue to get back on a CPU on each yield.

It’s nice to be able to see this while we’re watching a query, but if we come across it in the plan cache, or if we were looking at wait stats, what would we make of the problem?

Surely an operator that’s only 13% of the plan cost couldn’t be responsible for all that.

??

But There We Have It


A query that runs for a non-trivial amount of time, emits common wait stats, and doesn’t ask for an index when it’s creating one.

And that index creation is what makes up for 99% of the execution time.

Thanks for reading!

Going Further


If this is the kind of SQL Server stuff you love learning about, you’ll love my training. I’m offering a 75% discount to my blog readers if you click from here. I’m also available for consulting if you just don’t have time for that and need to solve performance problems quickly.

Eager Index Spool Annoyances In SQL Server

Don’t Mask Spools


Certain spools in SQL Server can be counterproductive, though well intentioned.

In this case, I don’t mean that “if the spool weren’t there, the query would be faster”.

I mean that… Well, let’s just go look.

Bad Enough Plan Found


Let’s take this query.

SELECT TOP (50) 
    u.DisplayName, 
    u.Reputation, 
    ca.*
FROM dbo.Users AS u
CROSS APPLY 
(
    SELECT TOP (10) 
        p.Id, 
        p.Score, 
        p.Title
    FROM dbo.Posts AS p
    WHERE p.OwnerUserId = u.Id
    AND   p.PostTypeId = 1
    ORDER BY 
        p.Score DESC
) AS ca
ORDER BY 
    u.Reputation DESC;

Top N per group is a common enough need.

If it’s not, don’t tell Itzik. He’ll be heartbroken.

The query plan looks like this:

SQL Server Query Plan
Wig Billy

Thanks to the new operator times in SSMS 18, we can see exactly where the chokepoint in this query is.

Building and reading from the eager index spool takes 70 wall clock seconds. Remember that in row mode plans, operator times aggregate across branches, so the 10 seconds on the clustered index scan is included in the index spool time.

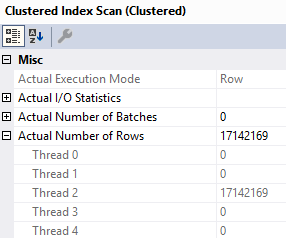
One thing I want to point out is that even though the plan says it’s parallel, the spool is built single threaded.

SQL Server Query Plan Properties
One Sided

Reading data from the clustered index on the Posts table and putting it into the index is all run on Thread 2.

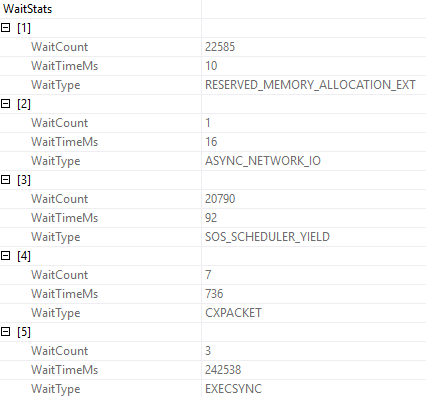
If we look at the wait stats generated by this query, a full 242 seconds are spent on EXECSYNC.

SQL Server Wait Stats In Query Plans
Armless

The math mostly works out, because four threads are waiting on the spool to be built.

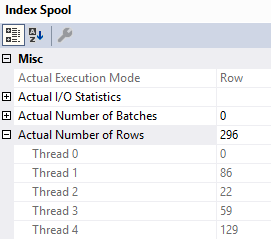
Even though the scan of the clustered index is serial, reading from the spool occurs in parallel.

SQL Server Query Plan Properties
Spange

Connected


Eager index spools are built per-query, and discarded afterwards. When built for large tables, they can represent quite a bit of work.

In this example query, a 17 million row index is built, and that’ll happen every single time the query executes.

While I’m all on board with the intent behind the index spool, the execution is pretty brutal. Much of query tuning is situational, but I’ll always pay attention to an index spool (especially because you won’t get a missing index request for them anywhere). You’ll wanna look at the spool definition, and potentially create a permanent index to address the issue.

As for EXECSYNC waits, they can be generated by other things, too. If you’re seeing a lot of them, I’m willing to bet you’ll also find parallel queries with spools in them.

Thanks for reading!

Going Further


If this is the kind of SQL Server stuff you love learning about, you’ll love my training. I’m offering a 75% discount to my blog readers if you click from here. I’m also available for consulting if you just don’t have time for that and need to solve performance problems quickly.