The Waiting Life Of A SQL Server Query

Smoking Ain’t Allowed In School


While working on my new training, part of what I want to show people is how to match what happens in a query plan to the type of wait stats they’ll see on their servers.

Take this query plan for example:

SQL Server Query Plan
Nose Boop™

There are THINGS GOING ON HERE! Scans, parallelism, sorting, spilling.

What do the waits look like for this query?

SQL Server Wait Stats

Spy vs Spy


It’s fairly easy to focus in on what a session is doing using sys.dm_exec_session_wait_stats, though there are some caveats about when the numbers reset.

On my laptop, I can just open a new SSMS tab without worrying about connection pooling or any weird app stuff.

When I do, these are the waits I see while the query runs.

Every single one of those waits is accounted for by something that happened in the query plan (or its attributes).

Breakdown


Our pages weren’t in memory, so we read them from disk (PAGEIOLATCH_SH), we had to allocate buffer pool memory (MEMORY_ALLOCATION_EXT), we used parallelism (both CX waits), we needed memory to sort data (RESERVED_MEMORY_ALLOCATION_EXT), we didn’t get enough so we spilled (IO_COMPLETION), and we returned data to SSMS (ASYNC_NETWORK_IO).

LATCH_EX can be a lot of things. In a parallel plan, it can be associated with exchange buffers and the parallel page supplier.

The goal here is for you to both look at a server’s wait stats and come up with a mental image of the types of queries you’re going to see, and be able to tie query plan operators and attributes back to wait stats.

Thanks for reading!

Stop Looking At SQL Server Wait Stats Without Looking At Server Uptime

Economy Of Waits


There’s a joke about two economists walking down the street.

One of them asks the other how they’re doing.

The punchline is that their response is “compared to what?”

It’s not the best joke, and it’s something to keep in mind when you’re measuring anything, but SQL Server specifically.

This isn’t a post about collecting baselines, though it’s a relevant concept.

Scenery, Yo


One of the best ways to find bottlenecks in SQL Server is to look at wait stats.

Lots of scripts and monitoring tools will show you top waits, percentages, signal waits, and even percentages of signal waits.

Oh baby, those datapoints.

But there’s frequently a missing axis: compared to what?

Weakly Links


Let’s say you’ve got 604,800 seconds of CX packet waits.

Let’s also say they’re 95% of your total server wait stats.

How does your opinion of that number change if your server has been up for:

  • One Day (86,400 seconds)
  • One Week (604,800 seconds)
  • One Month (2,592,000 seconds)
  • One Year (31,536,000 seconds)

Obviously, if your server has been up for a day, you might wanna pay more attention to that metric.

If your server has been up for two weeks, it becomes less of an issue.

Seven Year Abs


I’ll give you another example: OH MY GOD YOU ATE 20,000 CALORIES.

  • In a day, that might be cause for concern
  • In a week, you’re about average
  • In a month, you might need medical attention
  • In a year, well, you’re probably more calorically important to worms

Compared to what is a pretty important measure.

Forced Perspective


I get it. Someone can clear out wait stats, and judging uptime can be unreliable, and more difficult up in the cloud.

Looking at wait stats without knowing the period of time they were collected over isn’t terribly helpful.

I’d opened an issue to at least separate wait stats by database, though Microsoft doesn’t seem to be too into my idea.

Thanks for reading!

Going Further


If this is the kind of SQL Server stuff you love learning about, you’ll love my training. I’m offering a 75% discount to my blog readers if you click from here. I’m also available for consulting if you just don’t have time for that and need to solve performance problems quickly.

A SQL Server Memory Grant Helper Query For The Sentry One Repository

SEMA4


While working with a client, I came up with a query against the SentryOne repository.

The point of it is to find queries that waited more than a second to get a memory grant. I wrote it because this information is logged but not exposed in the GUI yet.

It will show you basic information about the collected query, plus:

  • How long it ran in seconds
  • How long it waited for memory in seconds
  • How long it ran for after it got memory
SELECT   HostName,
         CPU,
         Reads,
         Writes,
         Duration,
         StartTime,
         EndTime,
         TextData,
         TempdbUserKB,
         GrantedQueryMemoryKB,
         DegreeOfParallelism,
         GrantTime,
         RequestedMemoryKB,
         GrantedMemoryKB,
         RequiredMemoryKB,
         IdealMemoryKB,
         Duration / 1000. AS DurationSeconds,
         DATEDIFF(SECOND, StartTime, GrantTime) AS SecondsBetweenQueryStartingAndMemoryGranted,
         (Duration - DATEDIFF(MILLISECOND, StartTime, GrantTime)) / 1000. AS HowFastTheQueryRanAfterItGotMemory
FROM     PerformanceAnalysisTraceData
WHERE DATEDIFF(SECOND, StartTime, GrantTime) > 1
ORDER BY SecondsBetweenQueryStartingAndMemoryGranted DESC

The results I saw were surprising! Queries that waited 10+ seconds for memory, but finished instantly when they finally got memory.

If you’re a Sentry One user, you may find this helpful. If you find queries waiting a long time for memory, you may want to look at if you’re hitting RESOURCE_SEMAPHORE waits too.

Thanks for reading!

Going Further


If this is the kind of SQL Server stuff you love learning about, you’ll love my training. I’m offering a 75% discount to my blog readers if you click from here. I’m also available for consulting if you just don’t have time for that and need to solve performance problems quickly.

Video: Is Setting MAXDOP and Cost Threshold for Parallelism Really Easy?

Asked and Answered


Thanks for watching!

Going Further


If this is the kind of SQL Server stuff you love learning about, you’ll love my training. I’m offering a 75% discount to my blog readers if you click from here. I’m also available for consulting if you just don’t have time for that and need to solve performance problems quickly.

Troubleshooting THREADPOOL Waits In SQL Server With A Plan Cache Query

You Come And Go


When THREADPOOL strikes, even the best monitoring tools can have a bunch of blank spots hanging around in them.

If you’re on SQL Server 2016 or better, there are some helpful columns in sys.dm_exec_query_stats.

WITH threads
    AS
     (
         SELECT   TOP (10)
                  deqs.sql_handle,
                  deqs.plan_handle,
                  deqs.total_reserved_threads,
                  deqs.last_reserved_threads,
                  deqs.min_reserved_threads,
                  deqs.max_reserved_threads,
                  deqs.total_used_threads,
                  deqs.last_used_threads,
                  deqs.min_used_threads,
                  deqs.max_used_threads,
                  deqs.execution_count
         FROM     sys.dm_exec_query_stats AS deqs
         WHERE    deqs.min_reserved_threads > 0
         ORDER BY deqs.max_reserved_threads DESC
     )
SELECT      t.execution_count,
            t.total_reserved_threads,
            t.last_reserved_threads,
            t.min_reserved_threads,
            t.max_reserved_threads,
            t.total_used_threads,
            t.last_used_threads,
            t.min_used_threads,
            t.max_used_threads,
            CASE WHEN (t.min_reserved_threads * 2) < t.max_reserved_threads 
                 THEN 'maybe'
                 ELSE 'maybe not'
            END AS [sniffy?],
            d.query_plan
FROM        threads AS t
CROSS APPLY sys.dm_exec_query_plan(plan_handle) AS d
ORDER BY    t.execution_count DESC, t.max_used_threads DESC;

On My Laptop


Which doesn’t have anything terribly interesting on it at the moment, I get this back.

SQL Server Query Results
Egg salad

I have my results weighted towards what’s executed the most, then by how many threads they wanted to reserve.

This could give you a good idea about which queries contributed to THREADPOOL problems.

Keep in mind that, regardless of how many threads the queries end up using, they’ll reserve as many as they want (unless DOP is downgraded due to CPU pressure).

If they get blocked, they hold onto those threads.

If those threads aren’t available when they start running, they’ll either wait for them to show up, or run at a lower DOP.

What Should You Do Here?


  • Take a look at the query plans: Are there any home dunk missing indexes?
  • Take a look at the query text: Is there some obvious problem, like a non-SARGable predicate that you can fix?
  • Take a look at your server: Are MAXDOP and CTFP set correctly?
  • Take a look at the predicates: Is there some bad parameter sniffing going on (check the sniffy column for swings in threads)

Thanks for reading!

Going Further


If this is the kind of SQL Server stuff you love learning about, you’ll love my training. I’m offering a 75% discount to my blog readers if you click from here. I’m also available for consulting if you just don’t have time for that and need to solve performance problems quickly.

Is The SQL Server Really Slower Than It Used To Be?

Economy Of Words


When someone says that something is slower than it was before, whether it’s a query, a whole SQL Server, a website, or an app screen, it’s almost never while the perceived slowness is happening, nor is it reproducible (especially when a consultant is watching).

There are some basic things you need to have historical record of if you wanna figure it out:

  • What queries were running
  • What queries were waiting on
  • What was different from last time those queries ran

Microsoft has taken some steps to help us figure this out with Query Store, but really only for SQL Server 2017, when aggregated wait stats were added to the family of Query Store views.

But if you’re like most people, you’re not on SQL Server 2017, and even further into that segment, you don’t have Query Store enabled.

I think there’s more Microsoft could do to improve data that’s collected, but right now it’s just a collection of votes.

Right now, the GUI is so limited in what you can search for that I wrote a sp_QuickieStore to make working with the data easier.

Compared To What?


If you’re on older versions of SQL Server, including those about to be taken off life support, what are your options?

For Free!

For Money!

There’s a whole landscape of SQL Server monitoring tools out there, as well as things people get confused with SQL Server monitoring tools.

Ultimately, the best monitoring tool for you is one you:

  • Will actually use
  • Will enable you to find problems
  • Will enable you to solve problems

Getting overwhelmed with meaningless metrics (there were how many logouts per second?!), standalone charts that don’t allow you to correlate system activity to resource usage (save as image?!), or long lists of queries that may or may not run when anyone cares (yes, CHECKDB did a lot of reads, thanks) doesn’t help anyone. If that sounds like your monitoring tool, it might be time to trade it for a carton of Gatorade.

You’ve got a glorified FitBit strapped onto your SQL Server.

Here And Now


What’s currently happening on your SQL Server is often only a symptom of what’s been happening on your SQL Server for a long time.

There are very few problems I’ve seen that are truly “sudden”, unless someone recently made an ill-advised change to the server, like dropping an important index, etc.

The longer you let things like aging hardware, growing data, and ignoring query and index problems go, the worse things get.

Monitoring your server is a good first step, but it’s still up to you to address the problems, and address the right problems.

Thanks for reading!

Going Further


If this is the kind of SQL Server stuff you love learning about, you’ll love my training. I’m offering a 75% discount to my blog readers if you click from here. I’m also available for consulting if you just don’t have time for that and need to solve performance problems quickly.

What is the SOS_WORK_DISPATCHER Wait Type In SQL Server?

Upon upgrading to SQL Server 2019 CTP2, you may see the new SOS_WORK_DISPATCHER wait type at the top of the list:

a35_server_waits

The above screenshot is server level wait stats from my four core desktop after SQL Server was running for a few hours. SQL Server wasn’t really doing much since start up, so it felt unlikely that this wait was a sign of a problem. However, I was curious about what this wait type meant and wanted to know more.

A Call to Call Stacks


One of the few good things to come out of twitter was an announcement that public symbols are now available for SQL Server 2019 CTP2:

I for one appreciate the new, more open, Microsoft. Access to public symbols makes investigating unknown wait times significantly easier. Further helping the cause is the fact that the new wait type happens many times a second even when you aren’t doing anything in SQL Server. It was fairly easy to get call stacks for the wait using TF 3656, which is generally not recommended in production. Here is one example:

sqldk.dll!XeSosPkg::wait_info::Publish+0x1a9
sqldk.dll!SOS_Task::PreWait+0x14b
sqldk.dll!WaitableBase::Wait+0x183
sqldk.dll!WorkDispatcher::DequeueTask+0x5de
sqldk.dll!SOS_Scheduler::ProcessTasks+0x234
sqldk.dll!SchedulerManager::WorkerEntryPoint+0x2a1
sqldk.dll!SystemThread::RunWorker+0x91
sqldk.dll!SystemThreadDispatcher::ProcessWorker+0x2f3
sqldk.dll!SchedulerManager::ThreadEntryPoint+0x1e5
KERNEL32.DLL!BaseThreadInitThunk+0x14
ntdll.dll!RtlUserThreadStart+0x21

That’s a pretty short stack. The wait begins immediately after a task is dequeued. This made me think that workers start the wait when they don’t have a task to run and complete the wait once they do have a task to run, but this is hardly proof, since I’m just guessing at what this call stack means.

Just Add More Extended Events


From the call stack it seems reasonable to conclude that tasks are somehow related to the wait type. There are a handful of debug channel task related events available in extended events: task_completed, task_enqueued, and task_started. Debug extended events can be a pain because they often have no documentation, but these seemed straightforward enough. The event_counter target revealed very obvious collusion between the events:

a35_collusion

The wait_info extended event fires once for when a wait starts and once for when it completes. Every time I looked I had exactly twice as many events for wait_info as I did for each task-related extended event. Below is an instructive example from the event file. Note that the duration for the wait_info event is measured in milliseconds but the duration for the task event is measured in microseconds.

a35_XE_file

For worker 2434668749152, a task completed at 21:12:17.9416483. A wait type of SOS_WORK_DISPATCHER immediately began. About five seconds later, a task was enqueued to this worker. The SOS_WORK_DISPATCHER wait immediately ends after the task was enqueued, with a reported wait duration of 4998 ms. The task starts at 21:12:22.9397094 and completes at 21:12:22.9397109. Once again, a wait type of SOS_WORK_DISPATCHER immediately starts at 21:12:22.9397127. This time another task is very quickly enqueued at 21:12:22.9427744, so the wait ends with a duration of just 3 ms.

There are many similar patterns in the event file. I consider this to be pretty strong evidence that the SOS_WORK_DISPATCHER wait measures time that a worker sits idle without a task to run. It is common for systems to have many idle workers, so seeing a lot of wait time for SOS_WORK_DISPATCHER is normal and not cause for concern.

Robots are Taking Over


It is not clear to me why someone would be interested in this wait type. SQL Server automatically manages workers and creates and destroys them as needed. It’s true that as a query tuner I have some control over how many additional threads will be needed for a query, but if I’m investigating a performance or scalability problem I don’t care at all about the amount of time workers are sitting idle without a task to run. My wild guess is that this wait type was added to do some kind of tracking in Azure. Perhaps the robots needed some additional information to train a model.

Final Thoughts


In summary, the SOS_WORK_DISPATCHER wait type represents a sum of the total time for workers that don’t have tasks assigned to them. This appears to be a benign wait that can be filtered out of any queries on wait stats queries. When I first saw this wait type, I was hoping that it was some sort of representation of CPU idle time. I often work on workloads for which the goal is to push the server as hard as possible, so a simple measurement of total CPU idle time would be extremely useful for me. The number of workers on a system will change during a workload and there are lots of internal tasks, so sadly this wait type can’t be used for that type of analysis.

Thanks for reading!

Going Further


If this is the kind of SQL Server stuff you love learning about, you’ll love my training. I’m offering a 75% discount to my blog readers if you click from here. I’m also available for consulting if you just don’t have time for that and need to solve performance problems quickly.

What To Do When SQL Server Wait Stats Don’t Help

Some SQL Server workloads are slow even though there aren’t any hints in the wait stats that suggest ways to make them go faster. This blog post works through a columnstore example of such a workload.

The Test Setup


The test server has 96 physical cores. The test workload has many concurrent writers to the same columnstore target table. The source data is a simple staging table with ten columns. Each column contains sequential integers from 1 to 10485760. Here is T-SQL to create and populate the tables:

DROP TABLE IF EXISTS dbo.RS_SOURCE_10_COLUMN_SIMPLE;

CREATE TABLE dbo.RS_SOURCE_10_COLUMN_SIMPLE (
    ID1 BIGINT,
    ID2 BIGINT,
    ID3 BIGINT,
    ID4 BIGINT,
    ID5 BIGINT,
    ID6 BIGINT,
    ID7 BIGINT,
    ID8 BIGINT,
    ID9 BIGINT,
    ID10 BIGINT
);

INSERT INTO dbo.RS_SOURCE_10_COLUMN_SIMPLE
	WITH (TABLOCK)
SELECT q.ID, q.ID, q.ID, q.ID, q.ID
, q.ID, q.ID, q.ID, q.ID, q.ID
FROM
(
       SELECT TOP (10485760) ROW_NUMBER()
             OVER (ORDER BY (SELECT NULL)) ID
       FROM master..spt_values t1
       CROSS JOIN master..spt_values t2
       CROSS JOIN master..spt_values t3
) q
OPTION (MAXDOP 1);

DROP TABLE IF EXISTS dbo.CCI_TARGET_10_COLUMN;

CREATE TABLE dbo.CCI_TARGET_10_COLUMN (
    ID1 BIGINT,
    ID2 BIGINT,
    ID3 BIGINT,
    ID4 BIGINT,
    ID5 BIGINT,
    ID6 BIGINT,
    ID7 BIGINT,
    ID8 BIGINT,
    ID9 BIGINT,
    ID10 BIGINT,
    INDEX CCI0 CLUSTERED COLUMNSTORE
);

Concurrency is controlled by changing the number of stored procedures kicked off by a SQLCMD batch file. Each stored procedure does a single MAXDOP 1 insert from the staging table into the columnstore table. This test is different from the previous columnstore insert test documented here in that all of the sessions write to the same table and the source data gets significantly worse compression. In addition, each stored procedure only does a single insert, so the total overall work done increases as the number of concurrent sessions increases. If I run a single insert like the following:

INSERT INTO dbo.CCI_TARGET_10_COLUMN
SELECT *
FROM dbo.RS_SOURCE_10_COLUMN_SIMPLE
OPTION (MAXDOP 1);

That takes about 25 seconds to complete on the test server. It would be ideal if the average run time of the stored procedure stays at around 25 seconds as concurrency increases.

Test Results


We are not in an ideal world. The average run time of each stored procedure execution quickly increases with the number of concurrent sessions:

a34_scale_table

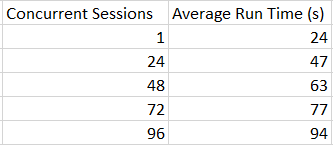
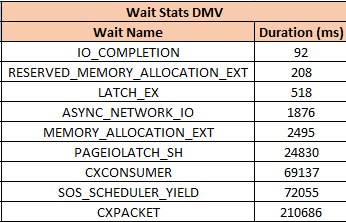
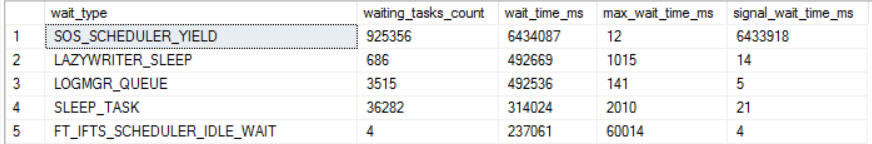
It may be slightly unreasonable to expect 96 concurrent sessions to scale perfectly well and to end up with an average run time of 24 seconds. With that said, the observed overhead is almost 4X at that scale. Let’s start by looking at wait stats:

a34_waits_for_LPIM_96

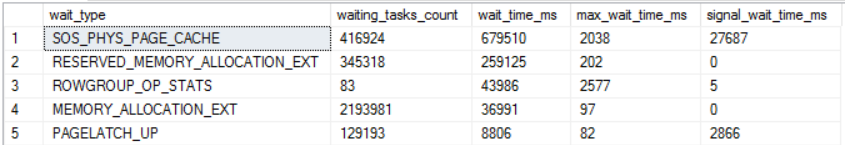
Most of the entries are related to memory. SOS_PHYS_PAGE_CACHE shows up because LPIM is enabled. This might be a helpful clue, but the waits only add up to about 10 seconds of waits per second. On a server with 96 cores that alone cannot explain a 4X degradation in scalability.

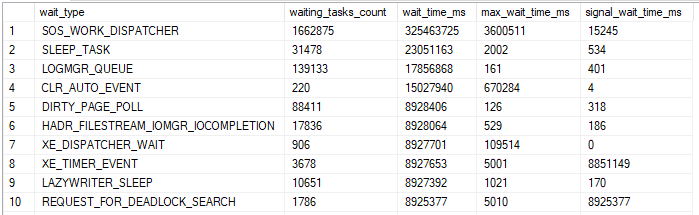
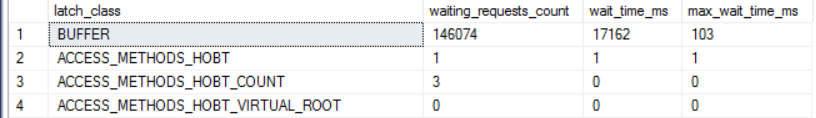
There is nothing helpful in latches:

a34_latches_for_LPIM_96

A number of spinlock collisions occurred during the workload:

a34_spins_for_LPIM_96

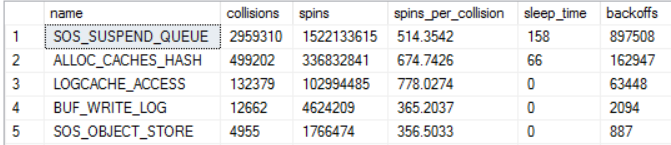
This is entirely a judgment call on my part, but based on my experience on this server and with similar workloads I don’t find those spinlock numbers to be at all remarkable. With that said, one avenue of investigation would be to dig into those spinlocks more.

From my point of view, the most important clue is that the server experiences high CPU throughout the workload according to SQL Server (using sys.dm_resource_governor_resource_pools), resource monitor, and perfmon. Perfmon also reports high privileged time:

a34_perfmon

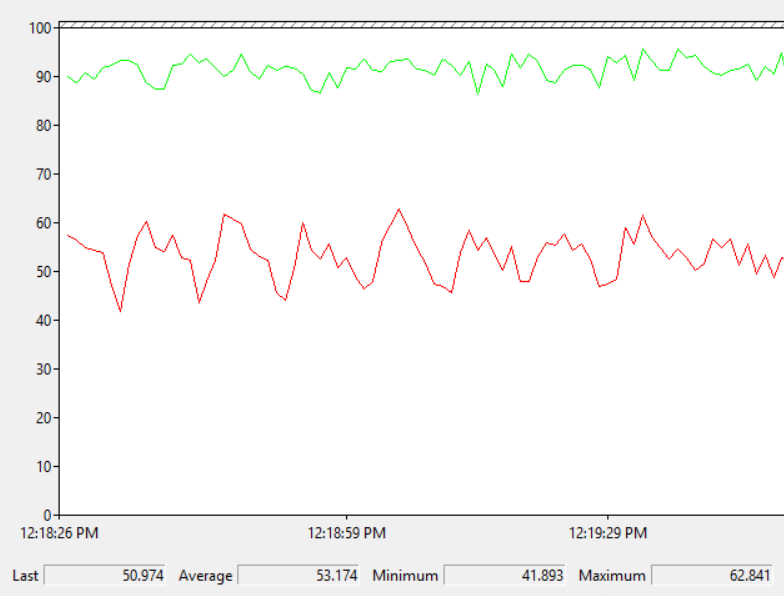
SQL Server appears to be doing something which requires significantly more CPU at higher concurrency. Therefore, it makes perfect sense that the wait stats and latch stats alone aren’t very helpful. It’s reasonable to expect most wait types and latch classes to result in low CPU during their waits as opposed to high CPU.

ETW Tracing


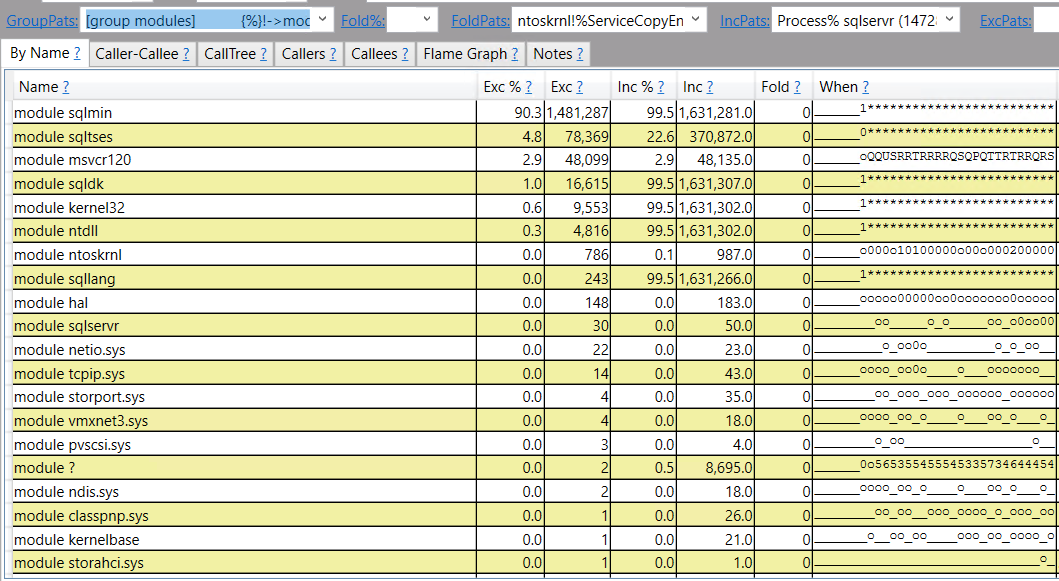
ETW tracing can be used to diagnose CPU issues on servers. I’m still pretty new at it, but I use PerfView. In particular, what I really want to see is sampled call stacks to get an idea as to where CPU is being spent. I took a ten second sample during the 96 concurrent session workload and grouped by module name:

a34_perfview_LPIM_modules

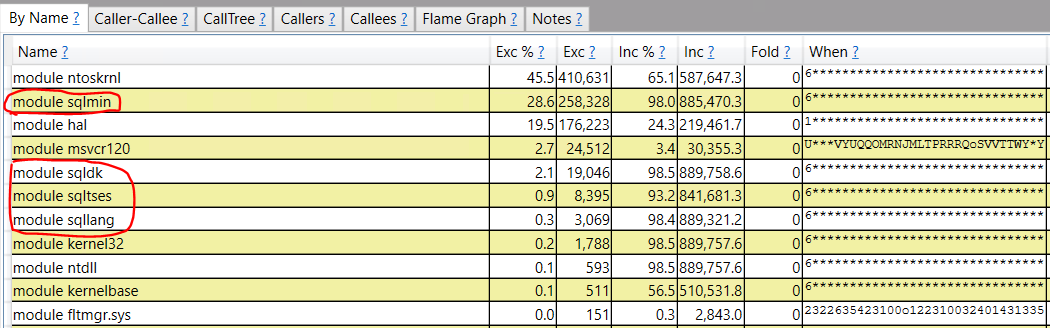
The circled modules are typically what I see in SQL Server call stacks. SQL Server is responsible for the majority of CPU work on the server, but the majority of the work is done in the ntoskrnl and hal modules. I have it on good authority that CPU spent in that context will be tracked as privileged time in perfmon, so this roughly lines up with the perfmon graph previously shown.

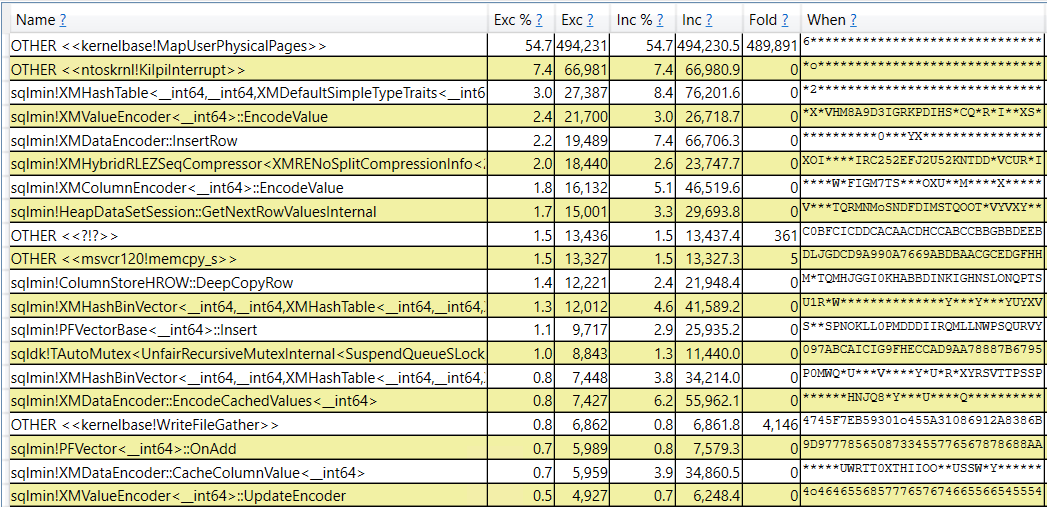
A different view of the data reveals that most of the work is done as part of kernalbase!MapuserPhysicalPages:

a34_perfview_LPIM_just_my_app

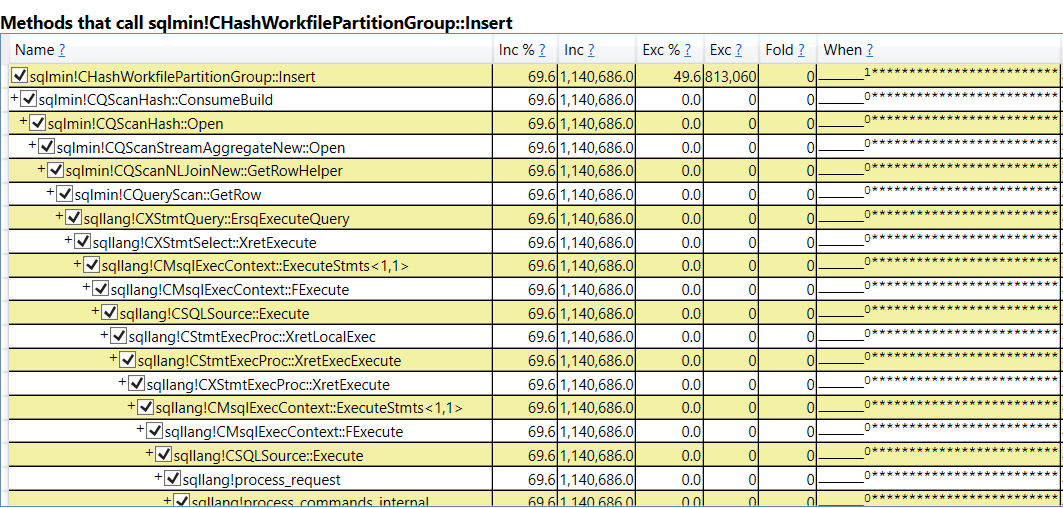
In addition, we can see methods that call kernalbase!MapuserPhysicalPages:

a34_perfview_LPIM_methods_call_mapPhysicalPages

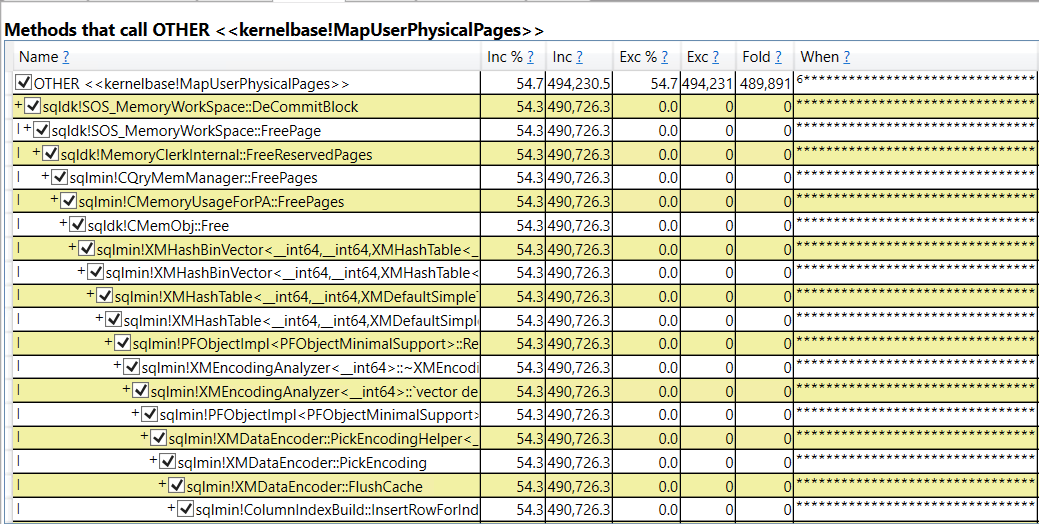
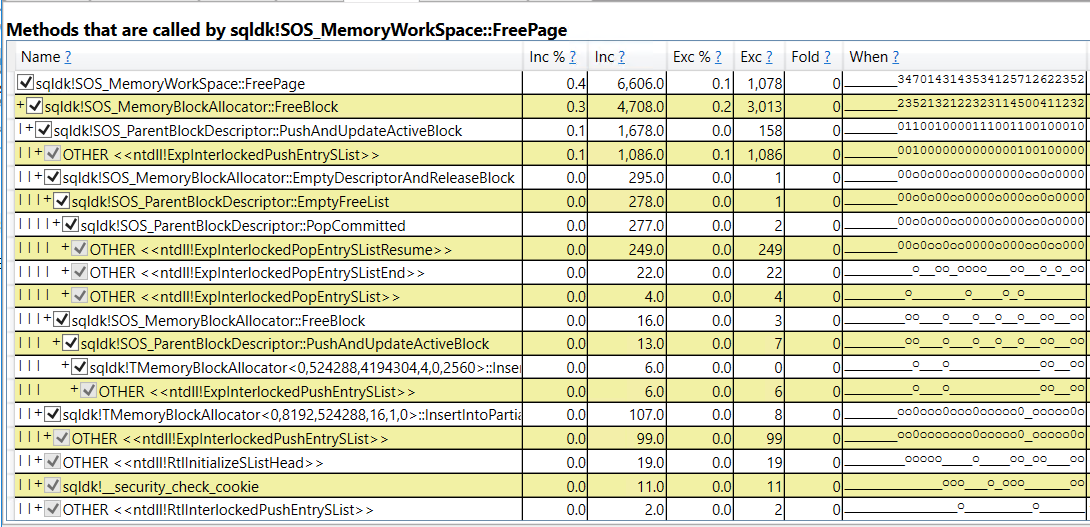
Presenting the data in a different way, we can see what was called by sqldk!SOS_MemoryWorkSpace::FreePage:

a34_perfview_LPIM_callee_free_Page

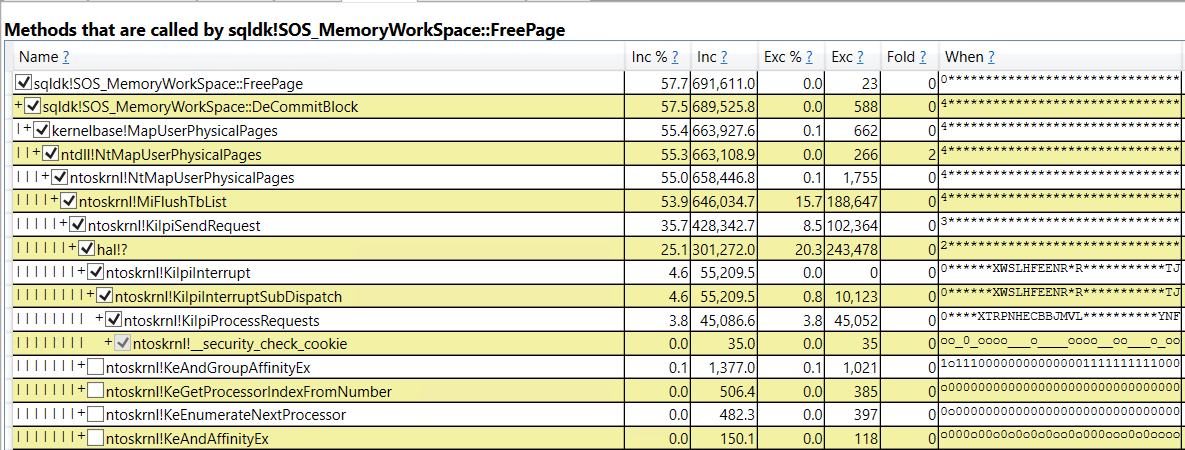
It appears that most of the CPU during the workload is spent returning memory from SQL Server to the OS. Backing that up, the memory commit for SQL Server was observed to decrease during the workload through resource monitor, even though there wasn’t any pressure from the OS and the total commit size was only at about 50% of max server memory.

For this workload, we are lucky in that important call stack names can be tied back to something in SQL Server. For example, sqldk!SOS_MemoryWorkSpace::FreePage would appear to be associated with freeing pages and that can be tracked from within SQL Server using extended events.

Extending The Investigation


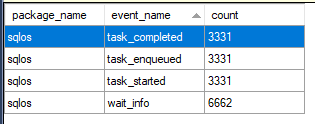
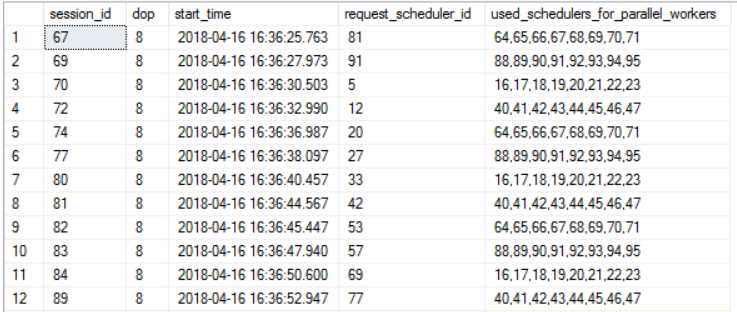
The page_allocated and page_freed debug extended events are helpful in understanding how memory is allocated and freed during a query’s execution. First I started with a histogram target on memory_clerk_name for the page_freed event page_freed filtered to a single session. Here’s what that looks like:

a34_histogram

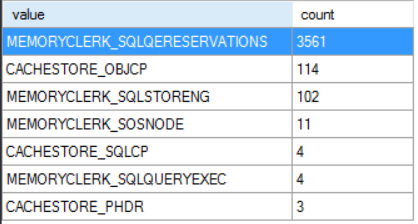
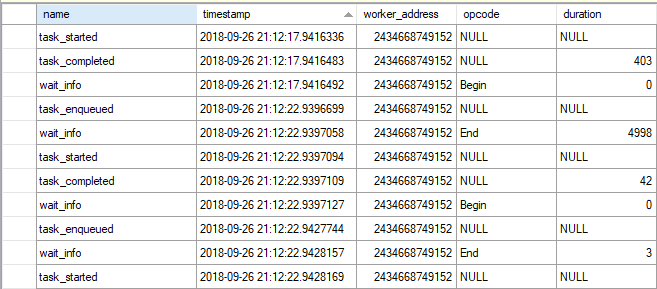
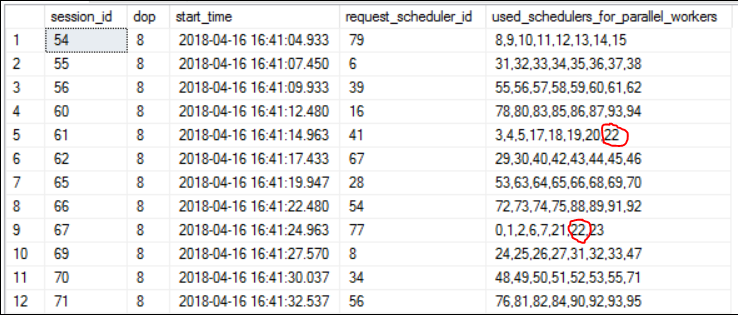
Nearly all of the free page events are for the MEMORYCLERK_SQLQERESERVATIONS clerk. I believe this clerk is responsible for granted query memory so this makes sense. Next we can turn on causality tracking and include the page_allocated event as well. Here’s a screenshot of some of the data for a simple CCI insert that processes three rowgroups in total:

a34_XE_picture

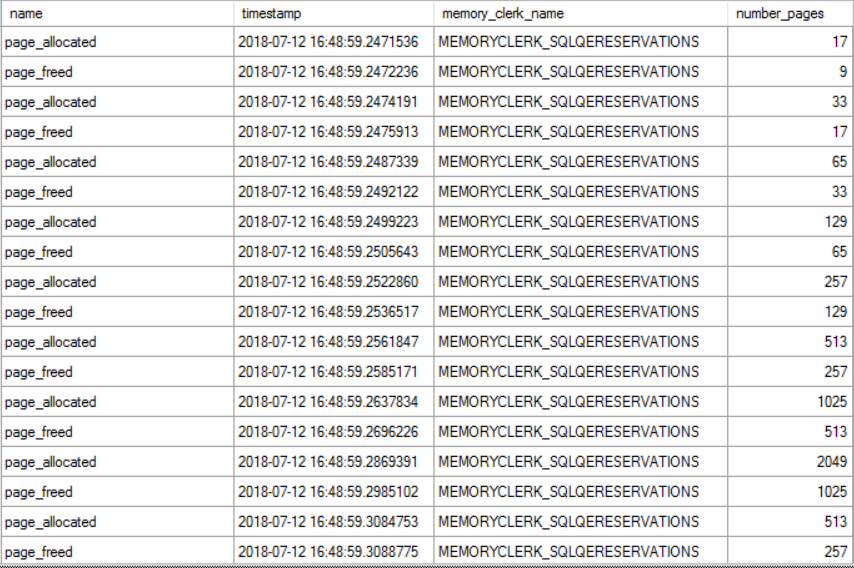
There are many different patterns in the data. Sometimes there is a series of free events and sometimes there is a series of allocation events. They can also alternate as shown in the picture above. The number of pages freed or allocated is usually one plus a power of two. I saved the data to a table and calculated a running total of current memory allocations for the query. The running total increased whenever pages were allocated and decreased whenever pages were freed. I’m really phoning it in with this graph, but here are the results:

a34_running_total_graph

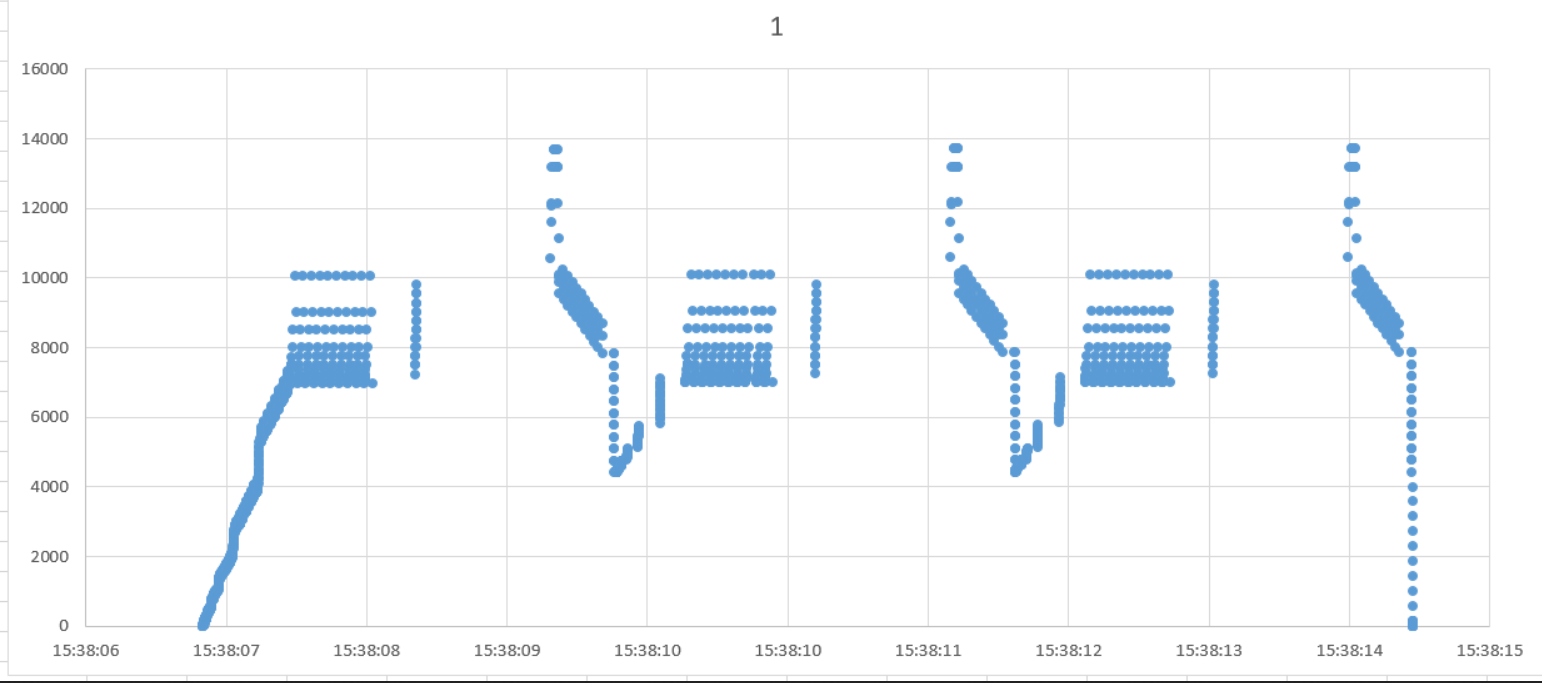
The x-axis is time and the y-axis is total pages currently allocated to the query. This query compresses three rowgroups in total. That’s why the pattern repeats three times. Other than that, the only thing I was able to tie back to the compression algorithm was that pages are rapidly freed as segments are finished:

a34_segment_deallocations

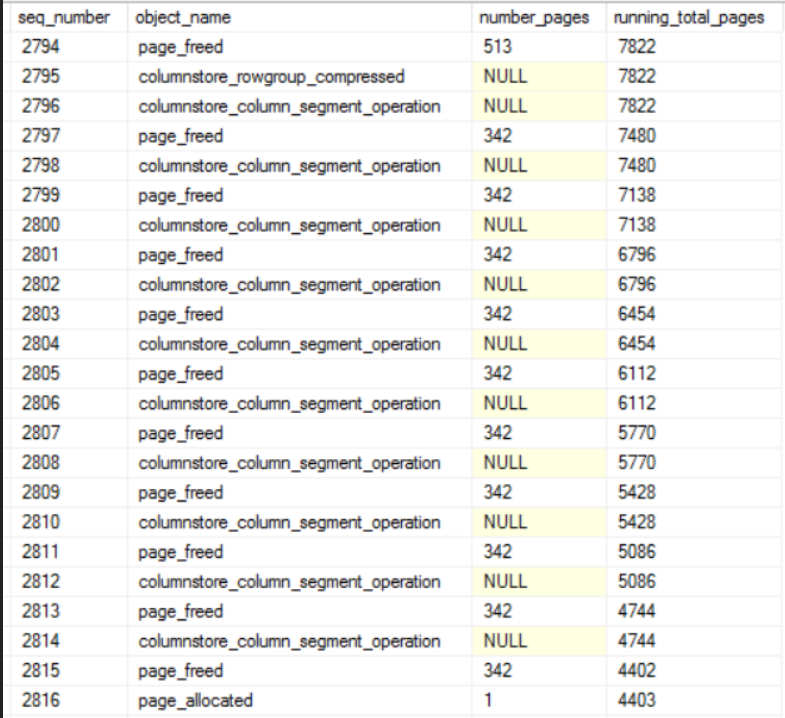
In summary, page allocations and page free events rapidly occur, sometimes in an alternating pattern. SQL Server will often free a number of pages just to immediately request allocations for a similar number of pages. If all of the free page events result in returned memory to the OS then the reason for the scalability bottleneck becomes clear. When running the full workaround with 96 concurrent sessions, a total of 341965 page freed operations were performed. Those events freed about 71.3 million pages in total. That amounts to about 584 GB of memory returned to the OS in total, based on the previous assumptions.

It seemed bizarre to me for SQL Server to return so much memory to the OS during columnstore compression even though it would very likely immediately need more memory for compression. A colleague suggested that this could be a deliberate design decision by Microsoft to reduce the likelihood of out-of-memory errors when allocating memory above the max server memory setting:

“Starting with SQL Server 2012 (11.x), SQL Server might allocate more memory than the value specified in the max server memory setting. This behavior may occur when the Total Server Memory (KB) value has already reached the Target Server Memory (KB) setting (as specified by max server memory). If there is insufficient contiguous free memory to meet the demand of multi-page memory requests (more than 8 KB) because of memory fragmentation, SQL Server can perform over-commitment instead of rejecting the memory request.

This behavior is typically observed during the following operations:

Large Columnstore index queries.
Columnstore index (re)builds, which use large volumes of memory to perform Hash and Sort operations.”

What is Normal?


All of the above observations around memory allocations and freed memory are interesting but some additional context is needed. I suspect that it doesn’t, but it’s possible that a traditional row mode query would show the same pattern of allocated and freed pages. To investigate that, I created a row mode query with a memory consuming operator that processes a result set of rows, releases the rows, and continues to do so in a loop. The query plan looks like this:

a34_query_plan

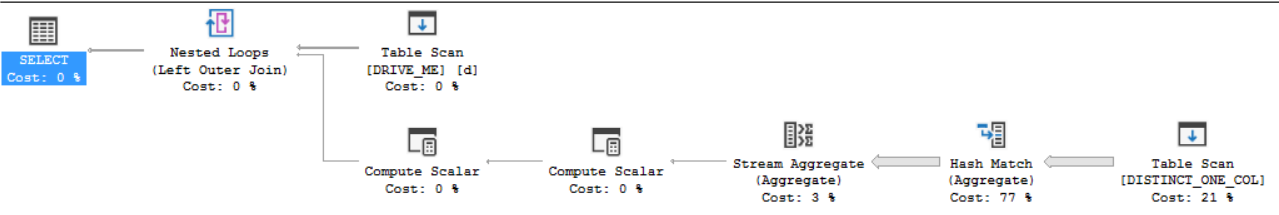
Note the Hash Match (Aggregate) operator on the inner side of the nested loop. For each row in the DRIVE_ME table, SQL Server will send nearly all of the rows from DISTINCT_ONE_COL into the hash match operator. The reason that I went for this type of query is that it felt like the most similar pattern to columnstore compression in that compression processes up to 1048576 rows per thread in what’s effectively a loop. For those following along at home here is T-SQL to generate that query plan:

drop table if exists DRIVE_ME;

create table DRIVE_ME (ID INT);

INSERT INTO DRIVE_ME VALUES
(1), (2), (3), (4), (5), (6), (7),
(8), (9), (10), (11), (12), (13), (14);

drop table if exists DISTINCT_ONE_COL;

create table DISTINCT_ONE_COL (ID INT);

INSERT INTO DISTINCT_ONE_COL WITH (TABLOCK)
SELECT TOP (10000000) ROW_NUMBER()
      OVER (ORDER BY (SELECT NULL)) ID
FROM master..spt_values t1
CROSS JOIN master..spt_values t2
CROSS JOIN master..spt_values t3
OPTION (MAXDOP 1)

GO

CREATE OR ALTER PROCEDURE
dbo.REPEATED_ROW_MODE_ALLOC AS
BEGIN
SET NOCOUNT ON;
SELECT ca.cnt
FROM DRIVE_ME d
OUTER APPLY
(
	SELECT COUNT(DISTINCT ID)
	FROM DISTINCT_ONE_COL
	WHERE ID > d.ID
) ca (cnt)
OPTION (MIN_GRANT_PERCENT = 2.5)
END;

On the test server executing a single query took around 90 seconds. That single query execution frees around 760000 memory pages in total. Memory is allocated and freed in cycles. There isn’t a pattern where allocation and free events trade off between each other.

The workload does very well at scale. With 96 concurrent sessions the average stored procedure execution remains at around 90 seconds. We’re freeing the same amount of pages in total as the columnstore insert workload without seeing a drop in scalability. We can again use PerfView to analyze the workload by modules:

a34_perfview_rowstore_modules

This time most of the CPU is spent on SQL Server managed code. Drilling down, the operation that uses the most CPU appears to involving inserting rows into a hash table that’s in a query’s memory grant:

a34_perfview_rowstore_biggest_cpu

There isn’t necessarily anything wrong with this. After all, something needs to use the most CPU during the workload and we do achieve very good scalability. To me, the most important part is how call stacks are different when looking at everything called by sqldk!SOS_MemoryWorkSpace::FreePage:

a34_perfview_rowstore_callee_free_Page

Within SQLOS we call “FreeBlock” instead of “DecommitBlock”. The windows OS calls are significantly different compared to columnstore compression and I wasn’t able to observe the memory commit for SQL Server changing during the workload. I can’t say for sure, but it looks like when memory is freed for memory-consuming row mode operators it is returned to SQL Server as opposed to returned to the OS. That makes a big difference in scalability.

I wanted to test with batch mode memory consuming operators, but couldn’t figure out a query pattern that resulted in the number of processed rows getting constantly reset for an operator that didn’t involve UDFs. I will say that I observed memory getting returned to the OS during batch mode queries, but I did not immediately see the performance bottleneck around freeing the pages. It’s possible that with more work a demo could be created to show this bottleneck. It’s also possible that the different pattern of freed pages means that it won’t realistically happen. In my limited testing I did not see batch mode operators free pages before they had done all of their work, which is significantly different from the columnstore compression pattern of allocating and freeing pages.

Changing the Memory Model


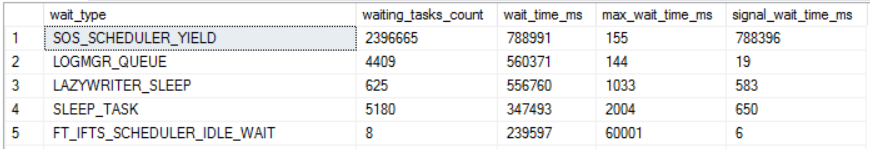
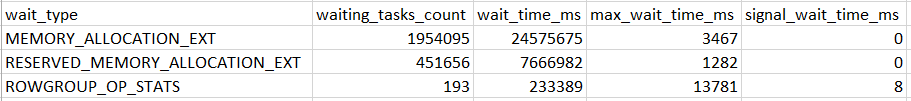
We know that the problem has to do with memory deallocation, so testing with the conventional and large pages memory models may be fruitful. The workload significantly degraded without lock pages in memory. The average insert time was about 368 seconds with 96 concurrent sessions. 91% of the workload time can be tied back to memory related waits:

a34_convential_waits

At first glance, this workload has a problem with memory allocation as opposed to freeing memory pages. It would be possible to use techniques within SQL Server to further drill into the scalability bottleneck, but I will not do that analysis here.

Enabling large pages for the buffer pool via TF 834 does not resolve this bottleneck. The average insert completion time is nearly identical to the LPIM test and I did not observe any significant differences in PerfView results. TF 834 is helpful with some columnstore workloads but it does not help with this one. Keep in mind that TF 834 is not supported with columnstore according to Microsoft.

Waiting for a Wait Type


I’m not a cloud guy, but I wonder if it would even be possible to troubleshoot an issue like this if the investigator doesn’t have access to the underlying OS or the ability to install ETW tracing tools. It would be helpful if Microsoft was able to capture and present this bottleneck in SQL Server. For example, a new wait type could be defined named something like “RESERVED_MEMORY_FREE_EXT” with the timer starting after sqldk!SOS_MemoryWorkSpace::DeCommitBlock and ending after the OS owned code finishes its work. A defined wait type would make it much more obvious that there’s a problem and allow affected end users to easily search for guidance or workarounds for the issue. This would be a cpu busy external wait. I don’t know if defining a wait like this is in line with Microsoft’s general philosophy for designing wait types, but it’s just an idea.

If the bottleneck in the OS truly can’t be solved then perhaps it could be protected by a spinlock within SQL Server. That spinlock might not accomplish anything other than letting someone who only has access to SQL Server know that there’s a problem. Again I don’t know if that’s an appropriate use of a spinlock. I’m out of my depth here when it comes to suggestions like these, but I do think there is a need to classify this bottleneck. Of course, Microsoft making code changes in SQL Server or even in Windows Server to resolve the bottleneck would be preferred.

Final Thoughts


This blog post covered the investigation of a slow workload for which wait stats were not helpful in diagnosing the problem. In summary:

  1. ETW tracing and extended events revealed a bottleneck related to returning memory to the OS from SQL Server. This bottleneck can occur when loading data into columnstore tables at reasonably high concurrency.
  2. Lock pages in memory can have a dramatic effect on workload performance even when paging to disk is not occurring. This must be a gross oversimplification, but with LPIM SQL Server uses different OS calls to manage memory and the difference in those calls can lead to scalability issues with and without LPIM. For example, highly concurrent workloads that call HASHBYTES have been observed to get better throughput with LPIM.
  3. For columnstore workloads on SQL Server 2017, I recommend the use of LPIM unless there is a very good reason not to use it. I have seen LPIM cause performance issues on SQL Server 2016 but have not fully sourced those issues. LPIM still may be the right starting point on SQL Server 2016.
  4. The investigation did not have a happy ending in that it isn’t clear how to resolve the bottleneck except by lowering concurrency. However, the work done here does provide a helpful foundation for reaching out to a VM or Windows admin or for opening a support ticket with Microsoft.

Thanks for reading!

Going Further


If this is the kind of SQL Server stuff you love learning about, you’ll love my training. I’m offering a 75% discount to my blog readers if you click from here. I’m also available for consulting if you just don’t have time for that and need to solve performance problems quickly.

Automatic Soft-NUMA and SOS_SCHEDULER_YIELD Waits In SQL Server

Auto soft-NUMA can lead to increased SOS_SCHEDULER_YIELD waits on large systems with limited concurrency of large parallel queries. This blog post contains a reproduction of the issue and a brief analysis. I hope any readers from Microsoft appreciate my restraint in not making an “It Just Runs Slower” joke.

What is Auto Soft-NUMA?


Auto soft-NUMA was released in SQL Server 2016 and it is automatically turned on. However, it only has an effect if SQL Server is able to detect that a socket has 9 or more cores. The documentation isn’t very precise in some places and is outright misleading in others, but the Microsoft docs page is a good starting point for readers not familiar with it. For a very quick summary, schedulers in a memory node are split into soft-NUMA groups depending on the total number of schedulers and whether or not SQL Server can detect hyperthreading.

Microsoft expects auto soft-NUMA to improve scalability and performance for most workloads. They don’t really explain this idea in detail, but they do talk about how certain internal structures are partitioned by soft-NUMA node and that partitioning can be helpful for large systems.

This might not be what they mean, but there is one LOG WRITER system process per soft-NUMA node on SQL Server 2016 up to a maximum of 4. All of the log writers aren’t spread over multiple NUMA nodes though. To give an example, a single socket 32 core server will have one log writer process without auto soft-NUMA. With auto soft-NUMA there will be four soft-NUMA nodes, and as a consequence, four log writer processes on CPUs 1-4. That might be beneficial for some workloads.

Another observable behavior change caused by soft-NUMA nodes is differences in scheduling. The effect on scheduler assignment for MAXDOP 1 queries is well-known, but there are more subtle issues that can arise when running parallel queries.

The Test Server


The test server was a VM with 96 cores on four physical NUMA nodes. The VM was the only guest on the physical host and the virtual layout matched the physical layout. Within SQL Server, there are 96 schedulers and 4 memory nodes. Each memory node is split into 3 soft-NUMA nodes of 8 schedulers because SQL Server can’t tell if hyperthreading is enabled and 8 divides evenly into 24. Here’s the output of sys.dm_os_nodes with auto soft-NUMA enabled:

a30_auto_soft_numa_dmv

Server MAXDOP is set to 8. In theory, this should be the ideal setup. Microsoft says that they find eight to be the magic number when it comes to scalabilty of parallel processes. If auto soft-NUMA is disabled then there are only four NUMA nodes with one for each memory node. Here’s the output of sys.dm_os_nodes with auto soft-NUMA disabled:

a30_no_auto_soft_numa_dmv

The Test Code


For the test code, I wanted an easy way to alternate sets of parallel queries that finish very quickly with parallel queries that take a long time to finish. I ended up creating a simple stored procedure that only uses the spt_values table and kicks off a user-specified number of parallel queries that finish nearly instanteously followed by a query that cross joins millions of rows together. The final query in the procedure won’t finish in a reasonable amount of time. it is designed to be cancelled. The idea here is to give the observer as much time as needed to poke around various DMVs to make notes about how threads were scheduled.

CREATE OR ALTER PROCEDURE
[dbo].[RUN_SET_OF_QUERIES] (@num_cheap_queries INT) AS
BEGIN
	SET NOCOUNT ON;

	DECLARE @dummy INT,
	@queries_run_so_far INT = 0,
	@filter INT = 0;

	WHILE @queries_run_so_far
		BETWEEN 0 AND @num_cheap_queries - 1
	BEGIN
		SELECT @dummy = MAX(t1.high + t2.high)
		FROM master..spt_values t1
		CROSS JOIN master..spt_values t2
		WHERE @filter = 1
		OPTION (MAXDOP 8);

		SET @queries_run_so_far = @queries_run_so_far + 1;
	END;

	SELECT @dummy =
	MAX(t1.high + t2.high + t3.high + t4.high)
	FROM master..spt_values t1
	CROSS JOIN master..spt_values t2
	CROSS JOIN master..spt_values t3
	CROSS JOIN master..spt_values t4
	OPTION (MAXDOP 8);
END;

To that end, I chose to execute the stored procedure through sqlcmd. The expensive queries don’t modify data so it’s very fast to cancel all of the in-progress queries by closing the sqlcmd window. Readers following along with their 96 core servers at home should feel free to use whatever methodology they wish to kick off the stored procedures. I found it important to be able to kick off the stored procedure with a user-defined time delay between executions and to not have to wait on the completion of the stored procedure before sending more queries. Below is example syntax for a batch file which kicks off four stored procedure calls with a delay of about 2.5 seconds between each call. Each stored procedure executes two fast parallel queries before executing the very expensive one.

START /B sqlcmd -d {{db_name}} -S {{server_name}} -Q "EXEC [dbo].[RUN_SET_OF_QUERIES] @num_cheap_queries=2" > nul
ping 192.2.0.1 -n 1 -w 2500 > nul
START /B sqlcmd -d {{db_name}} -S {{server_name}} -Q "EXEC [dbo].[RUN_SET_OF_QUERIES] @num_cheap_queries=2" > nul
ping 192.2.0.1 -n 1 -w 2500 > nul
START /B sqlcmd -d {{db_name}} -S {{server_name}} -Q "EXEC [dbo].[RUN_SET_OF_QUERIES] @num_cheap_queries=2" > nul
ping 192.2.0.1 -n 1 -w 2500 > nul
START /B sqlcmd -d {{db_name}} -S {{server_name}} -Q "EXEC [dbo].[RUN_SET_OF_QUERIES] @num_cheap_queries=2" > nul
ping 192.2.0.1 -n 1 -w 2500 > nul


Finally, I needed a query to examine the distribution of parallel workers on the system. In general, you want your parallel workers to be spread out enough so that all schedulers are able to do some useful work. I used the following to get an idea of parallel worker distribution:

SELECT
  session_id
, dop
, start_time
, request_scheduler_id
, STRING_AGG
	(
	CASE WHEN exec_context_id = 0
	THEN NULL ELSE scheduler_id END
	, ','
	)
	WITHIN GROUP (ORDER BY scheduler_id)
	AS used_schedulers_for_parallel_workers
FROM
(
	SELECT
	  dot.session_id
	, dot.scheduler_id
	, dot.exec_context_id
	, req.scheduler_id AS request_scheduler_id
	, req.command
	, req.dop
	, req.start_time
	, dos.parent_node_id
	, dos.cpu_id
	, dos.is_idle
	, dos.load_factor
	, dos.active_workers_count
	FROM
	(
		SELECT DISTINCT
		  session_id
		, scheduler_id
		, exec_context_id
		FROM sys.dm_os_tasks
	) dot
	LEFT OUTER JOIN sys.dm_exec_requests req
		ON dot.session_id = req.session_id
			AND req.request_id = 0
	LEFT OUTER JOIN sys.dm_exec_sessions ses
		ON dot.session_id = ses.session_id
	LEFT OUTER JOIN sys.dm_os_schedulers dos
		ON dos.scheduler_id = dot.scheduler_id
	WHERE ses.is_user_process = 1
) t
GROUP BY
  session_id
, dop
, start_time
, request_scheduler_id
ORDER BY start_time
OPTION (MAXDOP 1);

This query is lazy in that it doesn’t handle plans with multiple parallel zones correctly. However, it works well enough for tests on simple parallel queries (such as the ones for the reproduction forthis post) or for properly written batch mode queries.

Testing with Auto Soft-NUMA


As a reminder, with auto soft-NUMA on my server I had 12 soft-NUMA nodes of 8 schedulers. I restarted SQL Server and ran a .bat file with the following commands repeated 12 times:

START /B sqlcmd -d {{db_name}} -S {{server_name}} -Q "EXEC [dbo].[RUN_SET_OF_QUERIES] @num_cheap_queries=2" > nul
ping 192.2.0.1 -n 1 -w 2500 > nul

In other words, I kicked off a total of 24 very fast parallel queries and 12 very long running parallel queries. Here is how my scheduling of parallel workers looked:

a30_auto_soft_numa_scheduling

That is a pretty bad outcome. I have 12 MAXDOP 8 queries with all parallel workers assigned to schedulers on just four NUMA nodes. Each CPU in those NUMA nodes has the equivalent of 300% work assigned to it. Execution context 0 doesn’t do much work for the test query, so I have 64 cpus with barely any work to do. It’s unlikely that server CPU will go much higher than 33%. Here are wait stats after running the workload for two minutes:

a30_more_sos_waits

We accumulated two hours of SOS_SCHEDULER_YIELD waits in just two minutes. Not what you want to see with a server that’s around 33% CPU utilization. What went wrong?

Mo’ Schedulers Mo’ Problems


Scheduling of parallel queries was changed in SQL Server 2012. Bob Dorr blogged about it here, and it’s the best source that I’m aware of. Even so, I’ve had a lot of trouble figuring out exactly what the words in that blog post mean. Readers of this blog may be able to relate. I’ve only ever observed the spread selection type in practice, so the most relevant part of the linked post is this one:

Spread: This is the most common decision made by SQL Server. The decision spreads the workers across multiple nodes as required. The design is similar to full except the starting position is based on the saved, next node, global enumerator.

Consider a server with soft-NUMA nodes of 8 schedulers with MAXDOP 8. The first parallel query will be sent to numa node 0. The number of active workers matches the number of schedulers exactly so each active worker is assigned to a different scheduler in the NUMA node. The second parallel query will be sent to NUMA node 1. The third parallel query will be sent to NUMA node 2, and so on. Execution of serial queries or creation of sessions does not matter. That advances a counter that’s separate from the “global enumerator” used for parallel query scheduler placement. As far as I can tell the scheduler assigned to execution context 0 does not affect the scheduling of the parallel worker threads, although it can certainly affect parallel query performance.

The scenario described above doesn’t sound so bad. It can work well if the parallel queries take roughly about the same amount of time to complete and query MAXDOP matches the number of schedulers per soft-NUMA node. Problems can emerge when at least one of those is not true. With the spread selection type it’s possible that the amount of work already assigned to schedulers has no effect on parallel query scheduler placement. Let that sink in. You could have 100 serial queries all assigned to schedulers in numa node 0 but SQL Server may still send a parallel query to that NUMA node. It depends on the position of the “global enumerator” as opposed to current work on the server.

That behavior is why the reproduction in this post works. With a total of 12 soft-NUMA nodes all I need to do is run queries in a fast-fast-slow pattern to cause the slow queries to be doubled and tripled up on schedulers. In some cases sending more parallel queries to a server can be a valid strategy if server CPU isn’t quite as high as you’d like. That might not work here though. Sending more queries will mostly just rack up additional SOS_SCHEDULER_YIELD waits.

It isn’t true that SQL Server never considers the amount of work on a scheduler when assigning parallel worker threads. NUMA nodes have limits on the number of parallel workers as can be seen in sys.dm_exec_query_parallel_workers. There appears to be scheduling choices which consider load factor or worker count when the set of parallel workers only fills part of a soft-NUMA node. Consider a pair of MAXDOP 12 queries running on the same server as described earlier. Suppose that the “global enumerator” starts at position 0. The first query will grab 8 schedulers from NUMA node 0 and 4 schedulers from NUMA node 1. SQL Server has some choice about which schedulers it grabs from NUMA node 1. However, there is no choice to be made for NUMA node 0 because it grabs all of them. The second parallel query grabs 4 schedulers from NUMA node 1 and 8 schedulers from NUMA node 2. Again, SQL server can make a choice about which schedulers it uses from NUMA node 1. That decision can factor in system load. Just like with serial queries, if queries are sent too quickly to the server then you might see unnecessary doubling up of schedulers in NUMA node 1.

I didn’t try to dig into the details fully, but hopefully the above gives you a high level understanding of what kind of problems you might see with parallel query scheduling on servers with more than one NUMA node.

Testing Without Auto Soft-NUMA


Armed with our new knowledge, let’s consider what might happen with the previous workload if auto soft-NUMA is disabled. Assume that the server was restarted and the global enumerator starts at position 0. Three MAXDOP 8 queries are able to fit into each NUMA node of 24 schedulers. The expensive query for the first execution of the stored procedure will be sent to schedulers on the first NUMA node. The expensive query for the second execution of the stored procedure will be sent to schedulers on the second NUMA node, the third will be sent to the third NUMA node, and the fourth will be sent to the fourth NUMA node. As we continue to execute more queries we’ll loop around but the key difference is that SQL Server is able to place the parallel worker threads however it wants on the 24 schedulers. It can look at things like load factor or the number of workers per scheduler. After all 12 stored procedures have started we can end up with scheduling like this:

a30_good_scheduling

Every scheduler has at least one thread for a parallel worker or an execution context 0 thread. Scheduler 22 is one of eight schedulers with more than one parallel worker assigned. Execution context 0 for these queries is expected to do very little work, so it could be argued that a better distribution would be to have exactly one parallel worker per scheduler. However, overall this is a pretty good distribution and we can push server CPU to 90%. After two minutes of execution we have significantly fewer time spent on SOS_SCHEDULER_YIELD waits compared to before:

a30_less_sos_waits

In this situation, we can see a significant improvement in server resource utilization by disabling auto soft-NUMA. For other workloads and query mixes the scheduling behavior offered with auto soft-NUMA may be a better fit. Key factors include the patttern of parallel queries, MAXDOP, and the number of schedulers per memory node.

Final Thoughts


We observed a bottleneck with SOS_SCHEDULER_YIELD waits for an ETL workload for which it was not easy to scale up the number of queries. This can happen if there are only so many partitions to process or if ETL queries require large memory grants, say, for compressing columnstore data. We were able to shave 30% off the overall workload time by using Resource Governor CPU affinity and doing our own scheduling. Less drastic workarounds include disabling auto soft-NUMA, changing MAXDOP, increasing CTFP, or reigning in some queries which don’t need to run in parallel. Thanks for reading!