Separating Long Running Queries From Modifications To Fix Blocking Problems In SQL Server

Let’s Say We Have A Bad Query


I know you don’t have bad queries. You’re smart people. But some people do!

Let’s also say that bad query is taking part in a modification.

UPDATE u2
SET u2.Reputation *= 2
FROM Users AS u
JOIN dbo.Users AS u2
ON CHARINDEX(u.DisplayName, u2.DisplayName) > 0
WHERE u2.Reputation >= 100000
AND u.Id <> u2.Id;

This query will run for so long that we’ll get sick of waiting for it. It’s really holding up writing this blog post.

Let’s try something a little different.

SELECT u.Id, u.DisplayName
INTO #Users
FROM dbo.Users AS u
WHERE u.Reputation >= 100000;

UPDATE u2
SET u2.Reputation *= 2
FROM #Users AS u
JOIN dbo.Users AS u2
ON CHARINDEX(u.DisplayName, u2.DisplayName) > 0
AND u.Id <> u2.Id;

This time, the query finishes in 43 seconds.

Plans and Events


The query plan looks like this:

SQL Server Query Plan
You’re not cool.

Extended events can tell us when locks were taken and released to perform the update.

SQL Server Extended Event Lock Escalation
Ducked out

An exclusive lock was held on the table for over 35 seconds, so all but ~7 seconds of the plan has locks on the table we’re updating.

In real life, that’d probably mean a lot of blocking.

Alt Rock


Another way to handle this is to remove the long-running query from the update, and take advantage of the Primary Key/Clustered Index on the table.

First, isolate the rows we care about:

SELECT u2.Id, u2.Reputation * 2 AS DoubleRep
INTO #Updater
FROM #Users AS u
JOIN dbo.Users AS u2
ON CHARINDEX(u.DisplayName, u2.DisplayName) > 0
AND u.Id <> u2.Id;

Then do the update:

UPDATE u2
SET u2.Reputation = u.DoubleRep
FROM #Updater AS u
JOIN dbo.Users AS u2
ON u.Id = u2.Id;

This query only runs a few hundred milliseconds, so the locks taken are shorter.

Keep in mind, though, that the first insert query is still horrible.

It runs for ~40ish seconds, but at least we don’t lock any objects that other queries might care about.

Thanks for reading!

Going Further


If this is the kind of SQL Server stuff you love learning about, you’ll love my training. I’m offering a 75% discount to my blog readers if you click from here. I’m also available for consulting if you just don’t have time for that and need to solve performance problems quickly.

How Bad Cardinality Estimates Can Make Blocking Worse In SQL Server

Stay Sober


I recently came across a bad locking problem. It was one of those things that happened “suddenly” and “for no reason”.

When I looked at the stored procedure, the code was something like this:

CREATE PROCEDURE dbo.bad_news(@PostTypeId INT)
AS	
BEGIN

DECLARE @PTID INT
SELECT @PTID = CASE WHEN @PostTypeId < 1
                         OR @PostTypeId > 8
				    THEN 4
			   END
UPDATE p
SET p.Score += 1
FROM dbo.Posts AS p
WHERE p.PostTypeId = @PTID;

END

I mean, it would look like that if we were using Stack Overflow.

We weren’t, but I’ll leave the rest to your imagination.

Outside The Proc


We have this index:

CREATE INDEX ix_spanky ON dbo.Posts(PostTypeId);

Let’s run this code, and look at what happens.

BEGIN TRAN
UPDATE p
SET p.Score += 1
FROM dbo.Posts AS p
WHERE p.PostTypeId = 3;
ROLLBACK

The locks look like this:

<Lock resource_type="KEY" index_name="PK_Posts__Id" request_mode="X" request_status="GRANT" request_count="28" />
<Lock resource_type="OBJECT" request_mode="IX" request_status="GRANT" request_count="1" />
<Lock resource_type="PAGE" page_type="*" index_name="PK_Posts__Id" request_mode="IX" request_status="GRANT" request_count="17" />

Our nonclustered index helps us find the rows we want to update. We don’t need to lock it because it doesn’t have the Score column in it.

We do need to lock the clustered index, but we’re able to take a small number (28) of Key locks.

This is the best outcome!

The worst outcome happens when we do this, which is what was happening in the stored procedure.

DECLARE @PostTypeId INT = 3;
BEGIN TRAN
UPDATE p
SET p.Score += 1
FROM dbo.Posts AS p
WHERE p.PostTypeId = @PostTypeId;
ROLLBACK

The locks look like this:

<Lock resource_type="OBJECT" request_mode="X" request_status="GRANT" request_count="1" />
<Lock resource_type="PAGE" page_type="*" index_name="PK_Posts__Id" request_mode="X" request_status="GRANT" request_count="17" />

We not only have exclusive locks on pages, but on the entire table now.

Overestimaters Anonymous


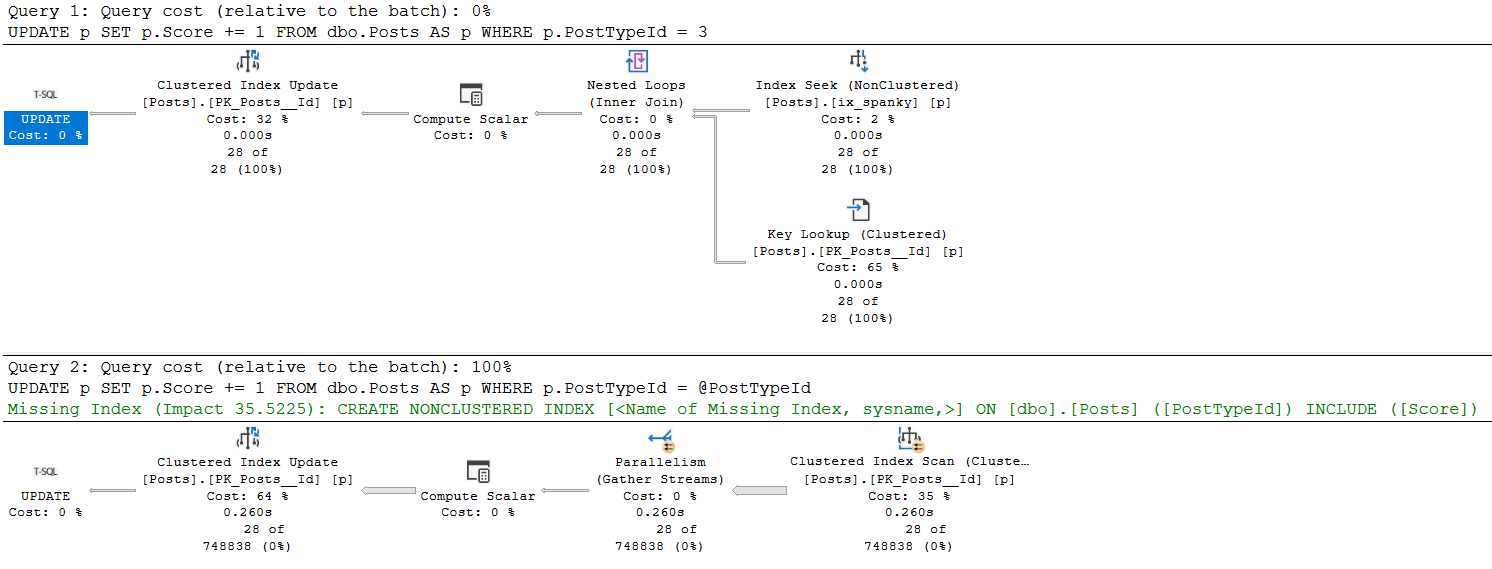
The execution plans for these two queries are much different.

SQL Server Query plan
umop

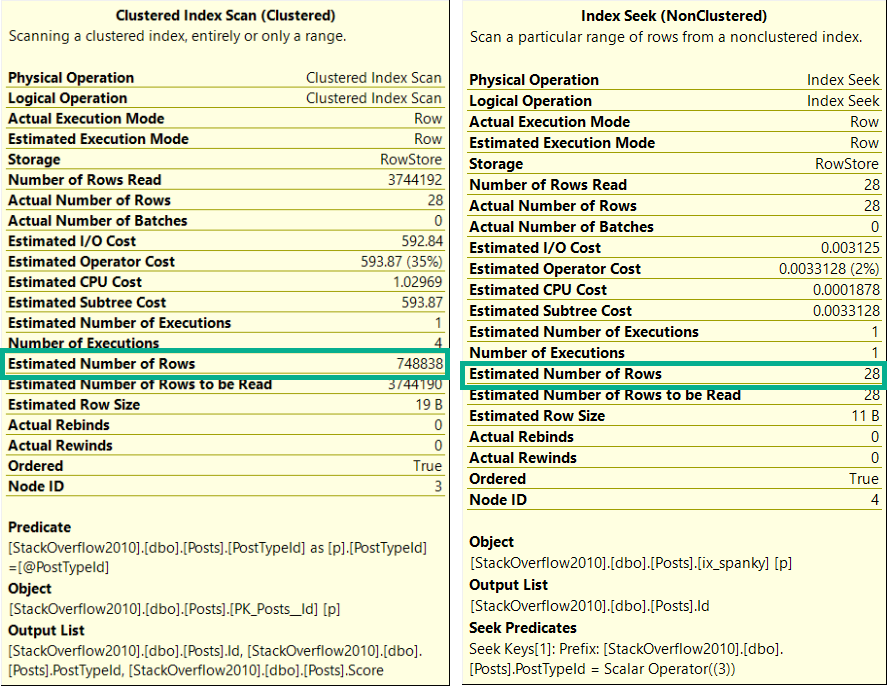
Likewise, the estimates are much different.

SQL Server Query Plan
upside

Oh So Loco


This is a fairly well-documented outcome of using a “declared variable”, or the optimize for unknown hint.

The optimizer makes a usually-generally-bad guess at the number of rows it’ll have to deal with.

In this case, the stored procedure had been modified to account for bad values passed in from the application.

The outcome was severe blocking because modification queries were taking far more intrusive locks than necessary.

So, you know, don’t do that.

Thanks for reading!

Going Further


If this is the kind of SQL Server stuff you love learning about, you’ll love my training. I’m offering a 75% discount to my blog readers if you click from here. I’m also available for consulting if you just don’t have time for that and need to solve performance problems quickly.

How Explicit Transactions Can Make Blocking Worse In SQL Server

But I Need To Roll That Back


It all sounds like a great idea.

You want your stored procedure to be a unit of work that you can roll back if something goes awry.

At first, it’s a few quick operations.

But over the years, the code has gotten more complicated, data has gotten larger, and now you’ve got terrible blocking problems.

Do The Worm


Assuming you can’t get rid of the transaction, you need to think of it like a movie about interstellar travel.

You know the kind where someone folds a piece of paper in half and pokes a hole through it?

Your job is to make all the stuff that happens inside as fast as possible.

This won’t fix the blocking, but it will shorten it.

Other Approaches


It might be possible for you to get rid of the transaction if you can store the before and after data somewhere.

This will get rid of the transaction, so locks won’t be held for the duration of it, but it makes you do more work in the procedure.

For every row or set of rows you change, you have to get the current values, put them somewhere, and hang onto them.

If you need to roll back your work, you need to go through and put them back. This can cause all sorts of problems, especially if someone else is working on the same data at the same time. Who should win?

You can partially solve this with sp_getapplock, but then you’re locking access to code until the whole thing is done, and…

You’re back to having locking problems.

Another thing you might be able to implement if you can change table structure is add an “in use” bit column, and skip over rows that are in use by someone else. This is common in queue tables, but can be extended to other types of work tables.

Thanks for reading!

Going Further


If this is the kind of SQL Server stuff you love learning about, you’ll love my training. I’m offering a 75% discount to my blog readers if you click from here. I’m also available for consulting if you just don’t have time for that and need to solve performance problems quickly.

Why Does Using The Rowlock Hint In SQL Server Create More Locks?

Taking A Hint


There are all sorts of fun hints you can staple onto your queries that will make them behave differently.

Probably the most common one I see is the NOLOCK hint.

Don’t worry, this post has nothing to do with that.

You’ve been finger wagged to death about it already.

Other Lock Hints


Sometimes you want to try to control lock granularity. A noble effort, indeed.

To do that, you can use hints like ROWLOCK or PAGLOCK. They’ll let you tell the weevils inside your server to prefer those types of locks.

The thing is, both are still subject to lock escalation (unless you turn that off, too).

If we take an update query like this, and use sp_WhoIsActive to look at the locks:

    BEGIN TRAN;
    WITH x AS 
    (
        SELECT TOP (5000)
                h.Score
        FROM dbo.HighQuestionScores AS h
        ORDER BY h.Id
    )
    UPDATE x
    SET  x.Score = 2147483647
    FROM x WITH (ROWLOCK);

    ROLLBACK
EXEC dbo.sp_WhoIsActive @get_locks = 1;

The lock info that comes back looks like this:

<Lock resource_type="KEY" index_name="PK__HighQues__3214EC072602ECCF" request_mode="X" request_status="GRANT" request_count="5000" />
<Lock resource_type="OBJECT" request_mode="IX" request_status="GRANT" request_count="1" />
<Lock resource_type="PAGE" page_type="*" index_name="PK__HighQues__3214EC072602ECCF" request_mode="IX" request_status="GRANT" request_count="28" />

The only lock type that has an X type is the Key lock. The page and object lock types are only intent exclusive. You can read more about intent locks here.

Now, if we change the 5000 to 7000, we get much different results from sp_WhoIsActive.

<Lock resource_type="OBJECT" request_mode="X" request_status="GRANT" request_count="1" />

We’ve hit lock escalation, and our precious ROWLOCK hint has been disregarded.

Funny, huh?

Thanks for reading!

Going Further


If this is the kind of SQL Server stuff you love learning about, you’ll love my training. I’m offering a 75% discount to my blog readers if you click from here. I’m also available for consulting if you just don’t have time for that and need to solve performance problems quickly.

Isolation Levels Are Inherited In SQL Server Queries

Client Yell


While working with a client who has a nasty blocking problem involving triggers, we were talking about using Snapshot Isolation to help fix the issue.

The thing is, there’s more than just stored procedures causing problems. Some of the issue is with triggers.

The prospect of having to modify a bunch of objects was a rightfully frightful one.

Funboy & Funboy & Funboy


In my database, I have Snapshot Isolation enabled.

I have a table with a trigger on it. The trigger doesn’t do anything except show me what my session’s isolation level is

CREATE TABLE dbo.t ( id INT NULL, dimdate DATETIME NULL );
CREATE TRIGGER dbo.dim_trigger
ON dbo.t
AFTER INSERT
AS
    BEGIN
        SET NOCOUNT ON;

        DECLARE @UserOptions TABLE ( SetOption VARCHAR(100), Value VARCHAR(100));
        DECLARE @IsolationLevel VARCHAR(100);

        INSERT @UserOptions
        EXEC ( 'DBCC USEROPTIONS WITH NO_INFOMSGS' );

        SELECT @IsolationLevel = 'Trigger:' + Value
        FROM   @UserOptions
        WHERE  SetOption = 'isolation level';

        PRINT @IsolationLevel;

    END;

I also have a stored procedure that checks the isolation level, and inserts into my table so that the trigger fires off.

CREATE OR ALTER PROCEDURE dbo.insert_t
AS
    BEGIN
        SET NOCOUNT ON;

        SET TRANSACTION ISOLATION LEVEL SNAPSHOT;

        DECLARE @UserOptions TABLE ( SetOption VARCHAR(100), Value VARCHAR(100));
        DECLARE @IsolationLevel VARCHAR(100);

        INSERT @UserOptions
        EXEC ( 'DBCC USEROPTIONS WITH NO_INFOMSGS' );

        SELECT @IsolationLevel = 'Procedure:' + Value
        FROM   @UserOptions
        WHERE  SetOption = 'isolation level';

        PRINT @IsolationLevel;

        INSERT dbo.t ( id, dimdate )
        VALUES ( 0, GETDATE());

    END;

On Notice


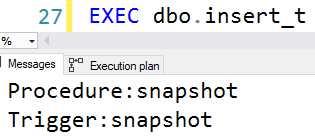
I’m only setting the isolation level in the stored procedure here.

When I run it, both will return the same isolation level no matter what you set it to.

Consistency

Thanks to Scott Ivey, whose code I borrowed for this.

And thank you for reading!

Going Further


If this is the kind of SQL Server stuff you love learning about, you’ll love my training. I’m offering a 75% discount to my blog readers if you click from here. I’m also available for consulting if you just don’t have time for that and need to solve performance problems quickly.

Why Plan Cache Scripts For SQL Server Can Be Misleading

A Long Way From Home


Most scripts (even ones I’ve worked on!) that look at the plan cache, have had the ability to sort it by different metrics: CPU, reads, writes, duration, etc.

A lot of people are very interested in long running queries — and I am too!

Heck, they’re how I make money. Blogging pays like crap.

But there’s a slight problem with only looking at query duration.

Fake Locks


Let’s say I have a stored procedure that looks like this:

CREATE OR ALTER PROCEDURE dbo.dblock (@id INT)
AS
BEGIN
    BEGIN TRAN
        UPDATE u
        SET u.Reputation = 2147483647 
        FROM dbo.Users AS u
        WHERE u.Id = @id
        
        WAITFOR DELAY '00:00:07.000'
    ROLLBACK
END;
GO

It’s there to simulate a long running modification query. You know, the kind of thing that’ll lead to blocking.

The kind of blocking that can make other queries feel like they take a long time.

Street Team


Here’s another stored procedure:

CREATE OR ALTER PROCEDURE dbo.the_lox (@id INT)
AS
BEGIN
    SELECT u.Id
    FROM dbo.Users AS u
    WHERE u.Id = @id
END;
GO

This will finish instantly. The Id column of the Users table is the Primary Key, as well as the Clustered Index.

There is literally nothing to tune here.

But it may look like it, sometimes…

D’evils


If I run these in different windows, the lox will be blocked by dblock.

--One Window
EXEC dbo.dblock @id = 22656;
GO 

--Other window
EXEC dbo.the_lox @id = 22656;
GO

If you were wondering why I had a 7 second wait, it’s because it generally takes me two seconds to flip windows and run a query.

When the situation resolves, this is what the metrics look like:

SELECT OBJECT_NAME(deps.object_id) AS stored_procedure_name,
       ( deps.last_worker_time / 1000. ) AS cpu_time,
       ( deps.last_elapsed_time / 1000. ) AS run_time
FROM   sys.dm_exec_procedure_stats AS deps
WHERE  deps.object_id = OBJECT_ID('dbo.the_lox');
GO
Everything You Got

The query barely used any CPU, but it ran for 5 seconds.

If you order your plan cache by elapsed time, you might see blameless queries up at the top.

There are a lot of reasons why they could end up there, and blocking is one of them.

Unfortunately, there’s currently nothing to tell you why. If you’re just getting started with query tuning, this could look befuddling.

Are Averages Better?


Sometimes it helps to look at what runs for a long time on average — you can figure that out by looking at the number of executions.

That can make better sense of things, but not if a query has only run once, or if it gets blocked a lot.

It may make more sense to factor in metrics that represent physical work, like CPU, reads, or writes, rather than just relying purely on wall clock time.

Thanks for reading!

Going Further


If this is the kind of SQL Server stuff you love learning about, you’ll love my training. I’m offering a 75% discount to my blog readers if you click from here. I’m also available for consulting if you just don’t have time for that and need to solve performance problems quickly.

SQL Server 2017 CU14 Change to CCI Insert Memory Time-out Behavior

A KB article was recently published that suggested that memory time-out behavior was changed for CCI inserts:

When you try to create a Columnstore Index on a table in Microsoft SQL Server 2016 or 2017, the request may fail after 25 seconds with memory time-out error 8645, depending on how many memory consuming queries are running concurrently and/or how much memory is available at the time of the request. The memory time-out error may occur even when you configure longer memory request time-out at an instance level or at a resource pool level.

I’ve never seen that error occur for serial inserts. Serial inserts time out after 25 seconds and execute with minimum required memory. They write directly to the delta store instead of attempting compression. So it looked like this change affects parallel inserts but the details weren’t at all clear to me.

Time out for time-outs


Why should we care about memory grant timeouts for CCI insert queries? Simply put, lots of bad things can happen when those queries can time out, both for serial and for parallel inserts. For serial insert queries, I’ve observed deadlocks, extremely poor performance along with long SLEEP_TASK waits, and extremely long rollbacks. For parallel insert queries, I’ve observed queries that run seemingly forever, poor performance of the SELECT part, and error 8645. You probably don’t want any of that occurring in production. It would be very helpful if it was possible to extend the 25 second time-out for queries that insert into columnstore tables.

Time out for time-outs


I’ve found it extremely useful to keep around a 2017 RTM environment with no CUs to figure when issues related to columnstore were introduced into the product. First we’ll take a look at the behavior on 2017 RTM to see error 8645 in action. I want a relatively simple parallel insert query that will run for longer than 25 seconds and will take a large memory grant. I decided on the following query:

INSERT INTO dbo.TARGET_CCI_1 WITH (TABLOCK)
SELECT ca.SLOW, ca.INFLATE_GRANT
FROM (VALUES (0), (1), (2), (3)) v(x)
CROSS APPLY (
	SELECT TOP (1048576) sc.SLOW, sc.INFLATE_GRANT
	FROM dbo.SLOW_TO_COMPRESS sc
	WHERE sc.FOR_SEEKING = v.x
) ca
OPTION (MAXDOP 2);

I get the properties that I’m after with a few undocumented tricks. The inflate grant column is a VARCHAR(8000) column. That data type significantly increases the memory grant for parallel inserts even with all NULLs. For the SLOW column, I’m loading integers evenly distributed between 0 and 7999. That data pattern can take longer than expected to compress. The worst case is with around 16000 distinct evenly distributed integers. If you’d like to understand why check out this answer by Paul White. Finally, the CROSS APPLY pattern means that I’ll get demand-based parallelism with each nested loop execution reading exactly enough rows from SLOW_TO_COMPRESS to fill up one rowgroup. It may be helpful to look at the query plan:

a38_query_plan

The query takes about 40 seconds to execute on my machine. If you’d like to follow along at home, set max server memory to 8000 MB and run the following code:

DROP TABLE IF EXISTS dbo.SLOW_TO_COMPRESS;

CREATE TABLE dbo.SLOW_TO_COMPRESS (
	FOR_SEEKING INT NULL,
	SLOW BIGINT NULL,
	INFLATE_GRANT VARCHAR(8000) NULL
);

CREATE CLUSTERED INDEX CI ON dbo.SLOW_TO_COMPRESS
(FOR_SEEKING);

INSERT INTO dbo.SLOW_TO_COMPRESS WITH (TABLOCK)
SELECT q.RN / 1048576, RN % 10000, NULL
FROM
(
	SELECT TOP (4 * 1048576) -1 + ROW_NUMBER()
		OVER (ORDER BY (SELECT NULL)) RN
	FROM master..spt_values t1
	CROSS JOIN master..spt_values t2
) q
OPTION (MAXDOP 1);

GO

DECLARE @table_id INT = 1,
@sql NVARCHAR(4000);

WHILE @table_id <= 6
BEGIN
	SET @sql = N'DROP TABLE IF EXISTS dbo.TARGET_CCI_'
	 + CAST(@table_id AS NVARCHAR(2))
	 + N'; CREATE TABLE dbo.TARGET_CCI_'
	 + CAST(@table_id AS NVARCHAR(2))
	 + N'(
		SLOW BIGINT NULL,
		INFLATE_GRANT VARCHAR(8000) NULL,
		INDEX CCI1 CLUSTERED COLUMNSTORE
	)';

	EXEC sp_executesql @sql;

	SET @table_id = @table_id + 1;
END;

GO

CREATE OR ALTER PROCEDURE dbo.INSERT_INTO_TARGET_CCI
(@table_id INT)
AS
BEGIN

DECLARE @sql NVARCHAR(4000) = N'INSERT INTO dbo.TARGET_CCI_'
+ CAST(@table_id AS NVARCHAR(2))
+ N' WITH (TABLOCK)
SELECT ca.SLOW, ca.INFLATE_GRANT
FROM (VALUES (0), (1), (2), (3)) v(x)
CROSS APPLY (
	SELECT TOP (1048576) sc.SLOW, sc.INFLATE_GRANT
	FROM SLOW_TO_COMPRESS sc
	WHERE sc.FOR_SEEKING = v.x
) ca
OPTION (MAXDOP 2)';

EXEC sp_executesql @sql;

END;

Error code 8645


Batch files that call sqlcmd are a convenient way to kick off lots of queries. For example:

START /B sqlcmd -d TEST -S .\SQL2017RTM -Q "EXEC dbo.INSERT_INTO_TARGET_CCI 1;" > nul
START /B sqlcmd -d TEST -S .\SQL2017RTM -Q "EXEC dbo.INSERT_INTO_TARGET_CCI 2;" > nul
START /B sqlcmd -d TEST -S .\SQL2017RTM -Q "EXEC dbo.INSERT_INTO_TARGET_CCI 3;" > nul
START /B sqlcmd -d TEST -S .\SQL2017RTM -Q "EXEC dbo.INSERT_INTO_TARGET_CCI 4;" > nul
START /B sqlcmd -d TEST -S .\SQL2017RTM -Q "EXEC dbo.INSERT_INTO_TARGET_CCI 5;" > nul

Note that I do not have Resource Governor enabled. If I kick off five queries at once using the batch file I don’t get an error. After 25 seconds two of the five queries are able to execute with the same memory grant as others:

a38_memory_grant_RTM

It does make me uncomfortable to see query memory grants exceed the target memory for the semaphore by so much, but at least it’s not over max server memory:

a38_semaphore_RTM

I ran the same test but kicked off a sixth query in SSMS. After 25 seconds I saw the following error for the sixth query:

Msg 8645, Level 17, State 1, Line 1
A timeout occurred while waiting for memory resources to execute the query in resource pool ‘default’ (2). Rerun the query.

I want my lawyer


On SQL Server 2017 CU14 I ran a variety of tests by changing the memory time-out settings at the Resource Governor query level or at the instance level. I tried different Resource Governor pools and even serial queries. I still saw a timeout of 25 seconds no matter what I did. I contacted the attorney that I keep on retainer to help me interpret SQL Server KB articles. Let’s review the relevant text again:

When you try to create a Columnstore Index on a table in Microsoft SQL Server 2016 or 2017, the request may fail after 25 seconds with memory time-out error 8645, depending on how many memory consuming queries are running concurrently and/or how much memory is available at the time of the request. The memory time-out error may occur even when you configure longer memory request time-out at an instance level or at a resource pool level.

He pointed out that the article doesn’t actually say that the time-out is now configurable. Just that it wasn’t configurable in the past. The symptom may strictly describe error 8645. So perhaps the adjustment was very narrow and has to do with avoiding that error only. Fair enough. I ran the same test that say error 8645 on RTM and the sixth query still hit error 8645.

Two of these things aren’t like the others


Let’s kick off five queries on CU14 and take another look at sys.dm_exec_query_memory_grants:

a38_memory_grant_new

That’s odd. The two queries that hit the 25 second timeout have lower values for max_used_memory_kb than the queries that didn’t time out, even though the memory grants are the same. Looking at sys.dm_db_column_store_row_group_physical_stats for one of the tables with the lower memory grant:

a38_rowgroup_stats

All rows were written to delta stores even though each thread got over 2 million rows. The query still takes its required memory grant but it doesn’t use most of the part reserved for columnstore compression. My best guess is that this is the change described in the KB article. A superficial glance suggests that the internal implementation is the same one used for writing to a delta store in serial:

a38_call_stacks

I think that I can understand the argument for making this change. However, I see intermittent intra-query parallel deadlocks when queries time out in this way:

Msg 1205, Level 13, State 78, Line 1
Transaction (Process ID 61) was deadlocked on lock | communication buffer resources with another process and has been chosen as the deadlock victim. Rerun the transaction.

I’ve also seen this error as well when going too far above target memory:

Msg 701, Level 17, State 123, Line 1
There is insufficient system memory in resource pool ‘default’ to run this query.

Personally, I’d like to see clearly defined behavior that focus on stability. When writing code that does parallel inserts into columnstore indexes it may be desirable to catch errors 8645, 1205, and 701 and to retry the insert after rolling back, perhaps at MAXDOP 1.

Final thoughts


Kb articles for SQL Server fixes can sometimes be misleading because they may focus on how the problem was described in a support ticket even if the scope of the fix or the solution have little to nothing to do with said description. After reading KB article 4480641 you could easily think that error code 8645 no longer occurs with parallel columnstore inserts or that it’s possible to override the 25 second memory timeout for columnstore inserts. Neither one of those is true. Parallel inserts into columnstore tables can still exceed target memory, but they write to multiple delta stores if they hit their 25 second timeout. Thanks for reading!

Last Week’s Almost Definitely Not Office Hours: April 19

ICYMI


Last week’s thrilling, stunning, flawless episode of whatever-you-wanna-call-it.

Was preempted by a flight! Sorry about that, we’ll be back next week.

The perils of being a one man band, I suppose.

Going Further


If this is the kind of SQL Server stuff you love learning about, you’ll love my training. I’m offering a 75% discount to my blog readers if you click from here. I’m also available for consulting if you just don’t have time for that and need to solve performance problems quickly.

Why SQL Server’s READPAST Hint Doesn’t Always Work

Oh, Bother


Sometimes, you only wanna work on one thing. Other times, you only wanna work on something if it’s not locked by something else.

Locking hints can be really handy in these situations, especially the READPAST hint. The documentation for it says that it allows you to skip over row level locks (that means you can’t skip over page or object level locks).

What it leaves out is that your READPAST query may also need to try to take row level shared locks.

Here’s an example!

Sterling Reputation


If I run this query, it’ll take out locks we don’t want (without an index on Reputation).

BEGIN TRAN
UPDATE u
SET u.Reputation += 1
FROM dbo.Users AS u
WHERE u.Reputation = 1047863;

ROLLBACK

If we use sp_WhoIsActive @get_locks = 1; we’ll get this back:

<Lock resource_type="OBJECT" request_mode="IX" request_status="GRANT" request_count="1" />
<Lock resource_type="PAGE" page_type="*" index_name="PK_Users_Id" request_mode="X" request_status="GRANT" request_count="1" />

We take a single exclusive page lock, which means our readpast query can’t skip it.

SELECT TOP (1)  
        u.Id,
        u.DisplayName, 
        u.Reputation
FROM dbo.Users AS u WITH(READPAST)
ORDER BY u.Reputation DESC;

We’ll get blocked. We’ll need to change our update query to do this:

BEGIN TRAN
UPDATE u
SET u.Reputation += 1
FROM dbo.Users AS u WITH(ROWLOCK)
WHERE u.Reputation = 1047863;

ROLLBACK

We’re now asking SQL Server to only lock rows if it can, for as long as it can.

Now our locks change to this:

<Lock resource_type="KEY" index_name="PK_Users_Id" request_mode="X" request_status="GRANT" request_count="1" />
<Lock resource_type="OBJECT" request_mode="IX" request_status="GRANT" request_count="1" />
<Lock resource_type="PAGE" page_type="*" index_name="PK_Users_Id" request_mode="IX" request_status="GRANT" request_count="1" />

Rather than exclusive page locks, we’re taking an exclusive key lock, and only intent exclusive locks elsewhere.

What’s amusing here is that our select query will… Still be blocked!

But why?

Going back to look at the locks it’s trying to take, we’ll see this:

<Lock resource_type="OBJECT" request_mode="IS" request_status="GRANT" request_count="5" />
<Lock resource_type="PAGE" page_type="*" index_name="PK_Users_Id" request_mode="S" request_status="GRANT" request_count="1" />
<Lock resource_type="PAGE" page_type="*" index_name="PK_Users_Id" request_mode="S" request_status="WAIT" request_count="1" />

So uh. Our read query is shooting itself in the foot by trying to lock pages rather than rows.

That’s… brave.

We need to change the locking hints slightly to avoid that.

SELECT TOP (1)  
        u.Id,
        u.DisplayName, 
        u.Reputation
FROM dbo.Users AS u WITH(READPAST, ROWLOCK)
ORDER BY u.Reputation DESC;

With the rowlock hint here, our query finishes.

Index Alternative


If we start the process over, but add this index:

CREATE INDEX ix_dammit_please_just_work
    ON dbo.Users(Reputation);

Some things will be different:

  • We don’t need a rowlock hint on the update
  • We don’t need a rowlock hint on the select

This is true despite there being more overall locks taken for the update:

<Lock resource_type="KEY" index_name="ix_dammit_please_just_work" request_mode="X" request_status="GRANT" request_count="2" />
<Lock resource_type="KEY" index_name="PK_Users_Id" request_mode="X" request_status="GRANT" request_count="1" />
<Lock resource_type="OBJECT" request_mode="IX" request_status="GRANT" request_count="1" />
<Lock resource_type="PAGE" page_type="*" index_name="ix_dammit_please_just_work" request_mode="IX" request_status="GRANT" request_count="1" />
<Lock resource_type="PAGE" page_type="*" index_name="PK_Users_Id" request_mode="IX" request_status="GRANT" request_count="1" />

But the addition of the index makes row level locks a more obvious choice for both queries.

Thanks for reading!

Going Further


If this is the kind of SQL Server stuff you love learning about, you’ll love my training. I’m offering a 75% discount to my blog readers if you click from here. I’m also available for consulting if you just don’t have time for that and need to solve performance problems quickly.

How SQL Server’s Query Plan Cache Lies: Triggers

Simpler Times


Let’s say we’ve got a simple update query. When we run it, it finishes instantly, and the query plan has no surprises.

BEGIN TRAN
UPDATE u
SET u.Reputation = 2147483647
FROM dbo.Users AS u
WHERE u.Id = 22656;

ROLLBACK
SQL Server Query Plan
One to the two

Then one day DevOps comes along and says that every time Reputation gets updated in the Users table, we have to check a bunch of conditions and then do a bunch of stuff based on the value.

One of those checks is to see if anyone has the ?INT MAX? and then insert a row into Badges.

Because I’m lazy (Agile?), I’m going to stick a waitfor in the trigger to simulate all the other checks and actions.

CREATE OR ALTER TRIGGER dbo.one_time
ON dbo.Users
AFTER UPDATE
AS
BEGIN
    
    IF EXISTS ( SELECT 1/0 
                FROM Inserted 
                WHERE Inserted.Reputation = 2147483647 )

    INSERT dbo.Badges ( Name, UserId, Date )
    SELECT N'INT MAX OMG', Id, GETDATE()
    FROM Inserted

    WAITFOR DELAY '00:00:10.000'

END;
GO

Less Simpler Times


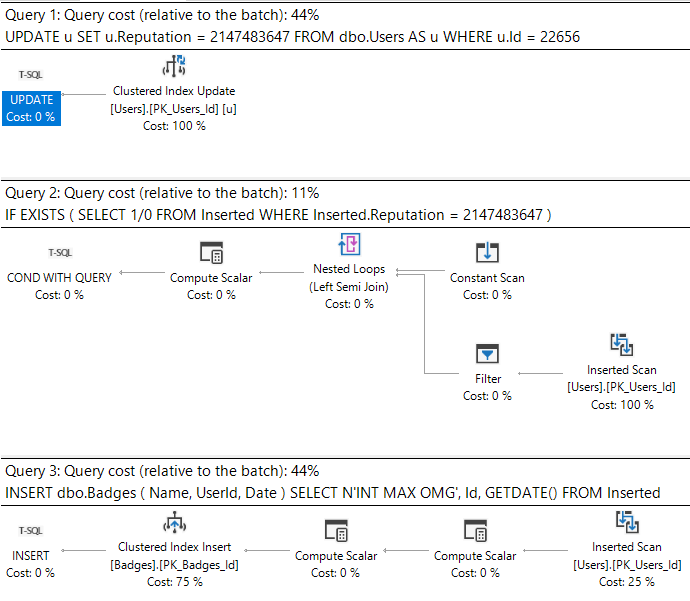
Now when we run our update, the plan looks like this.

SQL Server Query Plan
Ass-mar

What’s important here is that we can see the work associated with the triggers.

What sucks is when we look at the plan cache.

Back To Easy


I’m gonna stick that update in a stored procedure to make life a little easier when we go looking for it.

CREATE PROCEDURE dbo.update_reputation 
AS
BEGIN
    BEGIN TRAN
    UPDATE u
    SET u.Reputation = 2147483647
    FROM dbo.Users AS u
    WHERE u.Id = 22656;
    
    ROLLBACK    
END;

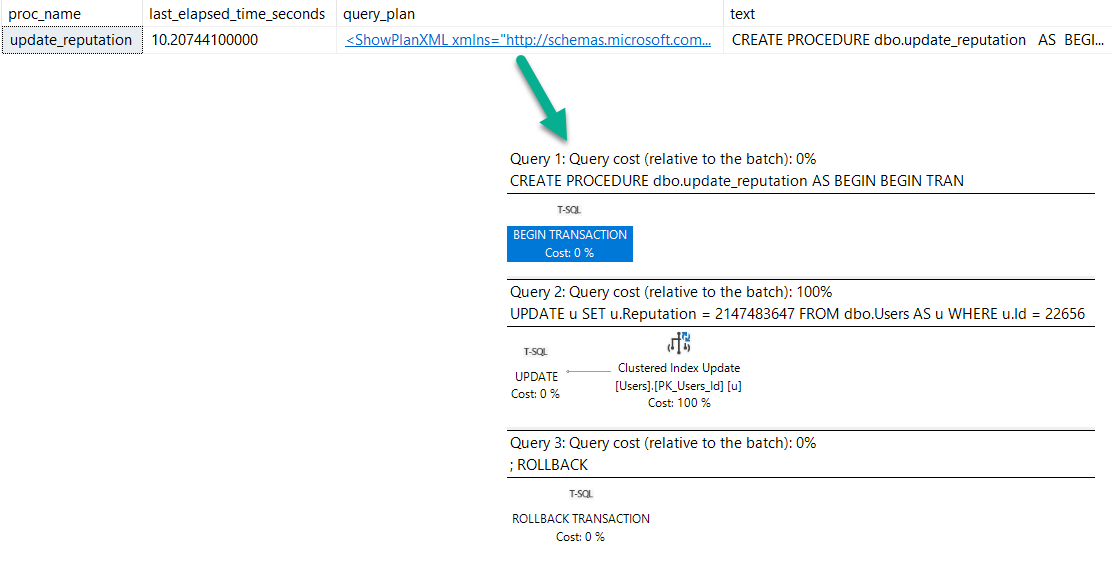
After running the procedure, here’s what we get back from the plan cache.

    SELECT OBJECT_NAME(deps.object_id) AS proc_name, 
           deps.last_elapsed_time / 1000. / 1000. AS last_elapsed_time_seconds,
           deqp.query_plan,
           dest.text
    FROM sys.dm_exec_procedure_stats AS deps
    CROSS APPLY sys.dm_exec_query_plan(deps.plan_handle) AS deqp
    CROSS APPLY sys.dm_exec_sql_text(deps.plan_handle) AS dest
    WHERE deps.object_id = OBJECT_ID('dbo.update_reputation');
SQL Server Query Plan
Investigative Reports

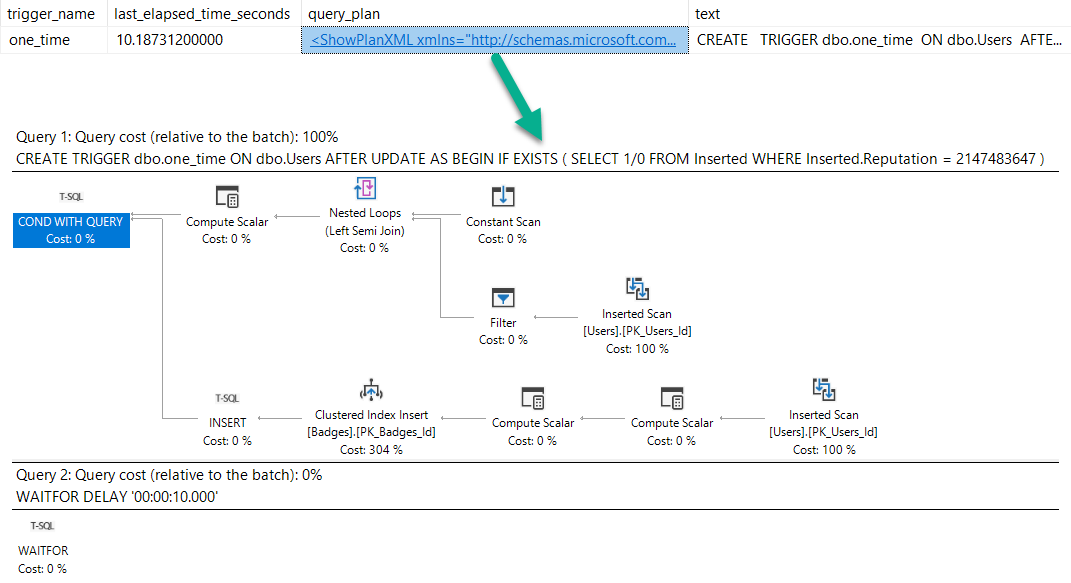
We have a procedure reporting that it ran for 10 seconds (which it did, sort of…).

But no mention of the trigger. Hm.

Of course, we can get this information from trigger stats, but we’d have to know to go looking:

    SELECT OBJECT_NAME(object_id) AS trigger_name,
           dets.last_elapsed_time / 1000. / 1000. AS last_elapsed_time_seconds,
           deqp.query_plan,
           dest.text
    FROM sys.dm_exec_trigger_stats AS dets
    CROSS APPLY sys.dm_exec_query_plan(dets.plan_handle) AS deqp
    CROSS APPLY sys.dm_exec_sql_text(dets.plan_handle) AS dest
    WHERE OBJECT_ID = OBJECT_ID('dbo.one_time');
SQL Server Query Plan
Get busy

Lying Liars


When seemingly simple modification queries take a long time, things may not be as simple as they appear.

Blocking, and triggers might be at play. Unfortunately, there’s not a great way of linking any of that together right now.

Thanks for reading!

Going Further


If this is the kind of SQL Server stuff you love learning about, you’ll love my training. I’m offering a 75% discount to my blog readers if you click from here. I’m also available for consulting if you just don’t have time for that and need to solve performance problems quickly.