Cursor Declarations That Use LOB Local Variables Can Bloat Your Plan Cache

I found a few stored procedures with single plan cache entries over 500 MB of memory each according to sys.dm_exec_cached_plans while optimizing the plan cache in production. The stored procedures were relatively simple and both execution plans were less than 1 MB when saved as sqlplan files. I was confused, offended, and confused.

First published on MSDN on Jan 09, 2007

Did you know that the memory used for cursors can be cached along with the compiled plan? I’ll include a direct quote of the ancient wisdom:

Inactive cursors are cached in the compiled plan. Just like MXCs there are two lists maintained here: the lookup list and the enum list. The lookup list stores the inactive cursors. When a cursor is de-allocated, the memory used to store the cursor is cached. On subsequent re-execution of the batch with this cursor, the cached cursor memory is reused and re-initialized as an active cursor. The enum list has the list of active and inactive cursors and is used to enumerate all cursors for a compiled plan.

Cursors are re-generatable given a compiled plan. Relative to compiled plans they are also relatively inexpensive to re-generate.

I checked sys.dm_exec_cached_plan_dependent_objects and found that nearly all of the cached memory was used for the cursors instead of the execution plans. This makes sense because there was no reason why a simple procedure should use 500 MB for a cached plan, but why were the cursors using so much memory?

Back to 2022

I was able to create a simple reproduction of the issue on SQL Server 2022 CU13 which is the most recent version currently available at the time of writing. Create a stored procedure that uses the OPENJSON() function along with an NVARCHAR(MAX) local variable as part of a cursor declaration. Here is one example:


CREATE OR ALTER PROCEDURE TestMemoryLeak_1
AS
BEGIN
    SET NOCOUNT ON;

    DECLARE @json NVARCHAR(MAX);

    SET @json = N'[
        {
            "Order": {
                "Number": "SO43659",
                "Date": "2024-05-31T00:00:00"
            },
            "AccountNumber": "AW29825",
            "Item": {
                "Price": 2024.9940,
                "Quantity": 1
            }
        },
        {
            "Order": {
                "Number": "SO43661",
                "Date": "2024-06-01T00:00:00"
            },
            "AccountNumber": "AW73565",
            "Item": {
                "Price": 2024.9940,
                "Quantity": 3
            }
        }
    ]';

    DECLARE json_cursor CURSOR FAST_FORWARD FOR 
    SELECT Number, OrderDate, Customer, Quantity
    FROM OPENJSON(@json) WITH (
        Number VARCHAR(200) '$.Order.Number',
        OrderDate DATETIME '$.Order.Date',
        Customer VARCHAR(200) '$.AccountNumber',
        Quantity INT '$.Item.Quantity'
    );

    DECLARE 
        @Number VARCHAR(200),
        @OrderDate DATETIME,
        @Customer VARCHAR(200),
        @Quantity INT;

    OPEN json_cursor;
    FETCH NEXT FROM json_cursor INTO @Number, @OrderDate, @Customer, @Quantity;
    WHILE @@FETCH_STATUS = 0
    BEGIN
        -- nobody wants to work anymore

        FETCH NEXT FROM json_cursor INTO @Number, @OrderDate, @Customer, @Quantity;
    END;
    CLOSE json_cursor;
    DEALLOCATE json_cursor;

    RETURN;
END;
GO

The amount of memory cached for the cursor execution can be seen with the following code:

DECLARE @plan_handle varbinary(64);
SELECT @plan_handle = plan_handle
FROM sys.dm_exec_procedure_stats
where object_id = object_id('[TestMemoryLeak_1]');

SELECT * FROM 
sys.dm_os_memory_objects
WHERE type = 'MEMOBJ_CURSOREXEC'
AND memory_object_address IN  (
    SELECT memory_object_address
    FROM sys.dm_exec_cached_plan_dependent_objects(@plan_handle)
);

I executed the test stored procedure 1 time, measured the memory usage, then executed it 9999 more times, and finally measured the memory usage again. I expected the memory usage to not change because the cursor always processes the same data. SQL Server betrayed my expectations:

A cursor that processes 2 rows of data has managed to use 163 MB of cached memory. Wonderful. One workaround is to remove OPENJSON() from the cursor definition by inserting the data into a table variable and making the cursor read from the table variable:

DECLARE @json_table TABLE (
    Number VARCHAR(200) NULL,
    OrderDate DATETIME NULL,
    Customer VARCHAR(200) NULL,
    Quantity INT NULL
);

INSERT INTO @json_table (Number, OrderDate, Customer, Quantity)
SELECT Number, OrderDate, Customer, Quantity
FROM OPENJSON(@json) WITH (
    Number VARCHAR(200) '$.Order.Number',
    OrderDate DATETIME '$.Order.Date',
    Customer VARCHAR(200) '$.AccountNumber',
    Quantity INT '$.Item.Quantity'
);

DECLARE json_cursor CURSOR FAST_FORWARD FOR 
SELECT Number, OrderDate, Customer, Quantity
FROM @json_table;

SQL Server no longer betrays my expectations. The amount of cached memory for the cursor does not change between 1 and 10000 executions:

Here is a comparison using the sys.dm_exec_cached_plans DMV:

Determining which row is associated with each stored procedure is an exercise left up to the reader.

A second workaround is to define the cursor using the LOCAL argument. A third workaround is to define the local variable as NVARCHAR(4000). Thank you to the comments for both of these workarounds. Note that I originally thought the issue was related to OPENJSON() but it appears that was an error on my part. The presence of an LOB variable looks to be the determining factor.

Final Thoughts

Using local LOB variables as part of a cursor declaration can lead to ever-increasing amounts of cached memory associated with its cached plan. It’s possible that SQL Server will prune this plan once it experiences plan cache pressure, but it may also choose to prune other plans instead. I recommend coding defensively by always using the LOCAL argument for your cursor declarations. Thanks for reading!

Another Method to Reduce Temp Table Plan Cache Pollution

SQL Server allows stored procedures to reference temporary tables that were created in an outer scope. However, doing so can cause the plan cache pollution problem described here.

The Polluter

The problem can be observed with a simple repro script. The child stored procedure performs a series of updates on a temp table. The parent procedure creates the temp table, calls the child stored procedure, and returns data from the temp table.

CREATE OR ALTER PROCEDURE dbo.update_temp_table
AS
BEGIN
    SET NOCOUNT ON;
    -- the #outer_scope temp table is created in an outer scope

    UPDATE #outer_scope SET CNT = (SELECT COUNT(*) FROM master..spt_values t1 CROSS JOIN master..spt_values t2) + (SELECT COUNT(*) FROM master..spt_values t1 CROSS JOIN master..spt_values t2)
    WHERE ID = 1;

    UPDATE #outer_scope SET CNT = (SELECT COUNT(*) FROM master..spt_values t1 CROSS JOIN master..spt_values t3) + (SELECT COUNT(*) FROM master..spt_values t1 CROSS JOIN master..spt_values t2)
    WHERE ID = 1;

    UPDATE #outer_scope SET CNT = (SELECT COUNT(*) FROM master..spt_values t1 CROSS JOIN master..spt_values t4) + (SELECT COUNT(*) FROM master..spt_values t1 CROSS JOIN master..spt_values t2)
    WHERE ID = 1;

    UPDATE #outer_scope SET CNT = (SELECT COUNT(*) FROM master..spt_values t1 CROSS JOIN master..spt_values t5) + (SELECT COUNT(*) FROM master..spt_values t1 CROSS JOIN master..spt_values t2)
    WHERE ID = 1;
END;

GO

CREATE OR ALTER PROCEDURE dbo.parent_proc
AS
BEGIN
    SET NOCOUNT ON;

    CREATE TABLE #outer_scope (ID INT NOT NULL, CNT INT NULL);
    INSERT INTO #outer_scope (ID, CNT)
    VALUES (1, NULL);

    EXEC dbo.update_temp_table;

    SELECT * FROM #outer_scope;
END;

GO

I executed the parent_proc procedure on three different sessions and was rewarded with three different cached plans:

The Cleaner

One way to resolve this issue is to change the child procedure to create a new local temp table, to copy the data from the original table into the new one using its own child procedure, to perform the updates against the new table, and to copy back the data into the original table, again in a child procedure. That was a lot of words so perhaps code will be easier to understand:

CREATE OR ALTER PROCEDURE dbo.update_temp_table_import_temp_data
WITH RECOMPILE
AS
BEGIN	
    IF OBJECT_ID(N'tempdb..#outer_scope', 'U') IS NOT NULL
    BEGIN
        INSERT INTO #local_scope
        SELECT * FROM #outer_scope;
    END;
END;

GO


CREATE OR ALTER PROCEDURE dbo.update_temp_table_export_temp_data
WITH RECOMPILE
AS
BEGIN
    IF OBJECT_ID(N'tempdb..#outer_scope', 'U') IS NOT NULL
    BEGIN
        TRUNCATE TABLE #outer_scope;	

        INSERT INTO #outer_scope
        SELECT * FROM #local_scope;
    END;
END;

GO


CREATE OR ALTER PROCEDURE dbo.update_temp_table_NEW
AS
BEGIN
    SET NOCOUNT ON;
    
    CREATE TABLE #local_scope (ID INT NOT NULL, CNT INT NULL);
    
    EXEC dbo.update_temp_table_import_temp_data;
    
    UPDATE #local_scope SET CNT = (SELECT COUNT(*) FROM master..spt_values t1 CROSS JOIN master..spt_values t2) + (SELECT COUNT(*) FROM master..spt_values t1 CROSS JOIN master..spt_values t2)
    WHERE ID = 1;

    UPDATE #local_scope SET CNT = (SELECT COUNT(*) FROM master..spt_values t1 CROSS JOIN master..spt_values t3) + (SELECT COUNT(*) FROM master..spt_values t1 CROSS JOIN master..spt_values t2)
    WHERE ID = 1;

    UPDATE #local_scope SET CNT = (SELECT COUNT(*) FROM master..spt_values t1 CROSS JOIN master..spt_values t4) + (SELECT COUNT(*) FROM master..spt_values t1 CROSS JOIN master..spt_values t2)
    WHERE ID = 1;

    UPDATE #local_scope SET CNT = (SELECT COUNT(*) FROM master..spt_values t1 CROSS JOIN master..spt_values t5) + (SELECT COUNT(*) FROM master..spt_values t1 CROSS JOIN master..spt_values t2)
    WHERE ID = 1;
    
    EXEC update_temp_table_export_temp_data;
END;	
    
GO


CREATE OR ALTER PROCEDURE dbo.parent_proc_NEW
AS
BEGIN
    SET NOCOUNT ON;

    CREATE TABLE #outer_scope (ID INT NOT NULL, CNT INT NULL);
    INSERT INTO #outer_scope (ID, CNT)
    VALUES (1, NULL);

    EXEC dbo.update_temp_table_NEW;

    SELECT * FROM #outer_scope;
END;

GO

Running the new procedure in three different sessions no longer results in cache pollution:

This is because the references to outer-scoped temp tables have been moved to small, simple procedures that are built with a procedure level RECOMPILE hint. This approach has the following advantages:

  • There is no cache pollution for any of the code.
  • The update statements will be compiled significantly less often, especially on SQL Server 2019 and above.

It also has the following disadvantages:

  • Data from the outer table needs to be written to the local table and data from the local table is written back to the outer table.
  • The definition and columns of the temp table need to be duplicated in additional places in code.

I don’t think that this is the best general solution by any means, but it does fulfill a particular niche use case and I’ve been able to use this method in production code. For other ideas, Erland Sommarskog has a detailed write up of different ways of passing data between procedures.

Final Thoughts

When you need your plan cache to be cleaned there’s really only one person to call:

Thanks for reading!

SQL Server Community Tools: Capturing Which Queries Are Recompiling And Why With sp_HumanEvents

Classic Espionage


Like query compilations, query recompilations can be annoying. The bigger difference is that even occasional recompiles can introduce a bad query plan.

If your monitoring tools or scripts are warning you about high compiles or recompiles, sp_HumanEvents can help you dig in further.

We talked about compilations yesterday (and, heck, maybe I should have added that point in there, but hey), so today we’ll talk about recompilations.

There are a lot of reasons why a query might recompile:

  • Schema changed
  • Statistics changed
  • Deferred compile
  • Set option change
  • Temp table changed
  • Remote rowset changed
  • For browse permissions changed
  • Query notification environment changed
  • PartitionView changed
  • Cursor options changed
  • Option (recompile) requested
  • Parameterized plan flushed
  • Test plan linearization
  • Plan affecting database version changed
  • Query Store plan forcing policy changed
  • Query Store plan forcing failed
  • Query Store missing the plan
  • Interleaved execution required recompilation
  • Not a recompile
  • Multi-plan statement required compilation of alternative query plan
  • Query Store hints changed
  • Query Store hints application failed
  • Query Store recompiling to capture cursor query
  • Recompiling to clean up the multiplan dispatcher plan

That list is from SQL Server 2022, so there are going to be some listed here that you might not see just yet.

But let’s face it, the reasons you’re gonna see most often is probably

  • Schema changed
  • Statistics changed
  • Temp table changed
  • Option (recompile) requested

Mad Dog


To capture which queries are recompiling in a certain window, I’ll usually do something like this:

EXEC sp_HumanEvents 
    @event_type = 'recompiles',
    @seconds_sample = 30;

Sometimes recompiles can be good:

  • Schema changed: use a new index that suits the query better
  • Statistics changed: use newer statistics that more accurately reflect column data
  • Temp table changed: use a new histogram for a temp table more relevant to the query
  • Option (recompile) requested: burn it flat, salt the earth

But of course, there’s always an element of danger, danger when a query starts using a new plan. What if it sucks?

To cut down on recompiles, you can use this stuff:

  • Plan Guides
  • Query Store forced plans
  • Keep Plan/KeepFixed Plan query hints
  • Stop using recompile hints?

One thing that can be a pretty big bummer about recompiles is that, if you’re relying solely on the plan cache to find problem queries, they can leave you with very little (or zero) evidence about what queries are getting up to.

Query Store and some monitoring tools will capture them, so you’re better off using those for more in-depth analysis.

Thanks for reading!

Going Further


If this is the kind of SQL Server stuff you love learning about, you’ll love my training. I’m offering a 75% discount to my blog readers if you click from here. I’m also available for consulting if you just don’t have time for that, and need to solve database performance problems quickly. You can also get a quick, low cost health check with no phone time required.

SQL Server Community Tools: Capturing Which Queries Are Compiling With sp_HumanEvents

Compilation Game


One thing that I have to recommend to clients on a fairly regular basis is to enable Forced Parameterization. Many vendor applications send over queries that aren’t parameterized, or without strongly typed parameters, and that can make things… awkward.

Every time SQL Server gets one of those queries, it’ll come up with a “new” execution plan, cache it, and blah blah blah. That’s usually not ideal for a lot of reasons.

There are potentially less tedious ways to figure out which queries are causing problems, by looking in the plan cache or query store.

But, you know, sometimes the plan cache isn’t reliable, and sometimes Query Store isn’t turned on.

And so we have sp_HumanEvents!

Easy Street


One way to start getting a feel for which queries are compiling the most, along with some other details about compilation metrics and parameterization is to do this:

EXEC sp_HumanEvents 
    @event_type = 'compilations',
    @seconds_sample = 30;

Newer versions of SQL Server have an event called query_parameterization_data.

Fired on compile for every query relevant for determining if forced parameterization would be useful for this database.

If you start monitoring compilations with sp_HumanEvents you’ll get details from this event back as well, as long as it’s available in your version of SQL Server.

You can find all sorts of tricky application problems with this event setup.

Thanks for reading!

Going Further


If this is the kind of SQL Server stuff you love learning about, you’ll love my training. I’m offering a 75% discount to my blog readers if you click from here. I’m also available for consulting if you just don’t have time for that, and need to solve database performance problems quickly. You can also get a quick, low cost health check with no phone time required.

Correlating Data From sp_WhoIsActive to Query Store Or The Plan Cache

sp_QuickiePost


If you’re the type of person who logs sp_WhoIsActive to a table to capture executing queries, you may want to find some additional details about the statements that end up there.

Out of the box, it’s arduous, tedious, and cumbersome to click around on a bunch of columns and grab handles and hashes and blah blah.

Now, these two queries depend on you grabbing a couple specific columns in your output. If you’re not getting these, you’re kinda screwed:

From query plans, you can get the plan handle and plan hash:

WITH XMLNAMESPACES(DEFAULT 'http://schemas.microsoft.com/sqlserver/2004/07/showplan')
SELECT
   session_id,
   query_plan,
   additional_info,
   query_hash = 
       q.n.value('@QueryHash', 'varchar(18)'),
   query_plan_hash = 
       q.n.value('@QueryPlanHash', 'varchar(18)')
FROM dbo.WhoIsActive AS w
CROSS APPLY w.query_plan.nodes('//StmtSimple') AS q(n);

From additional info, you can get the SQL Handle and Plan Handle:

SELECT
  session_id,
  query_plan,
  additional_info,
  sql_handle =
      w.additional_info.value('(//additional_info/sql_handle)[1]', 'varchar(131)'),
  plan_handle = 
      w.additional_info.value('(//additional_info/plan_handle)[1]', 'varchar(131)')
FROM dbo.WhoIsActive AS w;

Causation


For the plan cache, you can use your favorite script. Mine is, of course, sp_BlitzCache.

You you can use the @OnlyQueryHashes or @OnlySqlHandles parameters to filter down to queries you’re interested in.

For Query Store, you can use my script sp_QuickieStore to do the same thing.

It has parameters for @include_query_hashes, @include_plan_hashes or @include_sql_handles.

You might want to add some other filtering or sorting to the queries up there to find what you’re interested in, but this should get you started.

I couldn’t find a quick or easy way to combine the two queries, since we’re dealing with two different columns of XML data, and the query plan XML needs a little special treatment to be queried.

Thanks for reading!

Going Further


If this is the kind of SQL Server stuff you love learning about, you’ll love my training. I’m offering a 75% discount to my blog readers if you click from here. I’m also available for consulting if you just don’t have time for that, and need to solve database performance problems quickly. You can also get a quick, low cost health check with no phone time required.

Let’s Stop Calling Queries “Expensive”

Bad Names


When we talk about finding queries to tune, there’s an unfortunate term that gets thrown around: Expensive Queries.

Why is it unfortunate? Well, it reinforces the wrong mindset when it comes to query tuning, and leads people down the wrong path, looking at the wrong metrics.

SQL Server does have a cost-based optimizer, but those costs don’t mean anything to your hardware, or even to how long a query runs for.

Those costs are all estimates, based on two-decade old computer specs. There are many times when they’re wrong, or not properly aligned with reality.

Worse, it leads people to want to do crazy things like sort the plan cache by query cost to find things to tune.

Worse than that, they’ll look at “query cost relative to batch” to compare two queries for efficiency.

Ethically Sourced


There are many sources to find queries eating up your server hardware.

The point of this post isn’t to teach you how to use any of those things, but to teach you how to be smarter about using them in whatever way you’re comfortable.

My two favorite metrics to look at when looking for queries to tune are CPU and RAM. I explain why in the post, but the short story is that they’re reliable, real-life metrics that can be directly measured before and after to gauge progress.

I don’t look at things like reads, because those might go up or down while your query runtime doesn’t change at all.

They’re also pretty misleading if you’re looking at STATISTICS IO in a lot of circumstances, like with lookups.

Sortie


A while back I recorded a bunch of videos that show how cached/estimated plans can be really misleading when it comes to costs and all that stuff.

You can find it here:

Thanks for reading!

Going Further


If this is the kind of SQL Server stuff you love learning about, you’ll love my training. I’m offering a 75% discount to my blog readers if you click from here. I’m also available for consulting if you just don’t have time for that and need to solve performance problems quickly.

What Do Optimizer Timeouts Really Mean In SQL Server Query Plans?

Time Is On My Side


Whenever I’m looking over query plans with clients, their eyes get drawn towards many things that I’ve learned to ignore over the years.

It’s not that they’re never important, it’s just that, you know… There’s usually more important stuff.

One of those things is compilation timeouts. Most people think that it’s time-based, and it means that their query timed out or took a long time to compile.

Not so! It’s purely a set number of steps the optimizer will take to figure out things like:

  • Join order
  • Join/Aggregate type
  • Index usage
  • Seeks vs Scans
  • Parallelism

And probably some other stuff that I just don’t have the Friday afternoon energy to think about any more.

But anyway, the point is that it’s not a sign that your query timed out, or even that plan compilation took a long time.

The initial number of steps allowed is based on the optimizer’s assessment of statement complexity, which includes the number of joins (of course), in case you were wondering.

From there each additional stage gets a set number of steps based on the number of steps that the previous stage took.

Plan Cache Script


You can use this script to look in your plan cache for plans that the optimizer has marked as having a timeout.

WITH 
    XMLNAMESPACES
(
    DEFAULT 'http://schemas.microsoft.com/sqlserver/2004/07/showplan'
)
SELECT
    query_text = 
        SUBSTRING
        (
            st.text,
            qs.statement_start_offset / 2 + 1,
            CASE qs.statement_start_offset
                 WHEN -1 
                 THEN DATALENGTH(st.text)
                 ELSE qs.statement_end_offset
            END - qs.statement_start_offset / 2 + 1
        ),
    compile_time_ms = 
        qs.query_plan.value('(//StmtSimple/QueryPlan/@CompileTime)[1]', 'bigint'),
    compile_cpu_ms = 
        qs.query_plan.value('(//StmtSimple/QueryPlan/@CompileCPU)[1]', 'bigint'),
    compile_memory_mb = 
        qs.query_plan.value('(//StmtSimple/QueryPlan/@CompileMemory)[1]', 'bigint') / 1024.,
    qs.query_plan,
    qs.execution_count,
    qs.total_worker_time,
    qs.last_execution_time
FROM
(
    SELECT TOP (10)
        qs.plan_handle,
        qs.sql_handle,
        qs.statement_start_offset,
        qs.statement_end_offset,
        qs.last_execution_time,
        qs.execution_count,
        qs.total_worker_time,
        qp.query_plan
    FROM sys.dm_exec_query_stats AS qs
    CROSS APPLY sys.dm_exec_query_plan(qs.plan_handle) AS qp
    WHERE qp.query_plan.exist('//StmtSimple/@StatementOptmEarlyAbortReason[.="TimeOut"]') = 1
    ORDER BY
        total_worker_time / qs.execution_count DESC
) AS qs
CROSS APPLY sys.dm_exec_sql_text(qs.sql_handle) AS st;

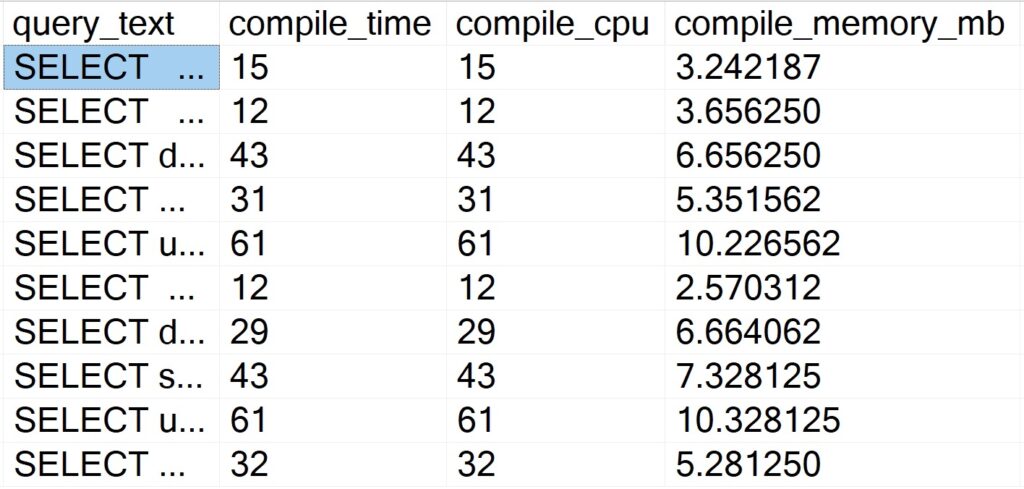
There’s not a whole lot of sense to this query other than to prove a point. Here are some abridged results from a client system:

SQL Server Query Results
amanaplanacanalpanama

Despite all of these queries “timing out” during optimization phases, the longest compile time is 61 milliseconds.

Query Store Script


Like above, there’s not a lot of sense to this one. It is nice to be able to skip some of the additional XML shredding and go to some of the plan metadata stored in Query Store:

WITH 
    XMLNAMESPACES
(
    DEFAULT 'http://schemas.microsoft.com/sqlserver/2004/07/showplan'
),
    queries
AS
    (
        SELECT TOP (101)
            parent_object_name = 
                ISNULL
                (
                    OBJECT_NAME(qsq.object_id), 
                    'No Parent Object'
                ),
            qsqt.query_sql_text,
            query_plan = 
                TRY_CAST(qsp.query_plan AS xml),
            qsrs.last_execution_time,
            qsrs.count_executions,
            qsrs.avg_duration,
            qsrs.avg_cpu_time,
            avg_compile_duration_ms = 
                qsq.avg_compile_duration / 1000.,
            avg_compile_memory_mb = 
                qsq.avg_compile_memory_kb / 1024.,
            avg_optimize_cpu_time_ms = 
                qsq.avg_optimize_cpu_time / 1024.
        FROM sys.query_store_runtime_stats AS qsrs
        JOIN sys.query_store_plan AS qsp
            ON qsp.plan_id = qsrs.plan_id
        JOIN sys.query_store_query AS qsq
            ON qsq.query_id = qsp.query_id
        JOIN sys.query_store_query_text AS qsqt
            ON qsqt.query_text_id = qsq.query_text_id
        WHERE qsrs.last_execution_time >= DATEADD(DAY, -7, SYSDATETIME())
        AND   qsrs.avg_cpu_time >= (10 * 1000)
        AND   qsq.is_internal_query = 0
        AND   qsp.is_online_index_plan = 0
        AND   TRY_CAST(qsp.query_plan AS xml).exist('//StmtSimple/@StatementOptmEarlyAbortReason[.="TimeOut"]') = 1
        ORDER BY
            qsrs.avg_cpu_time DESC
    )
SELECT
    qs.query_sql_text,
    qs.parent_object_name,    
    qs.query_plan,
    qs.avg_compile_duration_ms,
    qs.avg_optimize_cpu_time_ms,
    qs.avg_compile_memory_mb,
    qs.count_executions,
    qs.avg_duration,
    qs.avg_cpu_time,
    qs.last_execution_time
FROM
    queries AS qs
ORDER BY
    qs.avg_cpu_time DESC
OPTION (RECOMPILE);

Also like above, the results bring back very short compile times.

So There


The point of this post was that you don’t need to worry about these timeouts from a plan compilation time perspective.

Of course, it may represent a plan quality issue, but that’s much harder to prove from first glances. You’d need to dig into that on your own Friday afternoon.

If you find user queries experiencing optimizer timeouts, it may solve the problem to simplify them as much as possible. Breaking long queries up into #temp tables is a popular solution for this.

Thanks for reading!

Going Further


If this is the kind of SQL Server stuff you love learning about, you’ll love my training. I’m offering a 75% discount to my blog readers if you click from here. I’m also available for consulting if you just don’t have time for that and need to solve performance problems quickly.

SQL Server 2022 Is Going To Mess Up Your Query Monitoring Scripts

At Least For Now


SQL Server 2022 has a new feature in it to help with parameter sensitive query plans.

That is great. Parameter sensitivity, sometimes just called parameter sniffing, can be a real bear to track down, reproduce, and fix.

In a lot of the client work I do, I end up using dynamic SQL like this to get things to behave:

But with this new feature, you get some of the same fixes without having to interfere with the query at all.

How It Works


You can read the full documentation here. But you don’t read the documentation, and the docs are missing some details at the moment anyway.

  • It only works on equality predicates right now
  • It only works on one predicate per query
  • It only gives you three query plan choices, based on stats buckets

There’s also some additional notes in the docs that I’m going to reproduce here, because this is where you’re gonna get tripped up, if your scripts associate statements in the case with calling stored procedures, or using object identifiers from Query Store.

For each query variant mapping to a given dispatcher:

  • The query_plan_hash is unique. This column is available in sys.dm_exec_query_stats, and other Dynamic Management Views and catalog tables.

  • The plan_handle is unique. This column is available in sys.dm_exec_query_statssys.dm_exec_sql_textsys.dm_exec_cached_plans, and in other Dynamic Management Views and Functions, and catalog tables.

  • The query_hash is common to other variants mapping to the same dispatcher, so it’s possible to determine aggregate resource usage for queries that differ only by input parameter values. This column is available in sys.dm_exec_query_statssys.query_store_query, and other Dynamic Management Views and catalog tables.

  • The sql_handle is unique due to special PSP optimization identifiers being added to the query text during compilation. This column is available in sys.dm_exec_query_statssys.dm_exec_sql_textsys.dm_exec_cached_plans, and in other Dynamic Management Views and Functions, and catalog tables. The same handle information is available in the Query Store as the last_compile_batch_sql_handle column in the sys.query_store_query catalog table.

  • The query_id is unique in the Query Store. This column is available in sys.query_store_query, and other Query Store catalog tables.

The problem is that, sort of like dynamic SQL, this makes each different plan/statement impossible to tie back to the procedure.

What I’ve Tried


Here’s a proc that is eligible for parameter sensitivity training:

CREATE OR ALTER PROCEDURE 
    dbo.SQL2022
(
    @ParentId int
)
AS
BEGIN
SET NOCOUNT, XACT_ABORT ON;

    SELECT TOP (10) 
        u.DisplayName, 
        p.*
    FROM dbo.Posts AS p
    JOIN dbo.Users AS u
        ON p.OwnerUserId = u.Id
    WHERE p.ParentId = @ParentId
    ORDER BY u.Reputation DESC;

END;
GO

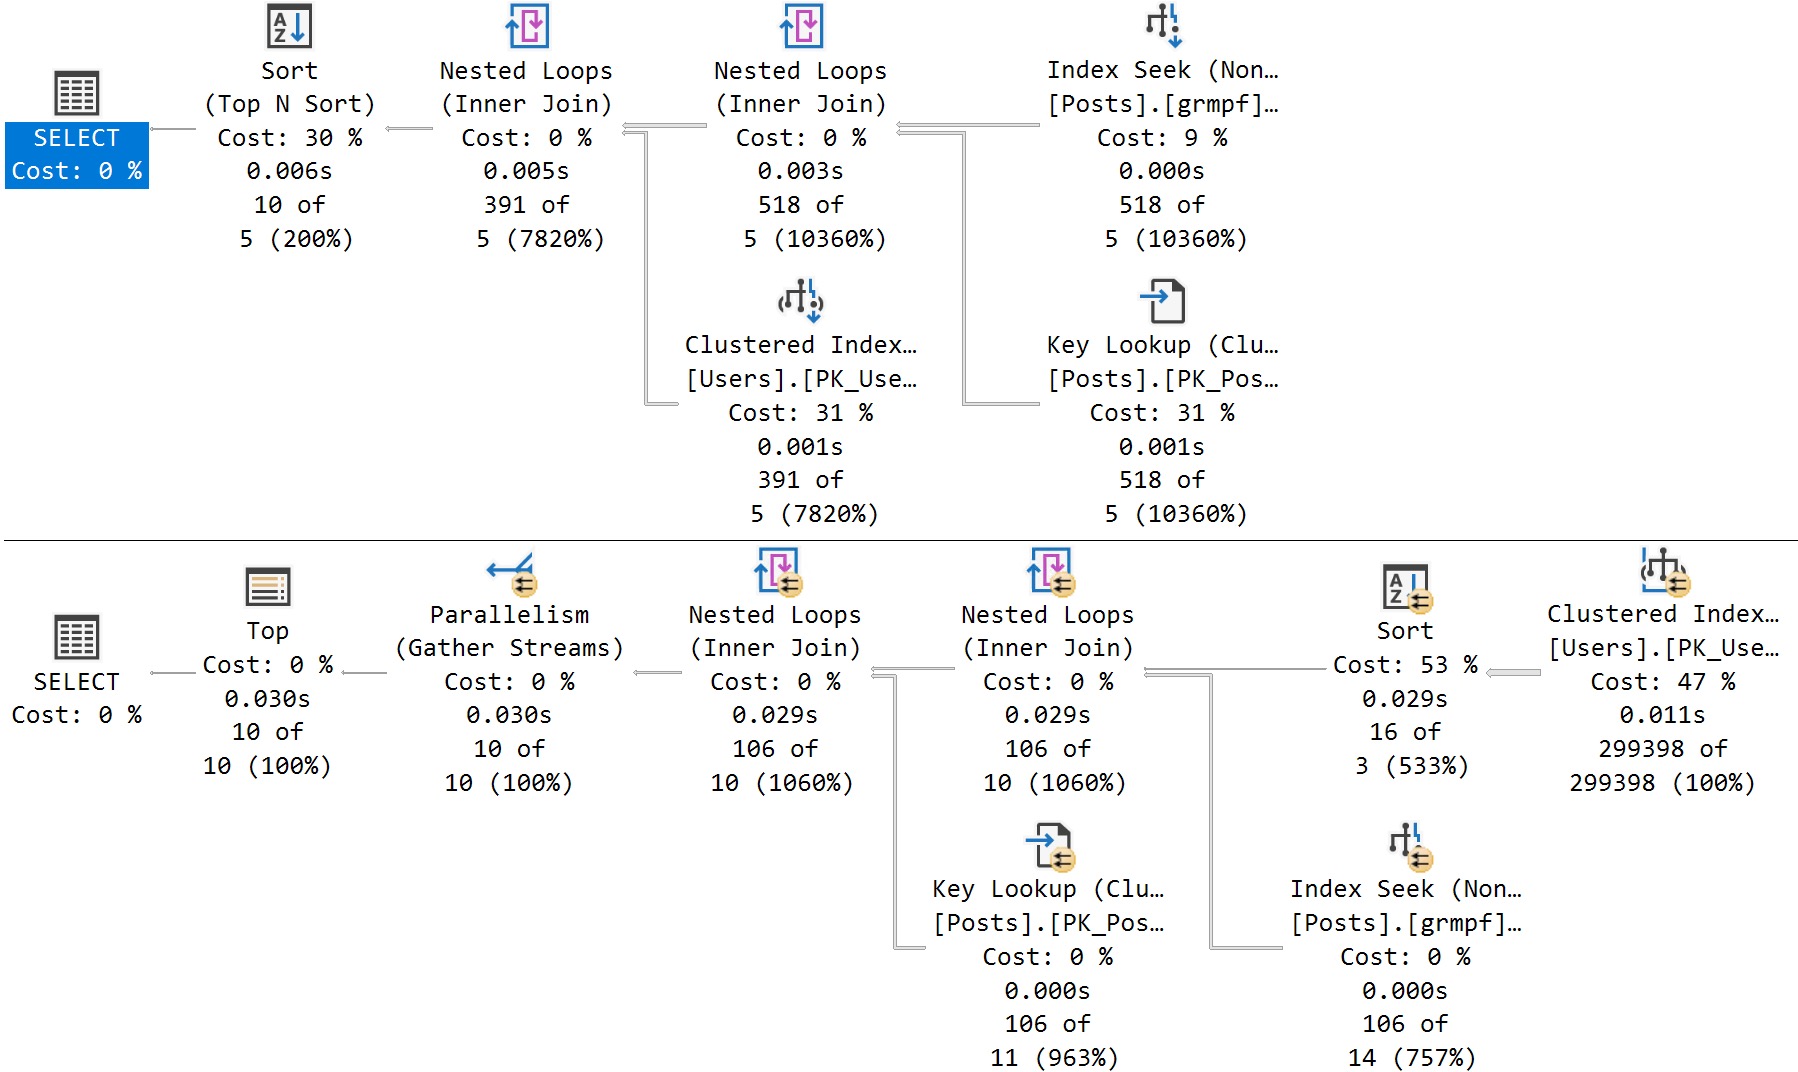
Here’s the cool part! If I run this stored procedure back to back like so, I’ll get two different query plans without recompiling or writing dynamic SQL, or anything else:

EXEC dbo.SQL2022
    @ParentId = 184618;
GO 

EXEC dbo.SQL2022 
    @ParentId = 0;
GO
SQL Server Query Plan
amazing!

It happens because the queries look like this under the covers:

SELECT TOP (10) 
    u.DisplayName, 
    p.*
FROM dbo.Posts AS p
JOIN dbo.Users AS u
    ON p.OwnerUserId = u.Id
WHERE p.ParentId = @ParentId
ORDER BY u.Reputation DESC 
OPTION (PLAN PER VALUE(QueryVariantID = 1, predicate_range([StackOverflow2010].[dbo].[Posts].[ParentId] = @ParentId, 100.0, 1000000.0)))

SELECT TOP (10) 
    u.DisplayName, 
    p.*
FROM dbo.Posts AS p
JOIN dbo.Users AS u
    ON p.OwnerUserId = u.Id
WHERE p.ParentId = @ParentId
ORDER BY u.Reputation DESC 
OPTION (PLAN PER VALUE(QueryVariantID = 3, predicate_range([StackOverflow2010].[dbo].[Posts].[ParentId] = @ParentId, 100.0, 1000000.0)))

Where Things Break Down


Normally, sp_BlitzCache will go through whatever statements it picks up and associate them with the parent object:

EXEC sp_BlitzCache
    @DatabaseName = 'StackOverflow2010';

But it doesn’t do that here, it just says that they’re regular ol’ statements:

SQL Server Query Results
do i know you?

The way that it attempts to identify queries belonging to objects is like so:

RAISERROR(N'Attempting to get stored procedure name for individual statements', 0, 1) WITH NOWAIT;
UPDATE  p
SET     QueryType = QueryType + ' (parent ' +
                    + QUOTENAME(OBJECT_SCHEMA_NAME(s.object_id, s.database_id))
                    + '.'
                    + QUOTENAME(OBJECT_NAME(s.object_id, s.database_id)) + ')'
FROM    ##BlitzCacheProcs p
        JOIN sys.dm_exec_procedure_stats s ON p.SqlHandle = s.sql_handle
WHERE   QueryType = 'Statement'
AND SPID = @@SPID
OPTION (RECOMPILE);

Since SQL handles no longer match, we’re screwed. I also looked into doing something like this, but there’s nothing here!

SELECT 
    p.plan_handle, 
    pa.attribute, 
    object_name = 
        OBJECT_NAME(CONVERT(int, pa.value)),
    pa.value
FROM
(
    SELECT 0x05000600B7F6C349E0824C498D02000001000000000000000000000000000000000000000000000000000000 --Proc plan handle
    UNION ALL 
    SELECT 0x060006005859A71BB0304D498D02000001000000000000000000000000000000000000000000000000000000 --Query plan handle
    UNION ALL
    SELECT 0x06000600DCB1FC11A0224D498D02000001000000000000000000000000000000000000000000000000000000 --Query plan handle
) AS p (plan_handle)
CROSS APPLY sys.dm_exec_plan_attributes (p.plan_handle) AS pa
WHERE pa.attribute = 'objectid';

The object identifiers are all amok:

SQL Server Query Results
oops i didn’t do it again

Only the stored procedure has the correct one.

The same thing happens in Query Store, too:

EXEC sp_QuickieStore
    @debug = 1;
SQL Server Query Result
lost in translation

The object identifiers are 0 for these two queries.

One Giant Leap


This isn’t a complaint as much as it is a warning. If you’re a monitoring tool vendor, script writer, or script relier, this is gonna make things harder for you.

Perhaps it’s something that can or will be fixed in a future build, but I have no idea at all what’s going to happen with it.

Maybe we’ll have to figure out a different way to do the association, but stored procedures don’t get query hashes or query plan hashes, only the queries inside it do.

This is gonna be a tough one!

Thanks for reading!

Going Further


If this is the kind of SQL Server stuff you love learning about, you’ll love my training. I’m offering a 75% discount to my blog readers if you click from here. I’m also available for consulting if you just don’t have time for that and need to solve performance problems quickly.

Comparing Query CPU And Logical Reads Using The Plan Cache In SQL Server

Let’s Not Kid Ourselves


There are lots of things that can go wrong with SQL Server, performance-wise. Just about anything can fly off the handle.

Recently, I was handing out a passing thought on Twitter that caught the attention of the beloved and venerable Michael J Swart (b|t):

We got to Twalking a little bit about why I said that, too, and he found what I usually find when I start comparing things.

Scripty Kid


I decided to expand on some scripts to look at how queries use CPU and perform reads, and found some really interesting stuff. I’ll talk through some results and how I’d approach tuning them afterwards.

Here are the queries:

/*Queries that do no logical reads, but lots of CPU work*/
SELECT TOP (100)
    total_logical_reads = 
        FORMAT(qs.total_logical_reads, 'N0'), 
    total_worker_time_ms = 
        FORMAT(qs.total_worker_time / 1000., 'N0'),
    execution_count = 
        FORMAT(qs.execution_count, 'N0'),
    query_text = 
        SUBSTRING
        (
            st.text,
            qs.statement_start_offset / 2 + 1,
            CASE qs.statement_start_offset
                 WHEN -1 
                 THEN DATALENGTH(st.text)
                 ELSE qs.statement_end_offset
            END - qs.statement_start_offset / 2 + 1
        ),
    qp.query_plan
FROM sys.dm_exec_query_stats AS qs
CROSS APPLY sys.dm_exec_sql_text(qs.sql_handle) AS st
CROSS APPLY sys.dm_exec_query_plan(qs.plan_handle) AS qp
WHERE qs.total_logical_reads = 0
AND   qs.total_worker_time > 5000
ORDER BY qs.total_worker_time DESC;

/*Queries that do 2x more reads than CPU work*/
SELECT TOP (100)
    total_logical_reads = 
        FORMAT(qs.total_logical_reads, 'N0'), 
    total_worker_time_ms = 
        FORMAT(qs.total_worker_time / 1000., 'N0'),
    execution_count = 
        FORMAT(qs.execution_count, 'N0'),
    query_text = 
        SUBSTRING
        (
            st.text,
            qs.statement_start_offset / 2 + 1,
            CASE qs.statement_start_offset
                 WHEN -1 
                 THEN DATALENGTH(st.text)
                 ELSE qs.statement_end_offset
            END - qs.statement_start_offset / 2 + 1
        ),
    qp.query_plan
FROM sys.dm_exec_query_stats AS qs
CROSS APPLY sys.dm_exec_sql_text(qs.sql_handle) AS st
CROSS APPLY sys.dm_exec_query_plan(qs.plan_handle) AS qp
WHERE qs.total_logical_reads > (qs.total_worker_time * 2)
ORDER BY qs.total_logical_reads DESC;

/*Queries that do 4x more CPU work than reads*/
SELECT TOP (100)
    total_logical_reads = 
        FORMAT(qs.total_logical_reads, 'N0'), 
    total_worker_time_ms = 
        FORMAT(qs.total_worker_time / 1000., 'N0'),
    execution_count = 
        FORMAT(qs.execution_count, 'N0'),
    query_text = 
        SUBSTRING
        (
            st.text,
            qs.statement_start_offset / 2 + 1,
            CASE qs.statement_start_offset
                 WHEN -1 
                 THEN DATALENGTH(st.text)
                 ELSE qs.statement_end_offset
            END - qs.statement_start_offset / 2 + 1
        ),
    qp.query_plan
FROM sys.dm_exec_query_stats AS qs
CROSS APPLY sys.dm_exec_sql_text(qs.sql_handle) AS st
CROSS APPLY sys.dm_exec_query_plan(qs.plan_handle) AS qp
WHERE qs.total_worker_time > (qs.total_logical_reads * 4)
ORDER BY qs.total_worker_time DESC;

Resultant


A quick note about these is that the comparison between CPU and logical reads happens in the where clause, and I convert CPU time to milliseconds in the select list.

That might make the number look a little funny, but it makes them somewhat more easy to understand than microseconds in the grand scheme of things.

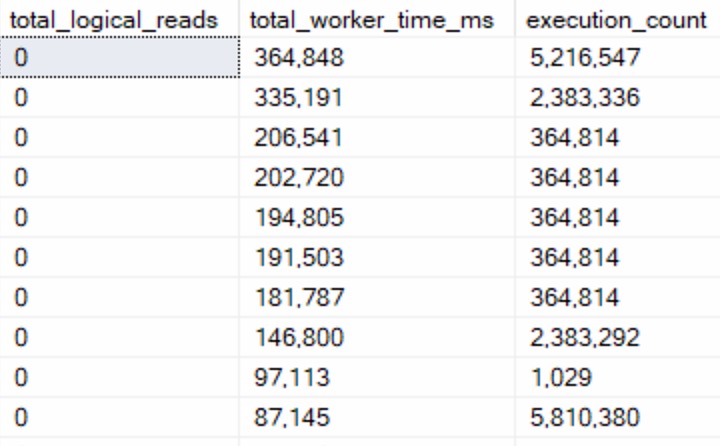
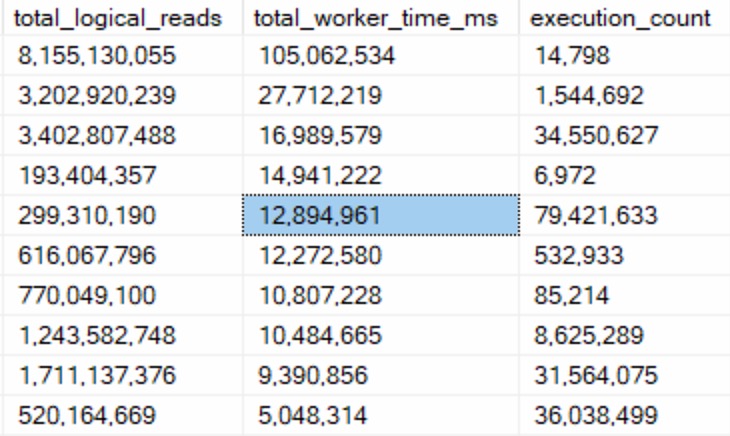
First, queries that do no logical reads but use CPU time:

SQL Server Query Results
ouchies

A lot of these were functions that processed input but didn’t touch data. Assembling and splitting string lists, XML, other variable assignment tasks, and occasionally DMV queries.

The “easy” button here is to stop using scalar and multi-statement functions so much. Those execution counts are hideous.

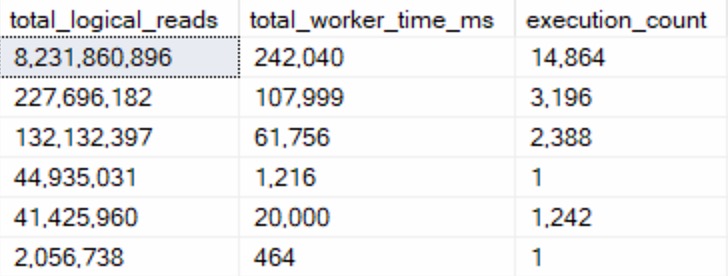
Second, queries that do 2x more reads than CPU work:

SQL Server Query Results
telling myself

I only found six of these, while the other two categories easily found the 100 row goal.

The queries in here largely seemed to either be:

  • Insert queries to temporary objects
  • Queries with parameter sniffing issues

Looking at these, the problem was largely the optimizer choosing Nested Loops joins when it really shouldn’t have. The worst part was that it wasn’t an indexing issue — every single one of these queries was doing seeks across the board — they were just happening in a serial plan, and happening way more than the optimizer estimated they would. Perhaps this is something that Adaptive Joins or Batch Mode more generally could have intervened in.

Third, queries that do 2x more CPU work than reads:

SQL Server Query Results
we are something

These queries were far more interesting from a tuning perspective, because there were obvious ineffiencies:

  • No good indexes to use
  • Large scans because of non-SARGable predicates
  • Predicate Key Lookups

But the important thing here is that these queries were able to do a lot of logical reads quickly — data they needed was already in memory — and just push the hell out of CPUs.

These are the queries you can have a field day fixing and making people happy.

Residuals


This selection of query results is why I tend to ignore logical reads and focus on CPU. I do still look at things like physical reads, and select queries that do suspicious amounts of writes.

  • Physical reads means going to disk, and disk is your mortal enemy
  • Select queries doing writes often indicate spools and spills, which can also be pretty bad

You may not like it, but this is what peak performance tuner looks like.

Thanks for reading!

Going Further


If this is the kind of SQL Server stuff you love learning about, you’ll love my training. I’m offering a 75% discount to my blog readers if you click from here. I’m also available for consulting if you just don’t have time for that and need to solve performance problems quickly.

How I Learned To Hate SQL Server’s Plan Cache

Used To Love Her


I used to get so excited about looking in the plan cache, and writing all sorts wacky XML queries to parse plans and dig for goodies.

Then I started to ask some tough questions about it, like:

  • How many plans are in here?
  • What’s the oldest one?
  • How many duplicate plans are there?
  • Where’s the parameter sniffing details?
  • Why is optimize for adhoc workloads the worst setting that everyone said is a best practice for eons?

As I wrote queries to look at a lot of these things, stuff got… weird. And disappointing.

What’s In There?


The plan cache has limits for how many plans it’ll keep, and how big of a cache it’ll keep. Even if there’s a lot of plans, there’s no guarantee that they’re older than a few hours.

You may even find that simple parameterization makes things confusing, and that things get cleared out at inopportune times.

One situation I’ve run into well-more than once is the plan cache getting cleared out due to query memory pressure, and then any chance of figuring out which queries were responsible disappears along with it.

Memory is important, someone once said.

On top of that, a lot of SQL Server consumers have way too much faith in bunk metrics, like query and operator costs. Sure, there are plenty of corroborating views to get resource usage metrics, but if all you’ve got is a query plan, all you’ve got is a bunch of nonsense costs to tweedle yourself with.

Sniff Sniff Pass


Another big miss with the plan cache is that it is almost no help whatsoever with parameter sniffing.

Sure, you can sort of figure out based on wide variances in various metrics if a plan sometimes does way more work or runs way longer than other times, but… You still just see the one plan, and its compile values. You don’t see what the plan was, or could be.

Or should be, but that’s a story for another day.

This is where Query Store is awesome, of course! You can see regressions and all that jazz.

But in the plan cache, boy howdy, you get a whole lotta nothing. No Rosie at all.

And this is why I hate the plan cache.

Thanks for reading!

Going Further


If this is the kind of SQL Server stuff you love learning about, you’ll love my training. I’m offering a 75% discount to my blog readers if you click from here. I’m also available for consulting if you just don’t have time for that and need to solve performance problems quickly.