Cursor Declarations That Use LOB Local Variables Can Bloat Your Plan Cache

I found a few stored procedures with single plan cache entries over 500 MB of memory each according to sys.dm_exec_cached_plans while optimizing the plan cache in production. The stored procedures were relatively simple and both execution plans were less than 1 MB when saved as sqlplan files. I was confused, offended, and confused.

First published on MSDN on Jan 09, 2007

Did you know that the memory used for cursors can be cached along with the compiled plan? I’ll include a direct quote of the ancient wisdom:

Inactive cursors are cached in the compiled plan. Just like MXCs there are two lists maintained here: the lookup list and the enum list. The lookup list stores the inactive cursors. When a cursor is de-allocated, the memory used to store the cursor is cached. On subsequent re-execution of the batch with this cursor, the cached cursor memory is reused and re-initialized as an active cursor. The enum list has the list of active and inactive cursors and is used to enumerate all cursors for a compiled plan.

Cursors are re-generatable given a compiled plan. Relative to compiled plans they are also relatively inexpensive to re-generate.

I checked sys.dm_exec_cached_plan_dependent_objects and found that nearly all of the cached memory was used for the cursors instead of the execution plans. This makes sense because there was no reason why a simple procedure should use 500 MB for a cached plan, but why were the cursors using so much memory?

Back to 2022

I was able to create a simple reproduction of the issue on SQL Server 2022 CU13 which is the most recent version currently available at the time of writing. Create a stored procedure that uses the OPENJSON() function along with an NVARCHAR(MAX) local variable as part of a cursor declaration. Here is one example:


CREATE OR ALTER PROCEDURE TestMemoryLeak_1
AS
BEGIN
    SET NOCOUNT ON;

    DECLARE @json NVARCHAR(MAX);

    SET @json = N'[
        {
            "Order": {
                "Number": "SO43659",
                "Date": "2024-05-31T00:00:00"
            },
            "AccountNumber": "AW29825",
            "Item": {
                "Price": 2024.9940,
                "Quantity": 1
            }
        },
        {
            "Order": {
                "Number": "SO43661",
                "Date": "2024-06-01T00:00:00"
            },
            "AccountNumber": "AW73565",
            "Item": {
                "Price": 2024.9940,
                "Quantity": 3
            }
        }
    ]';

    DECLARE json_cursor CURSOR FAST_FORWARD FOR 
    SELECT Number, OrderDate, Customer, Quantity
    FROM OPENJSON(@json) WITH (
        Number VARCHAR(200) '$.Order.Number',
        OrderDate DATETIME '$.Order.Date',
        Customer VARCHAR(200) '$.AccountNumber',
        Quantity INT '$.Item.Quantity'
    );

    DECLARE 
        @Number VARCHAR(200),
        @OrderDate DATETIME,
        @Customer VARCHAR(200),
        @Quantity INT;

    OPEN json_cursor;
    FETCH NEXT FROM json_cursor INTO @Number, @OrderDate, @Customer, @Quantity;
    WHILE @@FETCH_STATUS = 0
    BEGIN
        -- nobody wants to work anymore

        FETCH NEXT FROM json_cursor INTO @Number, @OrderDate, @Customer, @Quantity;
    END;
    CLOSE json_cursor;
    DEALLOCATE json_cursor;

    RETURN;
END;
GO

The amount of memory cached for the cursor execution can be seen with the following code:

DECLARE @plan_handle varbinary(64);
SELECT @plan_handle = plan_handle
FROM sys.dm_exec_procedure_stats
where object_id = object_id('[TestMemoryLeak_1]');

SELECT * FROM 
sys.dm_os_memory_objects
WHERE type = 'MEMOBJ_CURSOREXEC'
AND memory_object_address IN  (
    SELECT memory_object_address
    FROM sys.dm_exec_cached_plan_dependent_objects(@plan_handle)
);

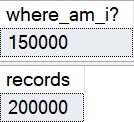
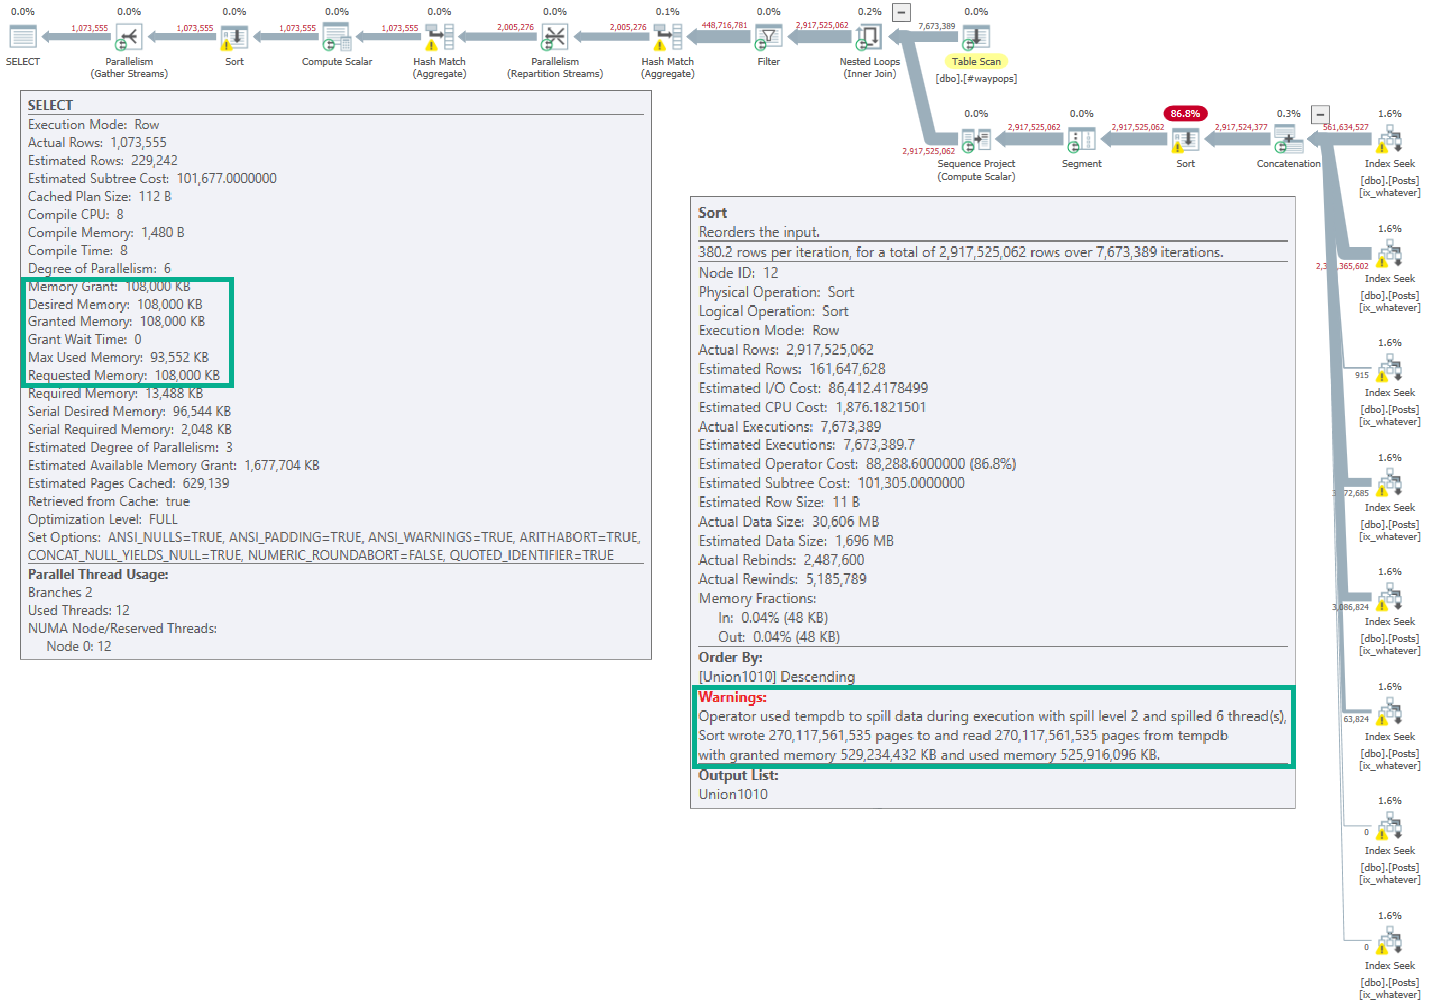
I executed the test stored procedure 1 time, measured the memory usage, then executed it 9999 more times, and finally measured the memory usage again. I expected the memory usage to not change because the cursor always processes the same data. SQL Server betrayed my expectations:

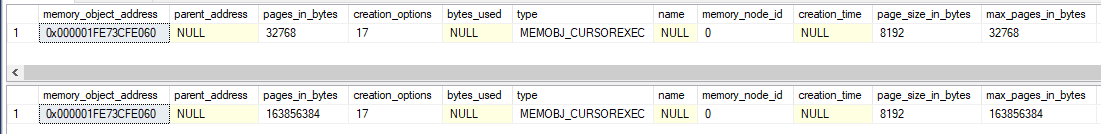
A cursor that processes 2 rows of data has managed to use 163 MB of cached memory. Wonderful. One workaround is to remove OPENJSON() from the cursor definition by inserting the data into a table variable and making the cursor read from the table variable:

DECLARE @json_table TABLE (
    Number VARCHAR(200) NULL,
    OrderDate DATETIME NULL,
    Customer VARCHAR(200) NULL,
    Quantity INT NULL
);

INSERT INTO @json_table (Number, OrderDate, Customer, Quantity)
SELECT Number, OrderDate, Customer, Quantity
FROM OPENJSON(@json) WITH (
    Number VARCHAR(200) '$.Order.Number',
    OrderDate DATETIME '$.Order.Date',
    Customer VARCHAR(200) '$.AccountNumber',
    Quantity INT '$.Item.Quantity'
);

DECLARE json_cursor CURSOR FAST_FORWARD FOR 
SELECT Number, OrderDate, Customer, Quantity
FROM @json_table;

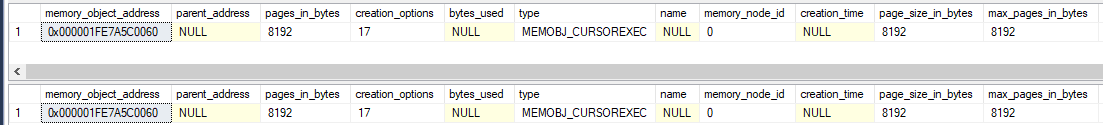
SQL Server no longer betrays my expectations. The amount of cached memory for the cursor does not change between 1 and 10000 executions:

Here is a comparison using the sys.dm_exec_cached_plans DMV:

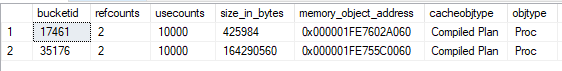
Determining which row is associated with each stored procedure is an exercise left up to the reader.

A second workaround is to define the cursor using the LOCAL argument. A third workaround is to define the local variable as NVARCHAR(4000). Thank you to the comments for both of these workarounds. Note that I originally thought the issue was related to OPENJSON() but it appears that was an error on my part. The presence of an LOB variable looks to be the determining factor.

Final Thoughts

Using local LOB variables as part of a cursor declaration can lead to ever-increasing amounts of cached memory associated with its cached plan. It’s possible that SQL Server will prune this plan once it experiences plan cache pressure, but it may also choose to prune other plans instead. I recommend coding defensively by always using the LOCAL argument for your cursor declarations. Thanks for reading!

A Not So Silent Bug With Filtered Indexes On Computed Columns In SQL Server

Bugbash


At some point in the past, I blogged about a silent bug with computed columns and clustered column store indexes.

In this post, I’m going to take a quick look at a very loud bug.

Normally, you can’t add a filtered index to a computed column. I’ve always hated that limitation. How nice would that be for so many currently difficult tasks?

I wonder if Oracle…

You Can’t Do That On Television


If you run this code to completion — and boy are you missing out if you don’t — you get an error.

CREATE TABLE dbo.ohno
(
    id int NOT NULL, 
    crap AS id * 2
);
GO 

CREATE NONCLUSTERED INDEX c 
ON dbo.ohno
    (crap) 
WHERE crap > 0;
GO

Here’s the error:

Msg 10609, Level 16, State 1, Line 13
Filtered index 'c' cannot be created on table 'dbo.ohno' because the column 'crap' in the filter expression is a computed column. 
Rewrite the filter expression so that it does not include this column.

Okay, great! Works on my machine.

Kapow, Kapow


However, you can totally create this table using the inline index creation syntax.

CREATE TABLE dbo.ohyeah
(
    id int NOT NULL, 
    crap AS id * 2,
    INDEX c 
        (crap) 
    WHERE crap > 0
);
GO

However,  if you try to query the table, you’re met with a buncha errors.

SELECT
    id
FROM dbo.ohyeah AS o;

SELECT
c = COUNT_BIG(*)
FROM dbo.ohyeah AS o;

Even without explicitly referencing the computed column, you get this error message.

Msg 207, Level 16, State 1, Procedure ohyeah, Line 1 [Batch Start Line 29]
Invalid column name 'crap'.
Msg 207, Level 16, State 1, Procedure ohyeah, Line 1 [Batch Start Line 29]
Invalid column name 'crap'.
Msg 207, Level 16, State 1, Procedure ohyeah, Line 1 [Batch Start Line 29]
Invalid column name 'crap'.
Msg 207, Level 16, State 1, Procedure ohyeah, Line 1 [Batch Start Line 29]
Invalid column name 'crap'.
Msg 207, Level 16, State 1, Procedure ohyeah, Line 1 [Batch Start Line 29]
Invalid column name 'crap'.
Msg 4184, Level 16, State 2, Line 30
Cannot retrieve table data for the query operation because the table "dbo.ohyeah" schema is being altered too frequently. 
Because the table "dbo.ohyeah" contains a filtered index or filtered statistics, changes to the table schema require a refresh of all table data. 
Retry the query operation, and if the problem persists, use SQL Server Profiler to identify what schema-altering operations are occurring.

You see what? See you what that error message says? “[I[f the problem persists, use SQL Server Profiler to identify what schema-altering operations are occurring”

Use SQL Server Profiler.

Take that, Extended Events.

Thanks for reading!

Going Further


If this is the kind of SQL Server stuff you love learning about, you’ll love my training. I’m offering a 75% discount to my blog readers if you click from here. I’m also available for consulting if you just don’t have time for that and need to solve performance problems quickly.

A Silent Bug With Clustered Column Store Indexes And Computed Columns In SQL Server 2019

Oh Boy


This bug has been reported to the proper authorities, and this blog post is not to dunk on the Summer Intern responsible for column store indexes, but to warn you to not do this, because I don’t know what it will break under the covers.

If you read the documentation for column store indexes, it says that column store indexes can’t be created on persisted computed columns.

And that’s true. If we step through this script, creating the column store index will fail.

/*Bye Felicia*/
DROP TABLE IF EXISTS dbo.cci;
GO 

/*Hi Felicia*/
CREATE TABLE dbo.cci(id int, fk int, sd date, ed datetime);
GO 

/*COMPUTER!*/
ALTER TABLE dbo.cci ADD cc AS id * 2;
ALTER TABLE dbo.cci ALTER COLUMN cc ADD PERSISTED;
GO 

/*Rats*/
CREATE CLUSTERED COLUMNSTORE INDEX c ON dbo.cci;
GO

The error message we get is pretty clear:

Msg 35307, Level 16, State 1, Line 76
The statement failed because column 'cc' on table 'cci' is a computed column. 
Columnstore index cannot include a computed column implicitly or explicitly.

80 Blocks from Tiffany’s


However, if we change the order of things a little bit, we’ll find that we can add a persisted computed column to a table with a clustered column store index on it.

/*Bye Felicia*/
DROP TABLE IF EXISTS dbo.cci;
GO 

/*Hi Felicia*/
CREATE TABLE dbo.cci(id int, fk int, sd date, ed datetime, INDEX c CLUSTERED COLUMNSTORE);
GO 

/*???*/
ALTER TABLE dbo.cci ADD cc AS id * 2;
ALTER TABLE dbo.cci ALTER COLUMN cc ADD PERSISTED;
GO 

/*With data?*/
INSERT dbo.cci
(
    id, fk, sd, ed
)
VALUES
(
    10, 10, GETDATE(), GETDATE()  
);

/*yepyepyepyepyepyep*/
SELECT
    c.*
FROM dbo.cci AS c

/*Eh?*/
ALTER INDEX c ON dbo.cci REBUILD;
ALTER INDEX c ON dbo.cci REORGANIZE;
DBCC CHECKTABLE('dbo.cci');

And everything seems to work. However, if we drop the column store index, it can’t be re-created.

The key here is that the computed column is added, and then the persisted attribute is added second. That is where an error should be thrown.

But what do I know? I’m just a bouncer.

Bomber


Again, I’m telling you not to do this. I’m telling you that it might break things in gruesome and horrible ways.

I don’t think that this is a preview of upcoming support for persisted computed columns in clustered column store indexes.

Thanks for reading!

p.s. Really, don’t do this

p.p.s. If you do this you’re asking for trouble

p.p.p.s. This was fixed in CU12

Going Further


If this is the kind of SQL Server stuff you love learning about, you’ll love my training. I’m offering a 75% discount to my blog readers if you click from here. I’m also available for consulting if you just don’t have time for that and need to solve performance problems quickly.

A Bug With OBJECTPROPERTYEX And Column Store Indexes

No, Not That Bug


There’s a known bug with partitioned tables, but this is different. This one is with rows in the delta store.

Here’s a quick repro:

USE tempdb;

DROP TABLE IF EXISTS dbo.busted;

CREATE TABLE dbo.busted ( id BIGINT, INDEX c CLUSTERED COLUMNSTORE );

INSERT INTO dbo.busted WITH ( TABLOCK )
SELECT     TOP ( 50000 )
           1
FROM       master..spt_values AS t1
CROSS JOIN master..spt_values AS t2
OPTION ( MAXDOP 1 );

-- reports 0, should be 50k
SELECT CAST(OBJECTPROPERTYEX(OBJECT_ID('dbo.busted'), N'Cardinality') AS BIGINT) AS [where_am_i?];
SELECT COUNT_BIG(*) AS records
FROM   dbo.busted;

INSERT INTO dbo.busted WITH ( TABLOCK )
SELECT     TOP ( 150000 )
           1
FROM       master..spt_values AS t1
CROSS JOIN master..spt_values AS t2
OPTION ( MAXDOP 1 );

-- reports 150k, should be 200k
SELECT CAST(OBJECTPROPERTYEX(OBJECT_ID('dbo.busted'), N'Cardinality') AS BIGINT) AS [where_am_i?];
SELECT COUNT_BIG(*) AS records
FROM   dbo.busted;

SELECT object_NAME(csrg.object_id) AS table_name, *
FROM sys.column_store_row_groups AS csrg
ORDER BY csrg.total_rows;

In Pictures


In Particular

This is the interesting bit, because you can obviously see the difference between open and compressed row groups.

SQL Server Query Results
Give us money

The 50k rows in the delta store aren’t counted towards table cardinality.

Thanks for reading!

Going Further


If this is the kind of SQL Server stuff you love learning about, you’ll love my training. I’m offering a 75% discount to my blog readers if you click from here. I’m also available for consulting if you just don’t have time for that and need to solve performance problems quickly.

CHECKDB Bug With SQL Server 2017 And ColumnStore Indexes

Going Further


If this is the kind of SQL Server stuff you love learning about, you’ll love my training. I’m offering a 75% discount to my blog readers if you click from here. I’m also available for consulting if you just don’t have time for that and need to solve performance problems quickly.

Thanks for watching!

Going Further


If this is the kind of SQL Server stuff you love learning about, you’ll love my training. I’m offering a 75% discount to my blog readers if you click from here. I’m also available for consulting if you just don’t have time for that and need to solve performance problems quickly.

A SQL Server Query Plan Memory Grant Bug?

Yes, That’s A Question


I have no idea if this is a bug or not, but I thought it was interesting. Looking at information added to spills in SQL Server 2016

SQL Server Query Plan

If you open the linked-to picture, you’ll see (hopefully) that the full memory grant for the query was 108,000KB.

But the spill on the Sort operator lists a far larger grant: 529,234,432KB.

This is in the XML, and not an artifact of Plan Explorer.

Whaddya think, Good Lookings? Should I file a bug report?

Thanks for reading!

Going Further


If this is the kind of SQL Server stuff you love learning about, you’ll love my training. I’m offering a 75% discount to my blog readers if you click from here. I’m also available for consulting if you just don’t have time for that and need to solve performance problems quickly.