SQL Server Community Tools: How I Use sp_Blitz

Elder Gods


For the last week of the series, I’m going to talk about the Blitz scripts. On top of using them for a hell of a long time, I’ve done a ton of work on them over the years.

Some of it was better than others, and there’s certainly some stuff I spent a long time on that I would never pursue today, but in general I think value was added.

I will say that nearly every check and condition that I felt inclined to add to the scripts were based on working with clients and finding some weird problems along the way.

If you ever find a really weird problem using any of these, you can thank the nice people who had really weird SQL Server problems that I worked with.

Once you spend a while tracking down a problem, you never wanna waste that time again, so you check for it every time just in case.

Deep Down


One thing that I always do with sp_Blitz is use the @CheckServerInfo parameter, set to 1.

EXEC sp_Blitz
    @CheckServerInfo = 1;

This parameter enables checks on a whole bunch of important system things, like:

  • If instant file initialization is enabled
  • If lock pages in memory is enabled
  • A whole bunch of CPU information, including if they’re in balanced power mode
  • If you have stacked SQL Server instances
  • If you have a bunch of other components (SSAS, SSIS, SSRS) installed

Stuff like that can be awesome to make note of if you’re trying to track down weird, transient issues.

I never run sp_Blitz without it.

Hop Scotch


Another thing I end up doing a lot is skipping checks, because some of them just aren’t important to me, and can be very noisy.

I never say never, but I tend to skip past stuff like:

  • Stored procedure with recompile
  • Jobs owner by users
  • Every security check (like logins with elevated permissions)
  • Jobs without failure emails

That stuff can be a real drag to scroll through. Here’s what I usually do.

CREATE TABLE 
    dbo.BlitzCheckSkip 
(
    ServerName sysname NULL,
    DatabaseName sysname NULL,
    CheckID int NULL
);

INSERT INTO 
    dbo.BlitzCheckSkip 
(
    ServerName, 
    DatabaseName, 
    CheckID
)
VALUES 
    (NULL, NULL,   55), --Database Owner <> SA
    (NULL, NULL,   86), --Elevated Permissions on a Database 
    (NULL, NULL,    6), --Jobs Owned By Users
    (NULL, NULL,   78), --Stored Procedure WITH RECOMPILE
    (NULL, NULL,  104), --Control Server Permissions
    (NULL, NULL,    5), --Security Admins
    (NULL, NULL,    4), --Sysadmins
    (NULL, NULL, 2301); --Invalid Active Directory Accounts

EXEC sp_Blitz
    @CheckServerInfo = 1,
    @SkipChecksDatabase = 'master', 
    @SkipChecksSchema = 'dbo', 
    @SkipChecksTable = 'BlitzCheckSkip';

Most of my engagements focus on performance, so I can skip this stuff because I’m not gonna sit around lecturing people about any of this.

Thanks for reading!

Going Further


If this is the kind of SQL Server stuff you love learning about, you’ll love my training. I’m offering a 75% discount to my blog readers if you click from here. I’m also available for consulting if you just don’t have time for that, and need to solve database performance problems quickly. You can also get a quick, low cost health check with no phone time required.

SQL Server Community Tools: How I Log sp_WhoIsActive To A Table

Been There


A lot of the code to do this is in the sp_WhoIsActive documentation.

But since I have to do things a little bit differently, I decided to open source the way I do things.

You can get the full script here: sp_WhoIsActive Logging

That’s the full script to the SQL Server Agent job I use.

The big tweak that I make to things is to create a new table for every day of logging. I dislike the approach of logging everything to one big table and automatically managing the retention for two reasons:

  • You might delete something important
  • It sucks querying giant tables full of query logging details

I sort of stopped short of automating creating date constraints on each table and creating a view to union them all together. I just don’t need to do that often enough.

The full command I use for logging is this:

EXEC sp_WhoIsActive
    @get_transaction_info = 1,
    @get_outer_command = 1,
    @get_plans = 1,
    @get_task_info = 2,
    @get_additional_info = 1,
    @find_block_leaders = 1,
    @get_memory_info = 1;

Which means you do have to be on the latest version of sp_WhoIsActive. If you haven’t updated in a while, uh… I promise it’s a fast and painless process.

Just hit F5.

Thanks for reading!

Going Further


If this is the kind of SQL Server stuff you love learning about, you’ll love my training. I’m offering a 75% discount to my blog readers if you click from here. I’m also available for consulting if you just don’t have time for that, and need to solve database performance problems quickly. You can also get a quick, low cost health check with no phone time required.
SQL Server Community Tools: Filtering sp_WhoIsActive Results

Oh Baby You


On really busy SQL Servers, or on SQL Servers where some ninny activated Service Broker on hundreds of databases so you have hundreds of sessions constantly sitting there waiting for conversations, being able to filter out stuff you don’t want to look at is an absolute killer feature.

And boy can sp_WhoIsActive do that really well.

You can filter in or out:

  • session id
  • program name
  • database name
  • login name
  • host name

Most of the uses I have for these filters is to watch activity for a specific session id or for a specific database.

In a moderate bit of fairness to Service Broker, I’ve only had to screen out hundreds of sessions from it a few dozen times.

Innies


To only include certain sessions in the output, do something like this:

EXEC sp_WhoIsActive
    @filter = '138',               
    @filter_type = 'session' /*session, program, database, login, host*/;

EXEC sp_WhoIsActive
    @filter = 'StackOverflow',               
    @filter_type = 'database' /*session, program, database, login, host*/;

What’s really cool is that you can use wildcards in your filters (except session) to do something like:

EXEC sp_WhoIsActive
    @filter = 'CrappyApplication%',               
    @filter_type = 'program' /*session, program, database, login, host*/;

And of course, you can filter stuff out, too.

Outies


To do that, you just need to use the not filters:

EXEC sp_WhoIsActive
    @not_filter = '138',               
    @not_filter_type = 'session' /*session, program, database, login, host*/;

EXEC sp_WhoIsActive
    @not_filter = 'StackOverflow',               
    @not_filter_type = 'database' /*session, program, database, login, host*/;

EXEC sp_WhoIsActive
    @not_filter = 'CrappyApplication%',               
    @not_filter_type = 'program' /*session, program, database, login, host*/;

Which, now that I’ve copy and pasted it in, I can’t think of too many reasons to ignore a single session id, but whatever.

This is a great way to filter out hundreds of Service Broker sessions that pollute the results because some ninny activated it in hundreds of databases, though.

Thanks for reading!

Going Further


If this is the kind of SQL Server stuff you love learning about, you’ll love my training. I’m offering a 75% discount to my blog readers if you click from here. I’m also available for consulting if you just don’t have time for that, and need to solve database performance problems quickly. You can also get a quick, low cost health check with no phone time required.

SQL Server Community Tools: Changing The Output Of sp_WhoIsActive In Different Ways

But Why?


As a procedure, sp_WhoIsActive is pretty perfect. It’s not all things to all people, but it does what it’s supposed to do really well.

One thing I really like about it is that you can change a couple things about the way it returns data to you (or to a logging table) in different ways:

  • The set of columns
  • The sorting of columns

There are definitely good uses for these options, especially when you’re beyond the “what the hell is going on here?” phase and on to the “troubleshooting a specific problem” phase.

Just as a couple examples, if you were specifically troubleshooting:

  • tempdb issues, you’d wanna sort and focus on tempdb related columns
  • blocking issues, you’d wanna sort and focus on blocking related columns

Let’s take a look at how to do that.

Focus On tempdb


If you want to focus on just what’s using a lot of tempdb without any other noise, and you want to find out what’s using the most tempdb right at the top, you can do this:

EXEC sp_WhoIsActive
    @sort_order = '[tempdb_current] DESC',
    @get_plans = 1,
    @output_column_list = '[start_time][session_id][sql_text][query_plan][wait_info][temp%]';

It will:

  • Sort the results by what currently has the most stuff in tempdb
  • Only output columns related to tempdb use with some other identifying details

What’s nice about this is that not only does it help you totally focus right in on what you care about.

And if you’re taking screenshots to document what hellish things are happening, you don’t have to spend a bunch of time editing them to cut distractions out.

Focus On Blocking


This is one I use a whole bunch when clients are hitting blocking issues.

EXEC sp_WhoIsActive
    @sort_order = '[blocked_session_count] DESC',
    @find_block_leaders = 1,  
    @get_plans = 1,
    @get_task_info = 2,
    @get_additional_info = 1,
    @output_column_list = '[start_time][session_id][sql_text][query_plan][wait_info][block%][additional_info]';

Here’s what it does:

  • Finds which queries have the most blocked sessions under them
  • Sort the results by which sessions are doing the most blocking
  • Gets additional information about the session, like isolation level, locks, etc.
  • Only outputs columns you need to see relevant blocking details

If you don’t have an extended event session set up to capture blocking and stuff like that, this is a great way to get a lot of the same information on the fly.

What You Do


There are probably other variations on this that would be useful to you at various times. These are just to get you started.

You can sort by any one of these columns:

session_id, physical_io, reads, physical_reads, writes, tempdb_allocations,

tempdb_current, CPU, context_switches, used_memory, physical_io_delta, reads_delta,

physical_reads_delta, writes_delta, tempdb_allocations_delta, tempdb_current_delta,

CPU_delta, context_switches_delta, used_memory_delta, tasks, tran_start_time,

open_tran_count, blocking_session_id, blocked_session_count, percent_complete,

host_name, login_name, database_name, start_time, login_time, program_name

Meaning, if you were troubleshooting high CPU, it might make sense to sort by that descending or something.

Thanks for reading!

Going Further


If this is the kind of SQL Server stuff you love learning about, you’ll love my training. I’m offering a 75% discount to my blog readers if you click from here. I’m also available for consulting if you just don’t have time for that, and need to solve database performance problems quickly. You can also get a quick, low cost health check with no phone time required.

SQL Server Community Tools: Using sp_WhoIsActive To Track Down Implicit Transactions

In The Annals


When people talk about bad ideas in SQL Server, implicit transactions are pretty high on the list.

I’ve talked about why in the past, but up until recently sp_WhoIsActive didn’t do much to surface queries using them.

By “not much” I mean “nothing at all”. Which isn’t to knock the procedure at all; it hasn’t quite lived long enough to become a villain.

But anyway, you should avoid implicit transactions as much as possible. They most often show up in the Microsoft JDBC driver queries that only people who hate you use.

When I first started to realize how bad they are, I wrote a bunch of checks into the Blitz scripts (I’ll cover those next week) that check for them.

I also opened an issue to add the check to sp_WhoIsActive, because it’s rather popular, I hear.

In The Actions


To see when queries are using implicit transactions, you need to do this:

EXEC sp_WhoIsActive
    @get_transaction_info = 1;

Which, I mean, seems like a rational design choice. Want information about implicit transactions? Get transaction info!

In the results, you’ll see this helpful column that will tell you if something is setting the implicit transactions property to true for a session.

SQL Server Implicit Transactions
please don’t

If you see this, burn the application down. It’s time to start fresh.

Thanks for reading!

Going Further


If this is the kind of SQL Server stuff you love learning about, you’ll love my training. I’m offering a 75% discount to my blog readers if you click from here. I’m also available for consulting if you just don’t have time for that, and need to solve database performance problems quickly. You can also get a quick, low cost health check with no phone time required.

SQL Server Community Tools: How To Use sp_WhoIsActive To Get Memory Grant Information

Woah woah woah


Up until now, I’ve written about scripts that I wrote from scratch. But they’re far from the only tools I use in my every day life.

A big one is, and always has been, sp_WhoIsActive. It’s great. You hit F5, and it tells you everything running on your server.

What more could you ask for?

In the past, I’ve written a bit about it:

And get this! It’s still under active development. It’s slow, but it happens. I’m going to spend the first couple posts this week talking about cool new features in the most recent release that I’ve been using lately.

Get It


A recent addition to sp_WhoIsActive in version 12 is collecting a bunch of memory grant information for running queries.

To get the extra details via a nifty clickable XML column, use this:

EXEC sp_WhoIsActive
    @get_memory_info = 1;

You’ll get some new top-level columns in the results that look like this:

SQL Server Memory Grants
kaboom

But you’ll also get an XML clickable column called memory_info that has much more detail in it.

When a query is running normally, the first XML fragment will look like this:

<memory_grant>
  <request_time>2022-08-25T19:05:26.663</request_time>
  <grant_time>2022-08-25T19:05:26.663</grant_time>
  <requested_memory_kb>5927872</requested_memory_kb>
  <granted_memory_kb>5927872</granted_memory_kb>
  <used_memory_kb>1833160</used_memory_kb>
  <max_used_memory_kb>1833160</max_used_memory_kb>
  <ideal_memory_kb>9573888</ideal_memory_kb>
  <required_memory_kb>4864</required_memory_kb>
  <dop>8</dop>
  <query_cost>3380.9998</query_cost>
</memory_grant>

When a query is running (or not running, depending on how you look at it) abnormally, and waiting on RESOURCE_SEMAPHORE, it will look like this:

<memory_grant>
  <request_time>2022-08-25T19:05:27.030</request_time>
  <wait_time_ms>1656</wait_time_ms>
  <requested_memory_kb>5927872</requested_memory_kb>
  <ideal_memory_kb>9573888</ideal_memory_kb>
  <required_memory_kb>4864</required_memory_kb>
  <queue_id>8</queue_id>
  <wait_order>0</wait_order>
  <is_next_candidate>1</is_next_candidate>
  <dop>8</dop>
  <query_cost>3380.9998</query_cost>
</memory_grant>

This can be really valuable information to get, similar to what sp_PressureDetector will give you.

Thanks for reading!

Going Further


If this is the kind of SQL Server stuff you love learning about, you’ll love my training. I’m offering a 75% discount to my blog readers if you click from here. I’m also available for consulting if you just don’t have time for that, and need to solve database performance problems quickly. You can also get a quick, low cost health check with no phone time required.

SQL Server Community Tools: Why Does sp_PressureDetector Make A Big Deal About The Remote DAC?

Subject Matter


I’m gonna throw this at you fast, because it’s Friday. If you’re using sp_PressureDetector in a SQL Server performance crisis, there are two things you don’t want:

  • Slow results from running diagnostic queries
  • Diagnostic queries waiting in the same CPU and memory lines as user queries

That’s why one of the first things  does is see if the Remote DAC is enabled, and urge you to turn it on, like so:

EXEC sp_configure 
    'remote admin connections', 
    1; 

RECONFIGURE;

Why bother? Well, the Remote DAC is sort of like a VIP entrance to Club SQL Server. You get your own little connection and set of resources that are unfettered by lowly user queries that are most-definitely-not-on-the-guest-list.

There are a couple caveats to being on the DAC list:

  • You have to use an admin account to access it
  • Only one person can use it at a time

So what is it, and how do you use it?

Connectivity


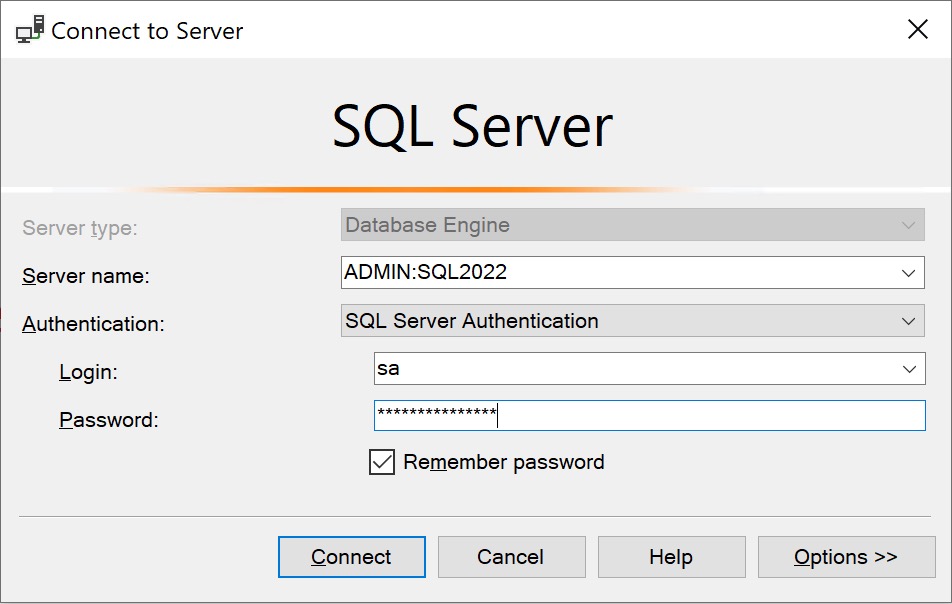
To use the DAC, all you have to do is add the prefix “ADMIN:” to your SSMS connection:

SQL Server DAC Connection SSSMS
i disconnect from you

Once that’s done, you just connect as normal and you’re good to go. There was a longstanding bug fixed recently in SSMS, where an error message would show up that said you’d not connected using the Remote DAC, even though you were.

This makes running diagnostic queries when your server is Having A Bad Day© much less prone to either adding to or being trampled by performance issues.

And also, uh, it’s just generally a good thing to have enabled for situations where you can’t connect to SQL Server in any of the normal ways, and you maybe want to try to see what the problem is rather that just crawl out of bed to restart the server.

So yeah. Good, that. Enable it.

Thanks for reading!

Going Further


If this is the kind of SQL Server stuff you love learning about, you’ll love my training. I’m offering a 75% discount to my blog readers if you click from here. I’m also available for consulting if you just don’t have time for that, and need to solve database performance problems quickly. You can also get a quick, low cost health check with no phone time required.

SQL Server Community Tools: sp_PressureDetector Doesn’t Show You Irrelevant Waits

Which Wait Did They Go?


I tried to really focus sp_PressureDetector on things that really matter to overall SQL Server performance, and specifically related to CPU and memory pressure.

It seemed easier to include rather than exclude waits, since the list always seems to keep growing. I also wanted to include a little decoder ring to help you understand what each wait means.

  • CMEMTHREAD: Tasks waiting on memory objects
  • CXCONSUMER: Parallelism
  • CXPACKET: Parallelism
  • CXSYNC_CONSUMER: Parallelism
  • CXSYNC_PORT: Parallelism
  • PAGEIOLATCH_EX: Modifications reading pages from disk into memory
  • PAGEIOLATCH_SH: Selects reading pages from disk into memory
  • RESOURCE_SEMAPHORE: Queries waiting to get memory to run
  • RESOURCE_SEMAPHORE_QUERY_COMPILE: Queries waiting to get memory to compile
  • SOS_SCHEDULER_YIELD: Query scheduling
  • THREADPOOL: Worker thread exhaustion

I know this seems really limited, but… Uh. What else would you want, here? I could show locking waits, but they aren’t really related to CPU or memory pressure.

Sure, if enough (probably parallel) queries get blocked, it can lead to THREADPOOL waits, but if that’s the cause then you’ll see all the blocking going on in the running queries results.

Seeing a bunch of lock waits up front is just a distraction from the CPU and memory pressure issues I’m trying to surface, and there’s really nothing specifically hardware related to fixing locking problems.

But anyway, if you feel like there are relevant waits missing from the list, feel free to leave a comment or open an issue on GitHub.

Going Further


If this is the kind of SQL Server stuff you love learning about, you’ll love my training. I’m offering a 75% discount to my blog readers if you click from here. I’m also available for consulting if you just don’t have time for that, and need to solve database performance problems quickly. You can also get a quick, low cost health check with no phone time required.

SQL Server Community Tools: sp_PressureDetector Shows You Running Queries Taking Up CPU And Memory

One For The Money


This post describes a little more of the philosophy behind sp_PressureDetector more than anything technical about it. Maybe.

I write this at the outset, but who knows where it’ll end up. Might even delete the whole thing and look at expensive cheese.

ANYWAY! If you’ve been following my posts this week, you’ll be painfully aware that sp_PressureDetector looks at things in your SQL Server that could indicate CPU or memory pressure.

Of course, very few servers will experience either of those issues without queries running, and so my dear friend sp_PressureDetector will show you which queries are in the danger zone.

And since it may be different queries causing problems, I show you two different sets of queries in two different ways.

Two For The Memory


The memory grant section shows you queries ordered by highest current memory grant. It will show you stuff you’re accustomed to, like session id, database, query text, query plan, and all that stuff, but it’ll also break down important stuff about what’s going on with memory.

SQL Server Memory Grant Query
fourquery

There are four queries running on my demo VM. Three of them asked for and received memory grants, but one of them didn’t!

  • The first three queries have all requested and been granted memory and are slowly using it
  • The fourth query hasn’t gotten a grant yet, but is sitting in a queue waiting for memory to free up

While that fourth query waits for memory, it’s sitting around on RESOURCE_SEMAPHORE.

You may not always see this happening, but even without hitting the global limit for memory grants, you can still get pretty valuable data about queries running asking for memory.

Three To Get CPU Ready


Just like the memory grant query output, the CPU section will show you familiar and helpful columns to identify and analyze the query, but the section that will show you which ones are chewing up CPU is here:

SQ: Server CPU Query
fivequery

In this cap, there are five queries running (all of them are parallel). You can see associated waits, cpu time, elapsed time, and other resource usage.

You can also see just how parallel a query went. Because there is only one “branch” in this query plan, DOP and parallel worker count are equal. In larger plans, worker count can be a multiple of DOP.

SQL Server Parallel Query Plan
woah mama

In this query plan, there are four parallel exchanges, which means four branches, so we get four x dop 8 parallel worker threads, totaling 32. Only 8 can be active concurrently, but all 32 are reserved by the query until it completes

On really overworked servers, SQL Server will downgrade DOP to preserve worker threads. Screenshots don’t really do that justice, but I demo it at the main page for sp_PressureDetector in the video.

Thanks for reading!

Going Further


If this is the kind of SQL Server stuff you love learning about, you’ll love my training. I’m offering a 75% discount to my blog readers if you click from here. I’m also available for consulting if you just don’t have time for that, and need to solve database performance problems quickly. You can also get a quick, low cost health check with no phone time required.

SQL Server Community Tools: Detecting Memory Pressure In SQL Server With sp_PressureDetector

Sponsor


People are always surprised by how SQL Server uses, and misuses, memory. First, there are misconceptions about how much memory Standard Edition can use — everyone thinks it’s 128GB — but that’s just for the buffer pool.

Sometimes they have no idea that…

  • SQL Server caches data pages in memory (buffer pool)
  • SQL Server doesn’t work with pages on disk (except to read them into memory)
  • SQL Server queries can ask for TONS of memory that gets pulled from the buffer pool
  • SQL Server uses memory to manage other things, like locks, caching query plans, compressed backups, and more

So that’s the type of stuff that I thought would be good to expose with sp_PressureDetector.

To look at just memory stuff with it, run this:

EXEC sp_PressureDetector
    @what_to_check = 'memory';

Simple as.

Trudging


When SQL Server is under memory pressure, it can show up in a few different places, just like CPU pressure.

SQL Server Wait Stats
lucky strike

The arrows are pointing to two wait types that are directly related to queries waiting on memory. Read the description column for more detail ;^}

But that’s not the whole story, because like I said above, SQL Server uses memory for a bunch of stuff. If there’s memory pressure on the server, you’ll also see SQL Server having to go out to disk a whole bunch.

SQL Server Wait Stats
human mind

Stolen


SQL Server surfaces what things are consuming memory, too. I show that early on in the results.

SQL Server Buffer Pool
gulf

My server isn’t very busy at the moment, so these numbers are fairly low, but this gives you a pretty good breakdown of:

  • How much memory is dedicated to the buffer pool
  • How much memory is stolen from the buffer pool
  • How much memory other consumers are taking up

You can match some of that up with other results that get returned that show more detail on query memory grants:

SQL Server Semaphores
indeed

It doesn’t match exactly because there’s a little time between when each query runs, but the granted_memory and used_memory columns are close-enough to the MEMORYCLERK_SQLQERESERVATIONS and Stolen Server Memory (KB) lines in the other results shown here.

If you’re paying really close attention, you may notice that 17GB of memory has been given to three queries, and 197 queries are waiting on memory.

In tomorrow’s post, we’ll look at how sp_PressureDetector surfaces queries that are most likely involved in CPU and memory pressure.

Thanks for reading!

Going Further


If this is the kind of SQL Server stuff you love learning about, you’ll love my training. I’m offering a 75% discount to my blog readers if you click from here. I’m also available for consulting if you just don’t have time for that, and need to solve database performance problems quickly. You can also get a quick, low cost health check with no phone time required.