Why Some Types of Parallel Scans can be Slow on Cloud Storage

Upon reading the title, you may be thinking that of course parallel scans will be slow in the cloud. Cloud storage storage simply isn’t very fast. I would argue that there’s a bit more to it.

The Timeout

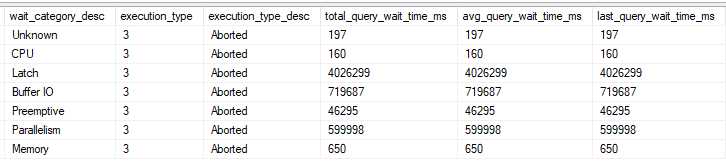
A query timed out the other day in production after running for 600 seconds. Of note, one of the tables used by the stored procedure is in a database with data files hosted by Azure blob storage. I grabbed the wait stats for the timed out query using query store:
a56 qs waits

According to the documentation, the latch category maps to LATCH_% wait types and the preemptive category maps to PREEMPTIVE_% wait types. I wasn’t able to reproduce the timeout when executing the same query text, even if I forced the exact same query plan with a USE PLAN. Admittedly, I was puzzled by the wait stats distribution for a while.

Decoding the Categories

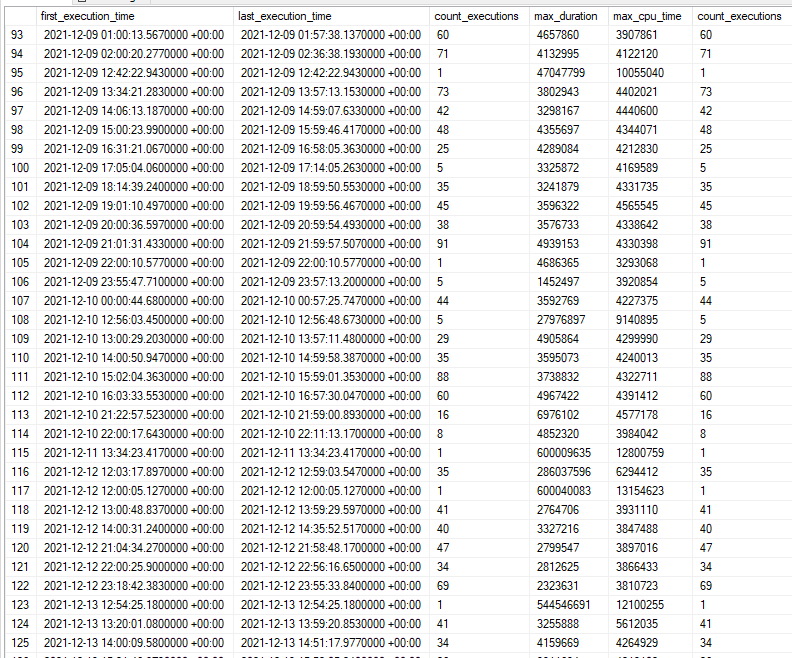
I eventually realized that typically the first execution of the stored procedure for the business day tended to be the slowest. Sorting query store runtime DMV results by time:
qs by time

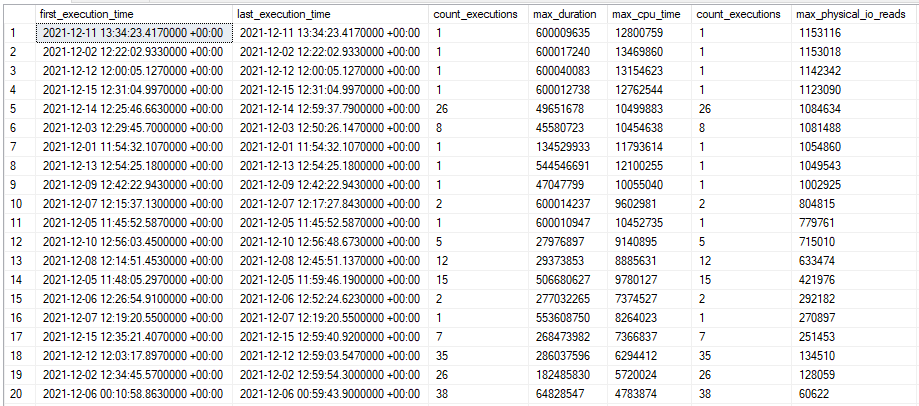
I also noticed that the timed out executions tended to have higher physical I/O than the other executions. Sorting query store runtime DMV results by I/O:
qs by io

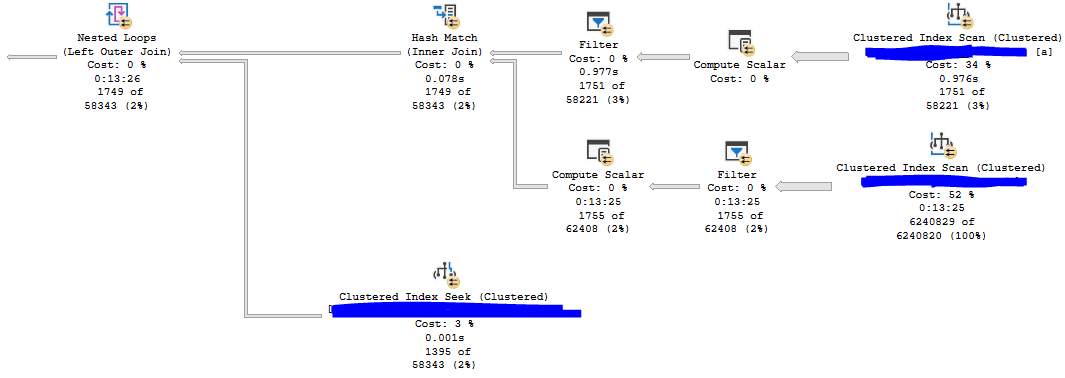
I now finally had a method to reproduce the poor performance of the stored procedure: being the first one to run the code in the morning, presumably when the buffer pool didn’t have anything helpful for this stored procedure. Early in the morning, I was able to capture an actual plan that took 13 minutes at MAXDOP 8. Nearly all of the execution time is spent on an index scan for a table that is hosted on cloud storage:
a56 actual azure

Here are the top wait stats from the actual plan:

<Wait WaitType=”LATCH_EX” WaitTimeMs=”5423928″ WaitCount=”1971″ />
<Wait WaitType=”PAGEIOLATCH_SH” WaitTimeMs=”977288″ WaitCount=”29210″ />
<Wait WaitType=”CXPACKET” WaitTimeMs=”809678″ WaitCount=”700″ />
<Wait WaitType=”PREEMPTIVE_HTTP_REQUEST” WaitTimeMs=”43801″ WaitCount=”50344″ />

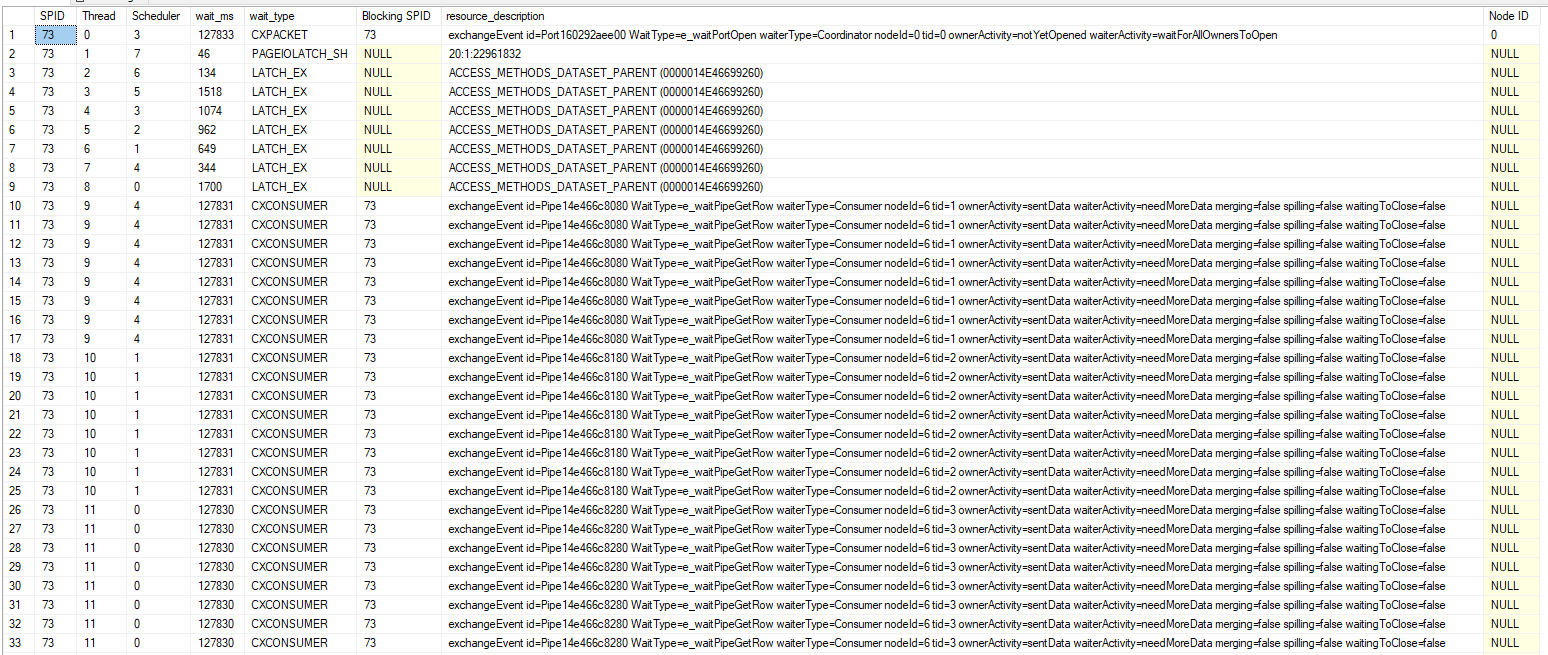
I used the task DMVs during query execution to get information about the latch type:
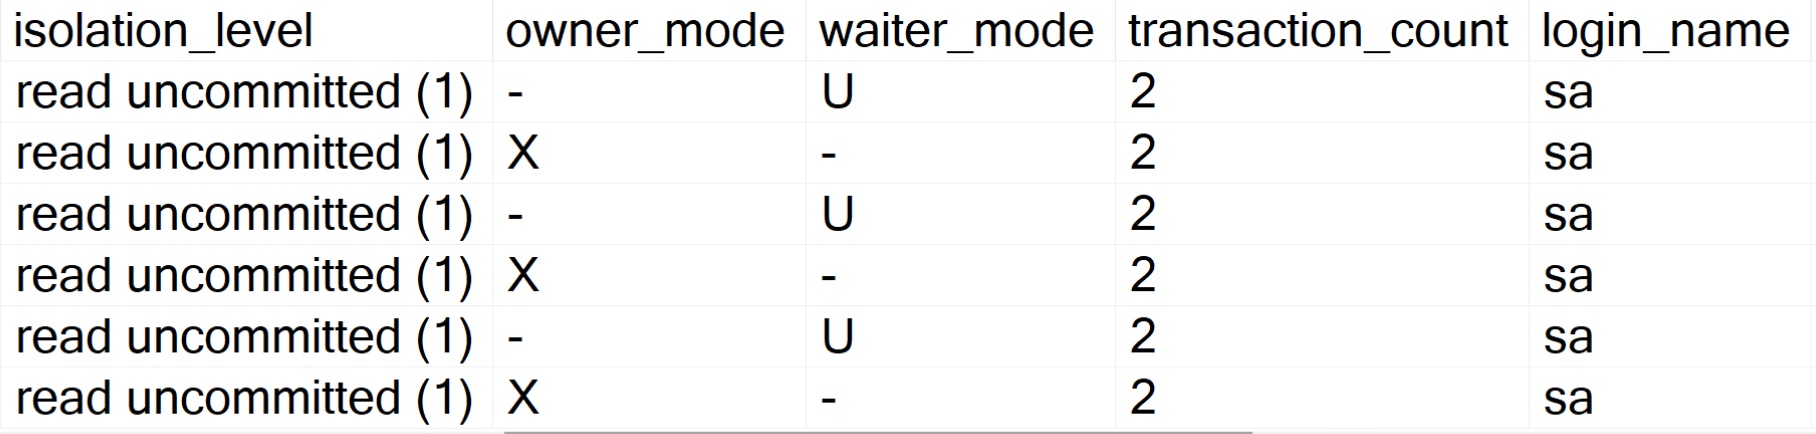
a56 tasks


Now I know that the query spends most of its time trying to acquire exclusive latches of the ACCESS_METHODS_DATASET_PARENT type. There is also a fair amount of I/O wait time compared to the mysterious PREEMPTIVE_HTTP_REQUEST wait type.

The ACCESS_METHODS_DATASET_PARENT Latch

I asked the community if this latch was considered to be interesting. The winning option was “What?”. As usual, twitter is useless:

a56 twitter

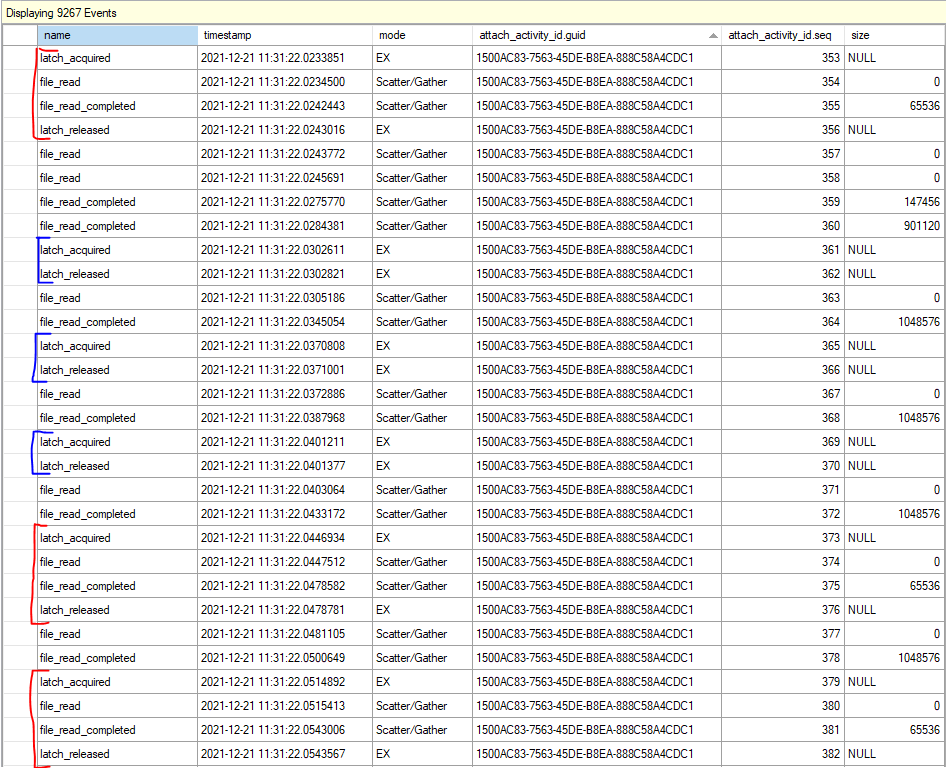
For my query, at times I observed seven out of eight worker threads all waiting for an exclusive latch at the same time. This isn’t surprising considering that the query averaged 6.7 LATCH_EX wait seconds per second. That the other thread was doing an I/O wait while the others were waiting for the latch, so perhaps the worker threads were doing I/Os while holding the latch resource. On a development environment (with unfortunately significantly better I/O), I mocked up a roughly similar table and enabled the latch_acquired, latch_released, file_read, and file_read_completed extended events. The results were quite educational:
a56 red blue 1

There were two different patterns in the XE files. Sometimes the worker threads would acquire the latch, perform one or more I/Os, and release the latch. Otherwise they would acquire the latch and quickly release it without performing any I/Os. Paul Randal recently wrote the following about this latch:

When either a heap or an index is being accessed, internally there’s an object called a HeapDataSetSession or IndexDataSetSession, respectively. When a parallel scan is being performed, the threads doing the actual work of the scan each have a “child” dataset (another instance of the two objects I just described), and the main dataset, which is really controlling the scan, is called the “parent.”

When one of the scan worker threads has exhausted the set of rows it’s supposed to scan, it needs to get a new range by accessing the parent dataset, which means acquiring the ACCESS_METHODS_DATASET_PARENT latch in exclusive mode. While this can seem like a bottleneck, it’s not really, and there’s nothing you can do to stop the threads performing a parallel scan from occasionally showing a LATCH_EX wait for this latch.

At a very high level, I suspect that the fast latch releases (marked in blue in the above picture) occur when the worker thread can acquire an already available range of rows from the parent object. The slow latch releases (marked in red) occur when the worker thread tries to acquire a new range, can’t find one, and has to perform I/Os to add more ranges to the parent object. In both cases the parent object needs to be modified, so an exclusive latch is always taken. I don’t know how it actually works behind the scenes, but the theory matches the observed behavior.

In summary, the query does a parallel scan which is protected by the ACCESS_METHODS_DATASET_PARENT latch. The table getting scanned is hosted on cloud storage with high I/O latency. Latency being high contributes to the exclusive latch on ACCESS_METHODS_DATASET_PARENT getting held for a long time which can block all of the other parallel worker threads from proceeding.

The PREEMPTIVE_HTTP_REQUEST Wait Type

I already have enough information to be confident in a query tuning fix for the stored procedure, but for completeness, I also investigated the PREEMPTIVE_HTTP_REQUEST wait type. I was not able to find any useful documentation for this wait type. The official documentation only says “Internal use only.” Thanks, Microsoft.

A common technique to learn more about undocumented waits is to get callstacks associated with the wait type. I’ve seen the PREEMPTIVE_HTTP_REQUEST wait occur in Azure SQL databases, Azure SQL Managed Instances, and for databases hosted in Azure blob storage. It is possible to get callstacks for managed instances, but it is not possible to translate them because Microsoft does not release public symbols for managed instances. However, the blob storage scenario did allow me to get and translate call stacks for the wait. Below are a few of the stacks that I captured:

Performing I/Os to read data not in the buffer pool:

sqldk!XeSosPkg::wait_info_external::Publish
sqldk!SOS_Task::PushWait
sqlmin!SOS_Task::AutoSwitchPreemptive::AutoSwitchPreemptive
sqlmin!BlobAccess::AsyncHttpIOInternal
sqlmin!BlobAccess::AsyncIOInternal
sqlmin!XFCB2::ScatterReadInternal
sqlmin!FCB::ScatterRead
sqlmin!RecoveryUnit::ScatterRead
sqlmin!BPool::GetFromDisk
sqlmin!BPool::Get
sqlmin!BlobBase::FixNode
sqlmin!BlobManager::LocateBlob
sqlmin!BlobManager::OpenInternal
sqlmin!BlobManager::Open
sqlmin!LockBytesSS::Open
sqlmin!OpenLockBytesNew
sqlmin!OpenIlbssWithSeLobHandleRO
sqlmin!IndexDataSetSession::OpenStreamWithSeLobHandle
sqlmin!RowsetNewSS::OpenWithSeLobHandle
sqlmin!CBlobHandleBaseTableFactory::PilbGet
sqlTsEs!CompareLegacyLobNull
sqlTsEs!CTEsCompare<35,35>::BlCompareXcArgArgImpl
sqlTsEs!CEsExec::GeneralEval4
sqlmin!CQScanStreamAggregateNew::GetRowHelper

Writing LOB data to disk:

sqldk!XeSosPkg::wait_info_external::Publish
sqldk!SOS_Task::PushWait
sqlmin!SOS_Task::AutoSwitchPreemptive::AutoSwitchPreemptive
sqlmin!BlobAccess::AsyncHttpIOInternal
sqlmin!BlobAccess::AsyncIOInternal
sqlmin!XFCB2::ScatterReadInternal
sqlmin!FCB::ScatterRead
sqlmin!RecoveryUnit::ScatterRead
sqlmin!BPool::GetFromDisk
sqlmin!BPool::Get
sqlmin!BlobBase::FixNode
sqlmin!Blob::RWBlob
sqlmin!Blob::RWBlob
sqlmin!Blob::ReadWriteAt
sqlmin!BlobManager::ReadAtInternal
sqlmin!BlobManager::ReadAt
sqlmin!LockBytesSS::ReadAt
sqllang!write_LOB_chunked
sqllang!`anonymous namespace’::TSendRowClassNoCount<7,0>::TSendUnlimitedVartype<0>
sqllang!CTds74::SendRowImpl
sqlTsEs!CEsExec::GeneralEval
sqllang!CXStmtQuery::ErsqExecuteQuery
sqllang!CXStmtSelect::XretExecute
sqllang!CMsqlExecContext::ExecuteStmts<1,1>

Transaction log writes:

sqldk!XeSosPkg::wait_info_external::Publish
sqldk!SOS_Scheduler::UpdateWaitTimeStats
sqldk!SOS_Task::PopWait
sqlmin!SOS_ExternalAutoWait::~SOS_ExternalAutoWait
sqlmin!SOS_Task::AutoSwitchPreemptive::~AutoSwitchPreemptive
sqlmin!BlobAccess::AsyncHttpIOInternal
sqlmin!BlobAccess::AsyncIOInternal
sqlmin!XFCB2::AsyncWriteInternal
sqlmin!FCB::AsyncWrite
sqlmin!SQLServerLogMgr::FlushLCOld
sqlmin!SQLServerLogMgr::LogWriter
sqldk!SOS_Task::Param::Execute
sqldk!SOS_Scheduler::RunTask
sqldk!SOS_Scheduler::ProcessTasks
sqldk!SchedulerManager::WorkerEntryPoint
sqldk!SystemThreadDispatcher::ProcessWorker
sqldk!SchedulerManager::ThreadEntryPoint
KERNEL32.DLL+0x0000000000017974
ntdll.dll+0x000000000006A271

I’m guessing this one is renewing the lease as noted in the documentation: “the implementation of SQL Server Data Files in Azure Storage feature requires a renewal of blob lease every 45 to 60 seconds implicitly”

sqldk!XeSosPkg::wait_info_external::Publish
sqldk!SOS_Task::PushWait
sqlmin!SOS_Task::AutoSwitchPreemptive::AutoSwitchPreemptive
sqlmin!BlobAccess::AsyncHttpIOInternal
sqlmin!BlobAccess::AsyncIOInternal
sqlmin!LeaseRenewalManager2::RenewLeases
sqlmin!XStoreLeaseRenewalTask2
sqldk!SOS_Task::Param::Execute
sqldk!SOS_Scheduler::RunTask
sqldk!SOS_Scheduler::ProcessTasks
sqldk!SchedulerManager::WorkerEntryPoint
sqldk!SystemThreadDispatcher::ProcessWorker
sqldk!SchedulerManager::ThreadEntryPoint

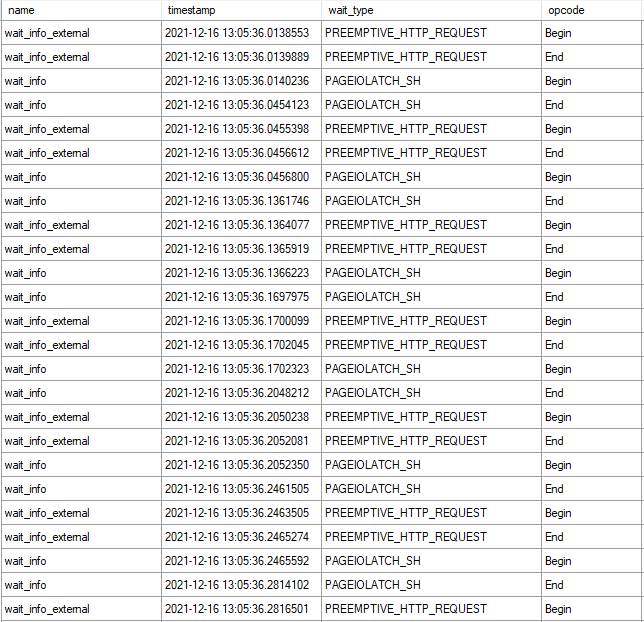
Not surprisingly, all of them have to do with accessing azure storage. I was able to observe an interesting pattern during a table scan: every PAGEIOLATCH_SH wait was immediately preceded by a PREEMPTIVE_HTTP_REQUEST wait.
Getting stacks for the waits that are close together, with shared code removed and the I/O wait on top with the preemptive wait on the bottom:

sqldk!XeSosPkg::wait_info::Publish
sqldk!SOS_Task::PreWait
sqldk!WaitableBase::Wait
sqlmin!LatchBase::Suspend
sqlmin!LatchBase::AcquireInternal
sqlmin!BUF::AcquireLatch
sqlmin!BPool::Get
<<SHARED STACKS REMOVED>>

sqldk!XeSosPkg::wait_info_external::Publish
sqldk!SOS_Task::PushWait
sqlmin!SOS_Task::AutoSwitchPreemptive::AutoSwitchPreemptive
sqlmin!BlobAccess::AsyncHttpIOInternal
sqlmin!BlobAccess::AsyncIOInternal
sqlmin!XFCB2::ScatterReadInternal
sqlmin!FCB::ScatterRead
sqlmin!RecoveryUnit::ScatterRead
sqlmin!BPool::GetFromDisk
sqlmin!BPool::Get
sqlmin!BlobBase::FixNode
sqlmin!BlobManager::LocateBlob
sqlmin!BlobManager::OpenInternal
sqlmin!BlobManager::Open
sqlmin!LockBytesSS::Open
sqlmin!OpenLockBytesNew
sqlmin!OpenIlbssWithSeLobHandleRO
sqlmin!IndexDataSetSession::OpenStreamWithSeLobHandle
sqlmin!RowsetNewSS::OpenWithSeLobHandle
sqlmin!CBlobHandleBaseTableFactory::PilbGet
sqlTsEs!CompareLegacyLobNull

My understanding is that SQL Server makes an HTTP request to the blob storage in preemptive mode in order to queue an asynchronous I/O. The preemptive wait ends and the PAGEIOLATCH_SH wait begins shortly after. The traditional I/O wait ends when the I/O is received by SQL Server. That’s just a guess though.

I think a reasonable summary is that you should expect to see PREEMPTIVE_HTTP_REQUEST waits if you’re performing I/O against Azure storage. They are a normal part of SQL Server’s operations.

Reducing ACCESS_METHODS_DATASET_PARENT Latch Wait Time

In some situations, a query that is slow due to I/O performance can run faster with a higher DOP. Instead of one thread waiting for I/O you can have many threads waiting and overall runtime will decrease. Of course, this won’t work in all scenarios, such as if you’re hitting an IOPs limit. For my scenario, the DOP 8 query had 6.7 LATCH_EX wait seconds per second of runtime. Latch contention is so bad that it nearly steals all of the theoretical benefits achieved with query parallelism.

The obvious solution is to reduce the amount of I/O that is done by the query. That is what was indeed done to resolve the production issue. Another obvious solution is to improve I/O performance. More on that in the next section. However, in some cases the query may simply need to scan a lot of data and you can’t do anything about storage performance. In that situation, it may sometimes be practical to change the type of parallel scan performed by SQL Server.

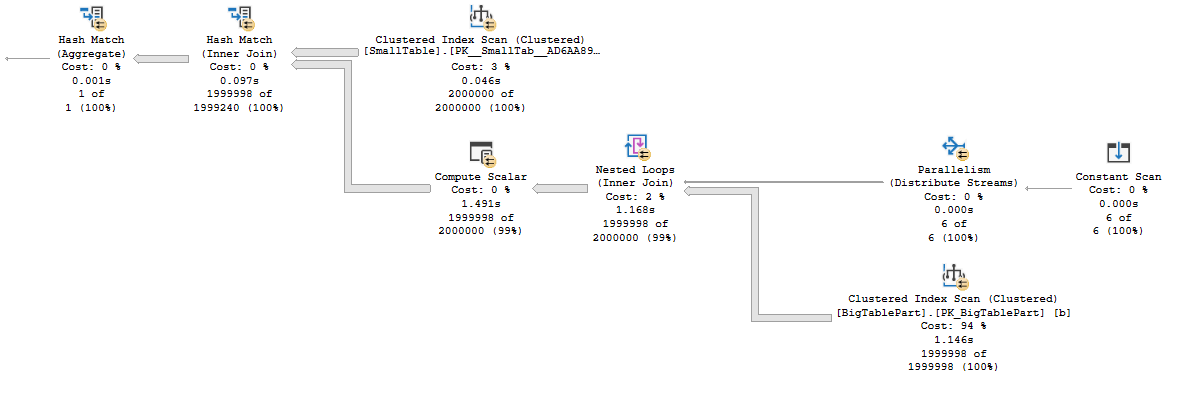
Consider the following parallel plan against a partitioned table on the probe side:
a56 part

For clarity, here is what the T-SQL looks like:

SELECT SUM(Case WHEN OffPageFiller IS NOT NULL THEN 1 ELSE 0 END)
FROM (
      VALUES (1),(2),(3),(4),(5),(6)
) v(v)
CROSS APPLY(
       SELECT OffPageFiller
       FROM dbo.SmallTable s
       INNER JOIN dbo.BigTablePart b ON s.JoinId = b.JoinId
       WHERE b.PartId = v.v
) q;

Each thread of the parallel nested loop operator gets assigned an entire partition and reads all of the data for that partition. There is no longer a need for the ACCESS_METHODS_DATASET_PARENT latch because the shared state between worker threads has been removed. I checked using extended events and found that the ACCESS_METHODS_DATASET_PARENT latch wait count was significantly decreased as expected. I suspect that the remaining latch acquisitions were from the hash build side scan. This type of access pattern requires a partitioned table, can be a pain to express in T-SQL, and may not work well if partitions are unevenly sized or if there aren’t enough partitions compared to DOP to get good demand-based distribution.

Perhaps a more reasonable option is to switch to columnstore instead. The query will do less I/O and I assume that the latch pattern is quite different, but I didn’t test this. Testing things in the cloud costs money. Maybe I should start a Patreon.

Reducing PREEMPTIVE_HTTP_REQUEST Wait Time

As I said earlier, I believe that seeing this wait is normal if you’re using azure storage. In my limited experience with it, any noticeable wait time was always tied to even longer PAGEIOLATCH waits. Tuning the query using traditional methods to reduce I/O wait time was always sufficient and I never had a need to specifically focus on PREEMPTIVE_HTTP_REQUEST. However, if you really need to focus on this wait type in particular for some reason, I’ll theorize some ways to reduce it:

  1. For all platforms, reduce I/O performed by the query using query tuning, schema changes, and so on.
  2. For managed instances, move your I/O from user databases to tempdb (it uses locally attached storage).
  3. For azure blob storage databases, make sure that you are using the right geographical region for your storage.

Here are a few more options which may not specifically reduce PREEMPTIVE_HTTP_REQUEST wait time but may improve I/O performance overall:

  1. For managed instances and azure blob storage databases, try increasing the size of your data files.
  2. For managed instances, try increasing the number of data files.
  3. For all platforms, switch to a more expensive tier of storage.

Final Thoughts

The query timed out in production because it performed a large parallel scan against a table that had little to no data in the buffer pool. PAGEIOLATCH waits were not the dominant wait type due to high latency from Azure blob storage. That high latency caused latch contention on the ACCESS_METHODS_DATASET_PARENT latch. My parallel scan was slow because cloud storage isn’t very fast. Maybe it isn’t so complicated after all?
Software Vendor Mistakes With SQL Server: Modifying Millions of Rows At A Time

But Why?


I often see people get stuck hard by this. Even worse, it happens when they’re using a merge statement, which are like throwing SQL Server a knuckleball.

It has no idea what it might have to do with your merge — insert? update? delete? — so it has to prepare a plan for any of them that you specify.

Just don’t use merge, okay? If you take one thing from this whole series: please don’t use merge.

Okay, anyway, back to the point: large modifications can suck in a few different ways.

Locking:

The whole time those big modifications are running, other queries are gonna get blocked. Even with NOLOCK/UNCOMMITTED hints, other modification queries can get stuck behind them. Wanna make users feel some pain? Have your app be unusable for big chunks of time because you refuse to chunk your modifications. Worse, if enough queries get backed up behind one of these monsters, you can end up running out of worker threads, which is an even worse performance issue.

Transaction Logging:

The more records you need to change, the more transaction logging you have to do. Even in simple recovery, you log the same amount of changes here (unless your insert gets minimal logging). A lot of people think simple recovery means less logging, but no, it just means that SQL Server manages the transaction for you. This’ll get worse as you add more indexes to the table, because change for each of them are logged separately.

Query Performance:

The modification part of any update or delete happens single-threaded. Other parts of the query plan might go parallel, but the actual modification portion can’t. Getting a few million rows ready on a bunch of threads simultaneously might be fast, but then actually doing the modification can be pretty slow. You have to gather all those threads down to a single one.

Lock Escalation:

It goes without saying that large modifications will want object-level locks. If there are incompatible locks, they may end up blocked. If they started by taking row or page locks, and tried to escalate to an object level lock but couldn’t, you could end up gobbling up a whole lot of your lock memory, which is a finite resource. Remember, there’s no escalation or transition between row and page locks. This is another place where having a lot of indexes hanging around can hurt.

Buffer Pool Pollution:

If you’re the type of person who isn’t regularly declutter your indexes, it’s likely that you have a bunch of indexes that either don’t get used anymore, only rarely get used, or are duplicative of other indexes defined on a table. Just like with transaction logging an lock escalation, the more indexes you have around, the more of them you need to read up into SQL Server’s buffer pool to modify them. SQL Server doesn’t work with pages on disk.

Double Dollars


How fast these queries run will be partially be dictated by:

  • How much memory you have
  • How fast your disks are
  • How fast your storage networking is

There are other factors too, like the type of data you’re changing. Changing MAX data types has way more overhead than more reasonable ones, or even shorter strings.

Thanks for reading!

Going Further


If this is the kind of SQL Server stuff you love learning about, you’ll love my training. Blog readers get 25% off the Everything Bundle — over 100 hours of performance tuning content. Need hands-on help? I offer consulting engagements from targeted investigations to ongoing retainers. Want a quick sanity check before committing to a full engagement? Schedule a call — no commitment required.

Software Vendor Mistakes With SQL Server: Not Using An Optimistic Isolation Level

The Champ Is Here


For developers who have worked with, or who write applications that work across multiple database platforms, working with SQL Server can often be a jarring experience.

Problems that you don’t face on products that use Multi-Version Concurrency Control by default are all of a sudden the bane of your existence.

But of course, for developers who only work with SQL Server, the innate fear of commitment is one of the first things they learn.

SQL Server has two options for this that I’ve blogged about before. Head over here if you need background.

A lot of the reasoning for not using an optimistic isolation level that I’ve heard from people over the years just doesn’t hold up well anymore.

Excusify


Let’s talk through some of them.

We’re worried about tempdb contention from the additional row versioning going up there

That’s fair, but if you don’t currently have tempdb contention, it’s unlikely that it’s going to body slam you unless your application currently has problems with:

  • Modifying huge chunks of data at once (not counting inserts)
  • Long running modification transactions
  • Implicit transactions that don’t always commit
  • Updating a lot of LOB data all the time

Most people don’t have such severe problems with that stuff that things go pear shaped from the version store. When tempdb is properly set up, it can take a pretty good beating before you see the type of contention that causes performance issues.

On top of that, the version store and other temporary objects don’t use exactly the same structures in tempdb.

  • In SQL Server 2019 and up where the local version store in use by Accelerated Database Recovery is used instead of tempdb
  • In all prior releases, the row versions are sent to special append-only storage units which aren’t governed or exposed by normal system views, nor do they generate transaction log record. Those units may contain many rows, and are cleaned up in at the unit level, not the row level.
  • Online index rebuilds use a separate version store from the one used by triggers, updates, deletes, MARS, etc.

We’re worried about tempdb growing out of control from the version store

Sure, you increase the risk surface area for long running modifications/transactions creating this situation, but either of those things would cause a pretty big headache if they happened without an optimistic isolation level enabled.

I’ve seen plenty of people end up there, do something goofy like kill the long running modification without looking at how much work it had done, and then get stuck in an even longer running rollback.

And guess what? Restarting SQL Server doesn’t fix it. Accelerated Database Recovery is helpful for that, if you’re on SQL Server 2019+, but that probably ain’t you.

The “good” news is that if tempdb runs out of space, SQL Server will start shrinking the version store.

We want our product to work out of the box, and SQL Server’s tempdb needs additional configuration to handle load

Boy, have I got news for you from 2016:

  • Trace flag 1117 is the default behavior
  • Trace flag 1118 is the default behavior
  • The setup GUI lets you create multiple data files
  • The setup GUI lets you turn on instant file initialization

If that setup doesn’t keep tempdb woes at bay from enabling an optimistic isolation level, it might be your fault.

We can’t test all our code to see if there will be race conditions with optimistic locking

I hate this, because it says to me that you don’t know your own code base well enough to know if you rely on locking to queue things, etc. It’s also a very lazy because…

I see you using gobs of NOLOCK hints everywhere. You’re not gonna get the right results for that type of code, anyway. Why be afraid of working with the last known good version of a row?

If you’re doing something like generating sequences, and you’re using a homegrown sequence table instead of the sequence objects that SQL Server has had since 2012, I question your sanity.

I mean, unless you’re using the code in the post I linked. Then you’re the coolest and smartest.

Thanks for reading!

Going Further


If this is the kind of SQL Server stuff you love learning about, you’ll love my training. Blog readers get 25% off the Everything Bundle — over 100 hours of performance tuning content. Need hands-on help? I offer consulting engagements from targeted investigations to ongoing retainers. Want a quick sanity check before committing to a full engagement? Schedule a call — no commitment required.

Software Vendor Mistakes With SQL Server: Mistaking NOLOCK For Concurrency

Corner Boppin’


I totally understand the Cult Of NOLOCK. Blocking sucks. Fixing it is annoying. Read Committed is a garbage isolation level.

Then along comes some beleaguered colleague who whispers the magic incantation into your ear, and suddenly those problems go away. A week later you have a keyboard shortcut that inserts WITH (NOLOCK) programmed into SSMS and your muscle memory.

You’ve probably already read a thousand and one blog posts about what a bad idea NOLOCK is, too. But you’ve just never had a problem with it, whether it’s dirty reads or errors.

And besides, no one actually knows if data is correct anyway. Have you seen data? Quite a mess. If it looks weird, just run it again.

You read something scary about optimistic isolation levels twenty years ago. Why change now?

Try Harder


Let’s look at where all your NOLOCK-ing won’t save you.

CREATE TABLE
    dbo.beavis
(
    id int PRIMARY KEY, 
    heh datetime
);

CREATE TABLE
    dbo.butthead
(
    id int PRIMARY KEY, 
    huh datetime
);

INSERT 
    dbo.beavis
    (id, heh)
VALUES
    (1, GETDATE());

INSERT
    dbo.butthead
    (id, huh)
SELECT
    b.id, 
    b.heh
FROM dbo.beavis AS b;

Here’s the most common deadlock scenario I see:

/*Player one*/
BEGIN TRAN

    SET TRANSACTION ISOLATION LEVEL
        READ UNCOMMITTED;
    
    UPDATE b
        SET b.heh = GETDATE()
    FROM dbo.beavis AS b WITH(NOLOCK);
    
    /*Stop running here until you run 
      the other session code, then come 
      back and run the next update*/
    UPDATE b
        SET b.huh = GETDATE()
    FROM dbo.butthead AS b WITH(NOLOCK);

ROLLBACK;

And then:

/*Session two*/
BEGIN TRAN

    SET TRANSACTION ISOLATION LEVEL
        READ UNCOMMITTED;
    
    UPDATE b
        SET b.huh = GETDATE()
    FROM dbo.butthead AS b WITH(NOLOCK);
    
    UPDATE b
        SET b.heh = GETDATE()
    FROM dbo.beavis AS b WITH(NOLOCK);
    /*Stop running here*/

ROLLBACK;

Cautious Now


If you go look at the deadlocks that get produced by these queries, you’ll see something that looks like this:

SQL Server Locking Deadlocks
pies

Despite the isolation level being read uncommitted and us festooning NOLOCK hints all about the place, we still end up with deadlocks.

Using these hints doesn’t always help with concurrency issues, and this goes for many other situations where locking and blocking has to occur.

At best, your select queries will be able to read dirty data rather than get blocked. I’m way more in favor of using an optimistic isolation level, like Read Committed Snapshot Isolation. All NOLOCK really means is that your query doesn’t respect locks taken by other queries.

Thanks for reading!

Going Further


If this is the kind of SQL Server stuff you love learning about, you’ll love my training. Blog readers get 25% off the Everything Bundle — over 100 hours of performance tuning content. Need hands-on help? I offer consulting engagements from targeted investigations to ongoing retainers. Want a quick sanity check before committing to a full engagement? Schedule a call — no commitment required.

Software Vendor Mistakes With SQL Server: Selecting Everything From Everywhere

Proble-Matic


It seems that most developers are either too naive or too lazy to choose just the columns that they need to satisfy a particular requirement, and so their ORM queries end up doing the equivalent of SELECT *from every table involved in the query.

I have seen some worthwhile uses for this, where people would select all the data that they needed to only make one round trip to the server rather than 5 or more. In those cases, it’s okay to break the rule, especially if the query is a Heavy Hitter™.

But this can end up causing all sorts of problems with queries. Back in the Oldenn Dayes of the internet, you’d find people talking about the overhead of metadata lookups and blah blah.

I’m sure there’s some tiny amount, but that’s hardly worth talking about in light of the other, more serious issues that you’ll encounter.

Memory Grants


Memory grants come into play most commonly when you need to Sort or Hash data in a query plan. There are some other cases, like Optimized Nested Loops, and columnstore inserts, but those are somewhat less common.

Memory grants can get really thrown off by a couple things: cardinality misestimations, and string columns. Right now, the optimizer makes a guess that every row in the column is “half full”. That means whatever the byte length of your column is.

For instance:

  • varchar(100): 50 bytes
  • nvarchar(100): 100 bytes

The wider your columns get, the bigger your memory grants get. That becomes a bigger deal on servers that are starving for memory, because those grants can really eat up a lot of memory that you need for other stuff, like caching data or query plans.

Some Columns Are Bigger Than Others


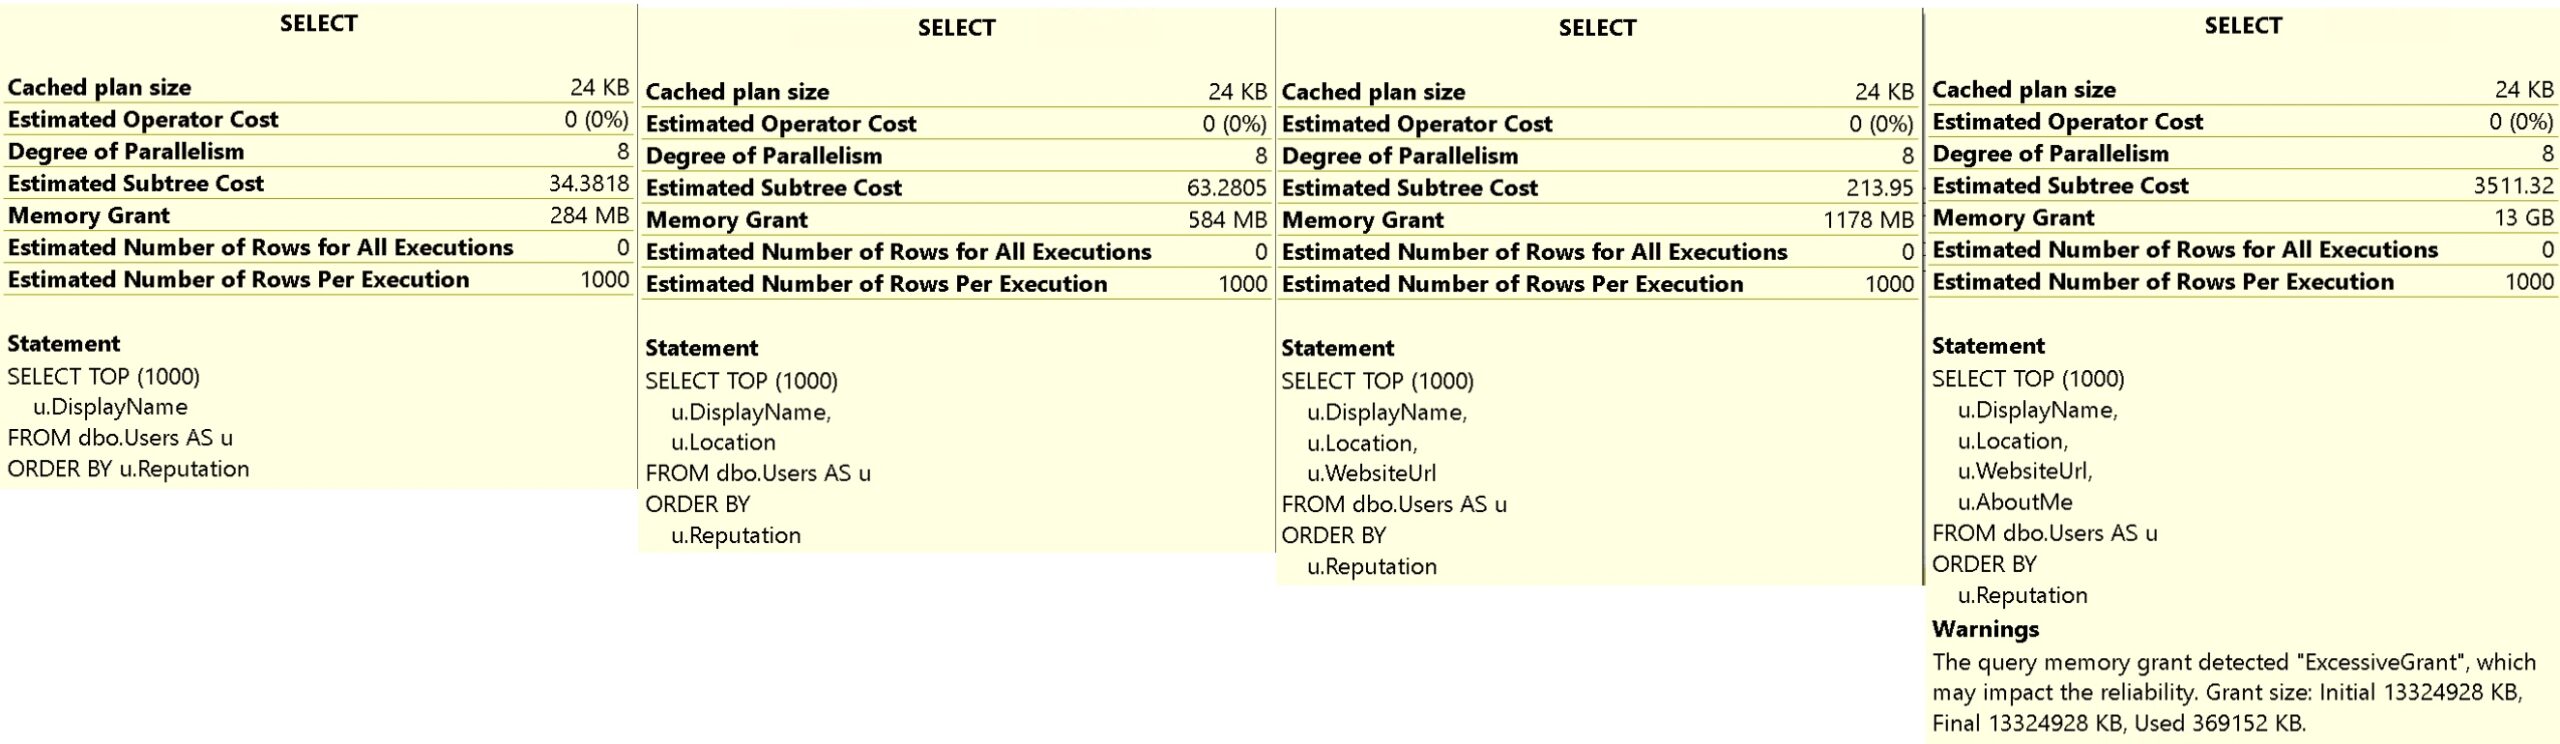
These queries will all request additional memory from SQL Server, because we’re asking it to return dated sorted by Reputation, and we don’t have any useful indexes that put the Reputation column in order. That means we need some scratch space to do the work in.

SELECT TOP (1000) 
    u.DisplayName 
FROM dbo.Users AS u 
ORDER BY 
    u.Reputation;

SELECT TOP (1000)
    u.DisplayName,
    u.Location
FROM dbo.Users AS u
ORDER BY
    u.Reputation;

SELECT TOP (1000)
    u.DisplayName,
    u.Location,
    u.WebsiteUrl
FROM dbo.Users AS u
ORDER BY
    u.Reputation;

SELECT TOP (1000)
    u.DisplayName,
    u.Location,
    u.WebsiteUrl,
    u.AboutMe
FROM dbo.Users AS u
ORDER BY
    u.Reputation;

The query plans for these are unremarkable. They all have a Sort operator in them used to order our data, but the memory grants for all of these go up, up, up.

SQL Server Query Plan Tool Tips
sunshine

We go from 284MB, to 584MB, to 1178MB, to 13GB. And worse, because of the 50% guess for column fullness, we only end up using 369MB of that 13GB.

Good luck with that.

Newer versions of SQL Server attempt to help you with this by adjusting memory grants between executions, but there are a bunch of caveats.

Lifetime


There are other problems that can occur with queries like these, but I’m going to cover them in other parts of the series because they tie into other concepts like indexing and parameter sniffing that I need to lay some foundation for first.

The memory grant thing is bad enough on its own, but it may not become a real issue until your databases reach a size where they outpace RAM by a significant margin.

That’s usually when you start seeing significant signs of memory pressure, which you can use my sp_PressureDetector stored procedure to help detect.

Thanks for reading!

Going Further


If this is the kind of SQL Server stuff you love learning about, you’ll love my training. Blog readers get 25% off the Everything Bundle — over 100 hours of performance tuning content. Need hands-on help? I offer consulting engagements from targeted investigations to ongoing retainers. Want a quick sanity check before committing to a full engagement? Schedule a call — no commitment required.

Using Batch Mode for the “Matching Supply With Demand” Challenge

Itzik Ben-Gan posted an interesting T-SQL challenge on SQL performance dot com. I’m writing up my solution in my own blog post because I have a lot to say and getting code formatting right can be tricky in blog post comments. For reference, my test machine is using SQL Server 2019 CU14 with an i7-9700K CPU @ 3.60 GHz processor. The baseline cursor solution completes in 8465 ms on my machine.

Running Totals

A simple way to solve this problem is to calculate running totals of quantity separately for supply and demand, treat the resulting rows as intervals, and find the intersections between supply and demand intervals. It is fairly straightforward and fast to calculate the interval start and end points and load them into temp tables, so I’ll omit that code for now. We can find the intersecting intervals with the query below( which you should not run):

SELECT d.ID DemandId, s.ID as SupplyID,
CASE
WHEN d.IntervalEnd >= s.IntervalEnd THEN s.IntervalEnd - CASE WHEN s.IntervalStart >= d.IntervalStart THEN s.IntervalStart ELSE d.IntervalStart END
ELSE d.IntervalEnd - CASE WHEN s.IntervalStart >= d.IntervalStart THEN s.IntervalStart ELSE d.IntervalStart END
END TradeQuantity
FROM #demand_intervals d
CROSS JOIN #supply_intervals s
WHERE d.IntervalEnd > s.IntervalStart AND d.IntervalStart < s.IntervalEnd
OPTION (QueryRuleOff BuildSpool);

Performance is terrible for this query because there is no possible index that will make that join condition fast. The query takes 955 seconds of CPU time and 134 seconds of elapsed time at MAXDOP 8.

a55 bad loop join

This blog post is about batch mode, so we need to turn that nested loop join into a hash join. It is important to recall that a hash join requires at least one equality condition in the join clause.

Exploring the Data

It’s important to Know Your Data while query writing, especially if you want to cheat in a performance competition. Taking a quick look at the Auctions table with the 400k row configuration:

a55 know your data

The things that stand out to me are that there are an equal number of supply and demand rows, both supply and demand have nearly the same average value, and the maximum quantity for both supply and demand is under 100. We can exploit the relatively low maximum quantity value to improve performance. A supply interval with a end point that is more than 100 units away from the demand end point cannot possibly intersect it. This is one of those things that feels intuitively correct, but I’ll go ahead and prove it anyway by contradiction.

Suppose that 100 is the maximum interval length, [d_start, d_end] and [s_start, s_end] overlap, s_end is more than 100 units away from d_end.

  1. The distance between end points implies that d_end < s_end – 100
  2. If they overlap, then s_start < d_end
  3. This implies that s_start < d_end < s_end – 100
  4. This implies that s_start < s_end – 100
  5. This implies that s_end – s_start > 100

The final statement is impossible because 100 is the maximum interval length. You can do the same proof in the other direction. Therefore, it should be safe to add some filters to our original query:

SELECT d.ID DemandId, s.ID as SupplyID,
CASE
WHEN d.IntervalEnd >= s.IntervalEnd THEN s.IntervalEnd - CASE WHEN s.IntervalStart >= d.IntervalStart THEN s.IntervalStart ELSE d.IntervalStart END
ELSE d.IntervalEnd - CASE WHEN s.IntervalStart >= d.IntervalStart THEN s.IntervalStart ELSE d.IntervalStart END
END TradeQuantity
FROM #demand_intervals d WITH (TABLOCK)
CROSS JOIN #supply_intervals s WITH (TABLOCK)
WHERE d.IntervalEnd > s.IntervalStart AND d.IntervalStart < s.IntervalEnd
AND s.IntervalEnd >= d.IntervalEnd - 100
AND s.IntervalEnd <= d.IntervalEnd + 100;

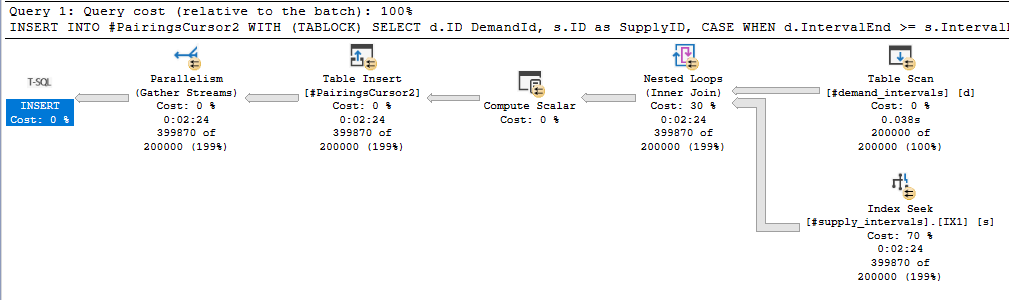
Now we can get a proper index seek on the s.IntervalEnd column. Performance is significantly better with this additional filter clause. The total runtimes for all steps, including the omitted temp table creation, are 1030 ms of CPU time and 345 ms of elapsed time. We are of course not using batch mode though:

a55 good loop join

Buckets

Time for more math. Starting with the following filter conditions:

AND s.IntervalEnd >= d.IntervalEnd – 100
AND s.IntervalEnd <= d.IntervalEnd + 100;

I can divide both sides by 100 and the condition will still be true:

AND s.IntervalEnd / 100 >= d.IntervalEnd / 100 – 1
AND s.IntervalEnd / 100 <= d.IntervalEnd / 100 + 1

You’ll have to take my word for it that the equation is still true if we truncate everything down to integers:

AND FLOOR(s.IntervalEnd / 100) >= FLOOR(d.IntervalEnd / 100) – 1
AND FLOOR(s.IntervalEnd / 100) <= FLOOR(d.IntervalEnd / 100) + 1

Now we’re dealing with integers, so we can express this as the following:

FLOOR(s.IntervalEnd / 100) IN (FLOOR(d.IntervalEnd / 100) – 1, FLOOR(d.IntervalEnd / 100) + 0, FLOOR(d.IntervalEnd / 100) + 1)

Rewriting once again:

FLOOR(s.IntervalEnd / 100) = FLOOR(d.IntervalEnd / 100) – 1
OR FLOOR(s.IntervalEnd / 100) = FLOOR(d.IntervalEnd / 100) + 0
OR FLOOR(s.IntervalEnd / 100) = FLOOR(d.IntervalEnd / 100) + 1

That’s still not eligible for a hash join, but it is if we change it to a UNION ALL:

... JOIN ON ...
FLOOR(s.IntervalEnd / 100) = FLOOR(d.IntervalEnd / 100) - 1

UNION ALL

... JOIN ON ...
FLOOR(s.IntervalEnd / 100) = FLOOR(d.IntervalEnd / 100) + 0

UNION ALL

... JOIN ON ...
FLOOR(s.IntervalEnd / 100) = FLOOR(d.IntervalEnd / 100) + 1

We have successfully transformed a single BETWEEN join filter into three joins with equality filters. All three of those joins are eligible for batch mode.

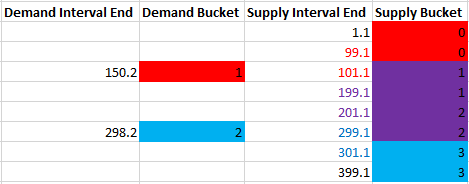
A visual representation may be helpful. Suppose we have two demand intervals that end in 150.2 and 298.2. We need to match those intervals with 8 supply intervals with end points that range from 1.1 to 399.1. To do so, we can divide the intervals into buckets of 100 width and join on matching bucket values as well as the immediately adjacent bucket values:

a55 colors

The demand interval that ends in 150.2 has a bucket value of 1, so it is matched with supply buckets 0, 1, and 2. In this way, we can guarantee that any supply interval that’s 100 or fewer units away ends up getting matched with the right demand intervals. The supply buckets with a background of red are only matched to the demand interval of 150.2, blue is only matched to the demand interval of 298.2, and purple is matched to both. The buckets are overly inclusive of course. The actual rows that might match based on distance have their font color changed in the same way, but filtering out extra rows later will be no problem. The important thing is that we have an equality condition to work with. Now that we can finally perform hash joins, it’s time to work out all of the details.

Gotta Go Fast

We need to perform three operations:

  1. Calculate the maximum interval length.
  2. Calculate running totals for supply and demand, their bucket values, and load them into temporary objects.
  3. Query the temp tables to load the final results into another table.

For step 1, we simply need an index on the Quantity column to make the query fast. We also need to get an exclusive lock and hold it until we’re finished with all of the steps. Otherwise the max length could change in the middle of our code’s execution.

For step 2, the best performing options are either a MAXDOP 1 query with an ordered index scan and a batch mode window aggregate or a parallel query with a batch mode sort, parallel batch mode window aggregate, and parallel insert. An NCCI on the Auctions table is helpful in getting batch mode. In order to make the code go as fast as possible, I elected to use the parallel option at MAXDOP 4 even though it uses significantly more CPU time than the MAXDOP 1 option. DOP is at 4 instead of 8 due to contention caused by the NESTING_TRANSACTION_FULL latch. Here’s an estimated plan picture in case you don’t know what I mean by all of that:

a55 window

For the third query, I’m using a UNION ALL of 3 joins that are eligible for batch mode like I said earlier. I added some query hints to reduce compile time.

As a step 0 that I forgot to mention earlier, create the following indexes on the Auctions table:

CREATE INDEX IX_Auctions__Code_ID__INCLUDE_Quantity ON Auctions (Code, ID) INCLUDE (Quantity);

CREATE INDEX IX_Auctions__Quantity ON Auctions (Quantity);

CREATE NONCLUSTERED COLUMNSTORE INDEX NCCI_Auctions ON Auctions (Code) with (MAXDOP = 1);

You can find the full code below for all three steps:

SET NOCOUNT ON;

DROP TABLE IF EXISTS #PairingsCursor2;
CREATE TABLE #PairingsCursor2
(
DemandID INT NOT NULL,
SupplyID INT NOT NULL,
TradeQuantity DECIMAL(19, 6) NOT NULL
);

DROP TABLE IF EXISTS #demand_intervals;
CREATE TABLE #demand_intervals (
ID INT NOT NULL,
IntervalStart DECIMAL(19, 6) NOT NULL,
IntervalEnd DECIMAL(19, 6) NOT NULL,
IntervalBucket BIGINT NOT NULL
);

DROP TABLE IF EXISTS #supply_intervals;
CREATE TABLE #supply_intervals (
ID INT NOT NULL,
IntervalStart DECIMAL(19, 6) NOT NULL,
IntervalEnd DECIMAL(19, 6) NOT NULL,
IntervalBucket BIGINT NOT NULL
);

DECLARE @MaxQuantityRange DECIMAL(19, 6);

BEGIN TRANSACTION;

SELECT @MaxQuantityRange = MAX(Quantity) - MIN(Quantity)
FROM Auctions WITH (TABLOCKX);

INSERT INTO #demand_intervals WITH (TABLOCK)
SELECT ID, rt - Quantity IntervalStart, rt IntervalEnd, CAST(rt / @MaxQuantityRange AS BIGINT) AS IntervalBucket
FROM
(
SELECT a.ID, Quantity, SUM(Quantity) OVER (ORDER BY a.ID ROWS BETWEEN UNBOUNDED PRECEDING AND CURRENT ROW) rt
FROM dbo.Auctions a WITH (TABLOCK)
WHERE Code = 'D'
) q
OPTION (USE HINT('ENABLE_PARALLEL_PLAN_PREFERENCE'), MAXDOP 4);

INSERT INTO #supply_intervals WITH (TABLOCK)
SELECT ID, rt - Quantity IntervalStart, rt IntervalEnd, CAST(rt / @MaxQuantityRange AS BIGINT) AS IntervalBucket
FROM
(
SELECT a.ID, Quantity, SUM(Quantity) OVER (ORDER BY a.ID ROWS BETWEEN UNBOUNDED PRECEDING AND CURRENT ROW) rt
FROM dbo.Auctions a WITH (TABLOCK)
WHERE Code = 'S'
) q
OPTION (USE HINT('ENABLE_PARALLEL_PLAN_PREFERENCE'), MAXDOP 4);

/*
-- prevents temp table caching, slight performance overhead in last query, but avoids "expensive" stats gathering for uncached object scenario
CREATE STATISTICS s0 ON #demand_intervals (IntervalBucket) WITH SAMPLE 0 ROWS;
CREATE STATISTICS s1 ON #supply_intervals (IntervalBucket) WITH SAMPLE 0 ROWS;
*/

INSERT INTO #PairingsCursor2 WITH (TABLOCK)
SELECT d.ID DemandId, s.ID as SupplyID,
CASE
WHEN d.IntervalEnd >= s.IntervalEnd THEN s.IntervalEnd - CASE WHEN s.IntervalStart >= d.IntervalStart THEN s.IntervalStart ELSE d.IntervalStart END
ELSE d.IntervalEnd - CASE WHEN s.IntervalStart >= d.IntervalStart THEN s.IntervalStart ELSE d.IntervalStart END
END TradeQuantity
FROM #demand_intervals d WITH (TABLOCK)
INNER JOIN #supply_intervals s WITH (TABLOCK) ON d.IntervalBucket = s.IntervalBucket
WHERE d.IntervalEnd > s.IntervalStart AND d.IntervalStart < s.IntervalEnd

UNION ALL

SELECT d.ID DemandId, s.ID as SupplyID, CASE WHEN d.IntervalEnd >= s.IntervalEnd THEN s.IntervalEnd - CASE WHEN s.IntervalStart >= d.IntervalStart THEN s.IntervalStart ELSE d.IntervalStart END
ELSE d.IntervalEnd - CASE WHEN s.IntervalStart >= d.IntervalStart THEN s.IntervalStart ELSE d.IntervalStart END
END TradeQuantity
FROM #demand_intervals d WITH (TABLOCK)
INNER JOIN #supply_intervals s WITH (TABLOCK) ON s.IntervalBucket = d.IntervalBucket - 1
WHERE d.IntervalEnd > s.IntervalStart AND d.IntervalStart < s.IntervalEnd

UNION ALL

SELECT d.ID DemandId, s.ID as SupplyID, CASE WHEN d.IntervalEnd >= s.IntervalEnd THEN s.IntervalEnd - CASE WHEN s.IntervalStart >= d.IntervalStart THEN s.IntervalStart ELSE d.IntervalStart END
ELSE d.IntervalEnd - CASE WHEN s.IntervalStart >= d.IntervalStart THEN s.IntervalStart ELSE d.IntervalStart END
END TradeQuantity
FROM #demand_intervals d WITH (TABLOCK)
INNER JOIN #supply_intervals s WITH (TABLOCK) ON s.IntervalBucket = d.IntervalBucket + 1
WHERE d.IntervalEnd > s.IntervalStart AND d.IntervalStart < s.IntervalEnd
OPTION (USE HINT('ENABLE_PARALLEL_PLAN_PREFERENCE'), MAXDOP 8, HASH JOIN, CONCAT UNION, FORCE ORDER, NO_PERFORMANCE_SPOOL); -- reduce compile time

COMMIT TRANSACTION;

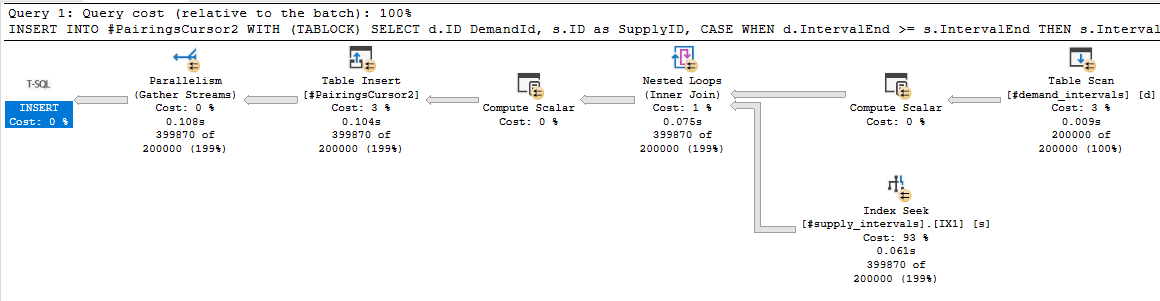
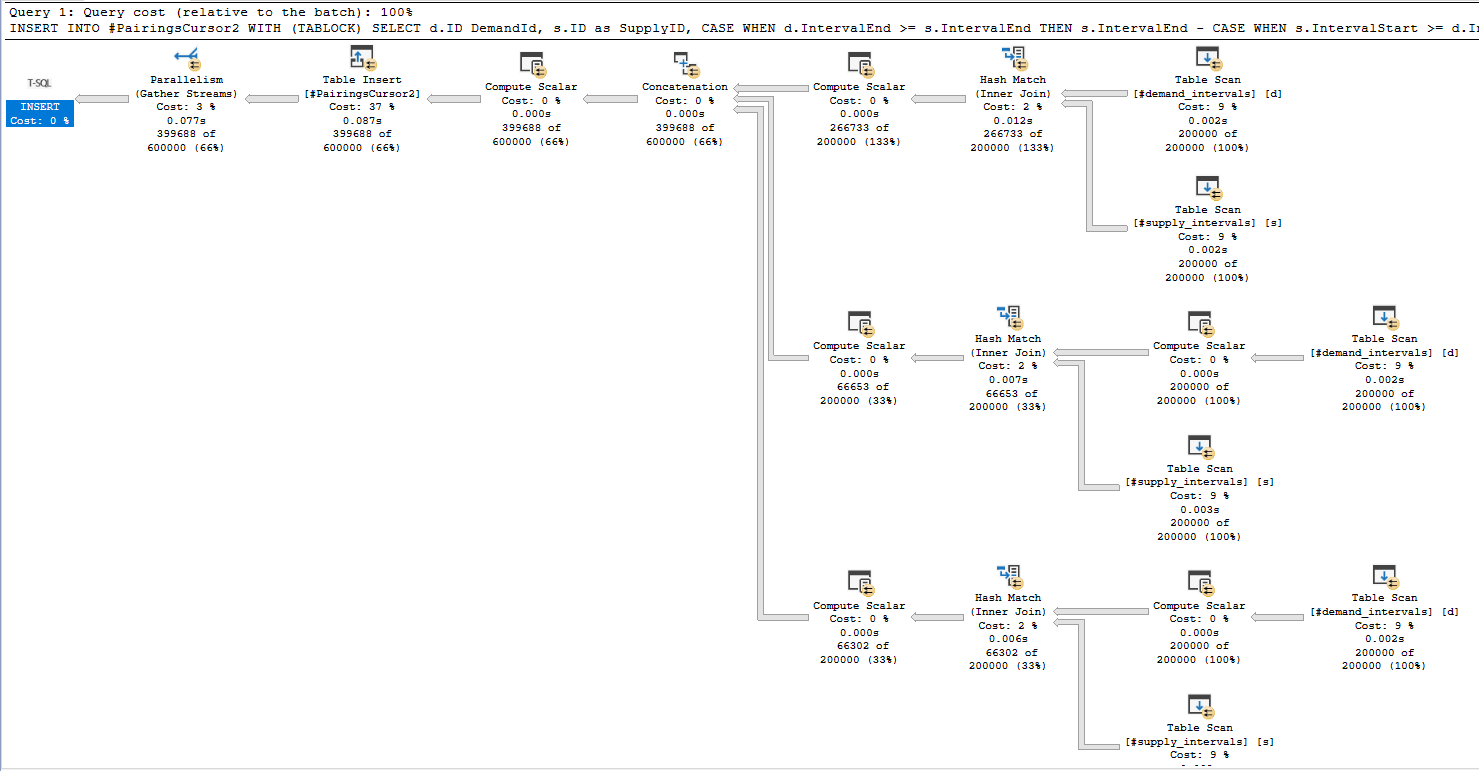
For the first execution, CPU time is generally around 1245 ms and elapsed time is around 500 ms. For subsequent executions, CPU time is around 634 ms and elapsed time is around 168 ms. Here is an actual execution plan for step 3:

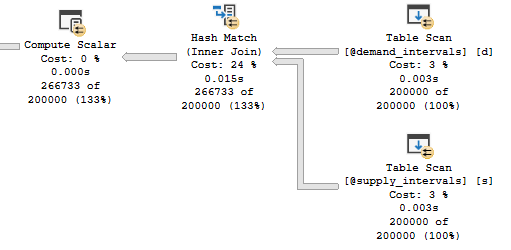
a55 batch temp table

Not surprisingly, the join for matching buckets returns significantly more rows than the joins for adjacent buckets.

REEEEEEEEEEEEECOMPILES

You may be wondering why the first execution takes so much longer than subsequent executions. The problem is the creation of temp table statistics. For some reason, SQL Server issues four StatMan queries per statistic that it creates:

a55 temp table statistics

Some of them run at MAXDOP 1 and some of them run at MAXDOP 8 and all of that time adds up. After the first execution the creation of statistics no longer happens, I assume due to statistics caching for temporary tables. Even adding an explicit FULLSCAN create statistics statement doesn’t avoid this problem for some reason. You can create 0 row statistics if you like (see the commented out code), but I’m going to declare a moral victory here instead of digging into it further. If the biggest performance problem for your query is statistics creation on a pair of 200k row temp tables then you probably have pretty efficient code.

With that said, table variables are an interesting alternative here. I get consistent runtimes of 550 CPU ms and 230 ms of elapsed time using table variables. The deferred compilation feature introduced in SQL Server 2019 is important to get the right query plan. We lose a bit of runtime for the MAXDOP 1 table variable inserts and the final insert is slightly less efficient as well due to the missing statistics. Still, the runtimes are consistent between the first and second executions and overall CPU usage is down. Also you have to admit that seeing a batch mode table variable scan with a correct cardinality estimate (without RECOMPILE) is pretty cool:

a55 batch table variables

Query Scaling

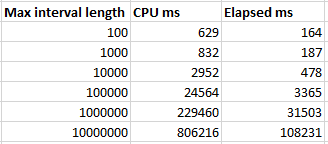
The performance of the batch mode query greatly depends on the maximum interval length. Query runtime increases in a roughly linear fashion as the max length increases:

a55 scaling

The linear pattern is broken for the final test case because all of the rows are in a single bucket at that point, so two out of three of the joins don’t do much of anything. Is this type of query safe to use in production? Sure, as long as you’re okay with significantly worse performance if a single outlier row happens to appear. Possible defenses against that include additional constraints on the data, knowing your data well, or writing a fallback algorithm if the maximum interval length is too long for the batch mode bucketizing approach to perform well.

Final Thoughts

This blog post shows how batch mode hash joins can be used as an efficient solution to find intersecting intervals, provided that the maximum interval length is sufficiently small. The important thing is everyone involved had fun. Thanks for reading!

Software Vendor Mistakes With SQL Server: Passing Long IN Clauses To Queries From An ORM

Mirror Backwards


When it comes to weird performance problems, I’ve seen this cause all sorts of them. The worst part is that there are much smarter ways to handle this.

While Table Valued Parameters aren’t perfect, I’d argue that they’re far more perfect than the alternative.

The first issue I see is that these clauses aren’t ever parameterized, which brings us to a couple familiar issues: plan cache bloat and purge, and constant query compilation.

Even when they are parameterized, some bad stuff can happen.

Since We’re Here


Let’s say you take steps like in the linked post about above to parameterize those IN clauses, though. Does that fix all your performance problems?

You can probably guess. Hey look, index!

CREATE INDEX u ON dbo.Users(DisplayName, Reputation) 
WITH(SORT_IN_TEMPDB = ON, DATA_COMPRESSION = PAGE);

Now, we’re gonna use a stored procedure I wrote to generate a long parameterized in clause. It’s not pretty, and there’s really no reason to do something like this outside of a demo to show what a bad idea it is.

Here’s how we’re gonna execute it:

EXEC dbo.Longingly
    @loops = 50,
    @debug = 0;

EXEC dbo.Longingly
    @loops = 100,
    @debug = 0;

EXEC dbo.Longingly
    @loops = 1000,
    @debug = 0;

If anyone thinks people sending 1000-long lists to an IN clause isn’t realistic, you should really get into consulting. There’s some stuff out there.

And Wave


Here’s what the query plans for those executions look like:

SQL Server Query Plan
stingy

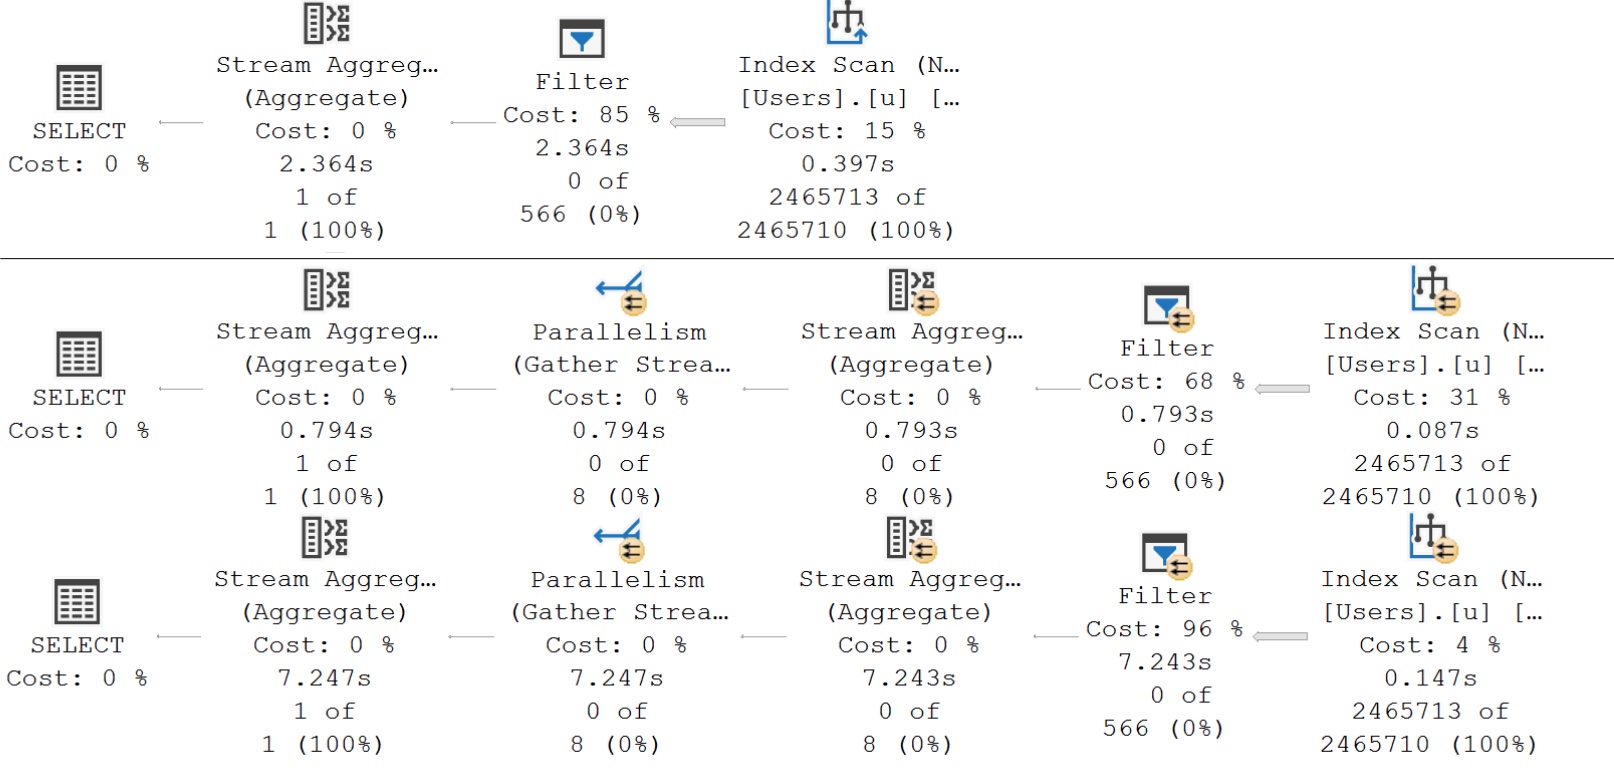
The important detail here is that even with our super duper powered index, the optimizer decides that life would be too difficult to apply our “complicated” predicate. We end up with query plans that scan the index, and then apply the predicate in a Filter operator afterwards.

You’re not misreading, either. The 1000-value filter runs for roughly 7 seconds. Recompile hints do not work here, and, of course, that’d undo all your hard work to parameterize these queries.

Moral of the story: Don’t do this. Pass in a TVP, like the link above shows you how to do. If your ORM doesn’t support that, you might need to switch over to stored procedures.

Thanks for reading!

Going Further


If this is the kind of SQL Server stuff you love learning about, you’ll love my training. Blog readers get 25% off the Everything Bundle — over 100 hours of performance tuning content. Need hands-on help? I offer consulting engagements from targeted investigations to ongoing retainers. Want a quick sanity check before committing to a full engagement? Schedule a call — no commitment required.

Software Vendor Mistakes With SQL Server: Sticking With ORMs And Not Using Stored Procedures

Repeat It We Must


If you have a small to medium sized application, and your developers are highly skilled not only in their preferred method of development, and you have someone who can manage SQL Server performance well (think settings, indexes, etc.) then you might be able to get away with having zero stored procedures.

This post is for everyone else, and by “everyone else” I mean “99% of software shops” out there.

You are seen. You are seen by me.

One Eye Up


The problems you’ll run into eventually will come from a few places, in general:

  • SQL Server has some wonky setup issues (this is still surprisingly common)
  • No one is managing the indexing (and I don’t mean maintenance, here)
  • Developer naïveté about what the generated queries look like (text and plan complexity)

Certain PaaS offerings, and software shops who offload certain tasks to customer DBA teams will partially be in the clear, here. But more often than not, DBAs are accidental and not much more confident than the average sysadmin when it comes down to digging into performance issues.

DBAs skilled in the art of performance tuning will be happy to tweak indexes where possible, but a lot of their feedback to you as a vendor might be a wishlist of things that they could do if the code were in a stored procedure where more traditional tuning techniques are available.

Matter Of Years


I’ve helped more than a few vendors dig their way out of ORM hell now, and the process isn’t so bad once you understand the logic involved to get the right results back.

Once you’re writing stored procedures, you have a whole world of possibilities when it comes to adjusting the code to better manage performance. For critical applications, this often becomes a necessity once a database gets big or busy enough.

I totally understand the appeal of ORMs for many development tasks and priorities, but once you run out of tricks to get it working faster, you need to learn how to let go.

Thanks for reading!

Going Further


If this is the kind of SQL Server stuff you love learning about, you’ll love my training. Blog readers get 25% off the Everything Bundle — over 100 hours of performance tuning content. Need hands-on help? I offer consulting engagements from targeted investigations to ongoing retainers. Want a quick sanity check before committing to a full engagement? Schedule a call — no commitment required.

Software Vendor Mistakes With SQL Server: Not Parameterizing Queries

You Won’t Stop


Continuing a bit on yesterday’s theme of parameterization, another type of mistake I see software vendors make quite a bit is not parameterizing queries at all, or only partially parameterizing them. When you do this, you harm SQL Server’s ability to cache and reuse execution plans. There are very few situations where this is advisable outside of data warehouses.

There are all sorts of things that can cause this that aren’t just confined to places where you’d traditionally consider parameterization, like TOP, OFFSET/FETCH, and even static values in a SELECT list.

If you’re reading this with some knowledge of SQL Server, the reason I say it harms the ability to cache plans is because there are limits to plan cache size, and the more pollution you cause the more churn there is.

Partially parameterizing queries has the additional misfortune of not being a problem that the forced parameterization setting can solve.

Hold Up


To simulate what happens when you don’t parameterize queries, we can use unsafe dynamic SQL. In this case, it’s probably not the worst sin against dynamic SQL since we’re using an integer limited to a two byte string, but you know, I’d be a bad blogger if I didn’t point that out.

DECLARE
    @i int = 1,
    @sql nvarchar(MAX) = N'';


WHILE @i <= 10
BEGIN
    
    SELECT 
        @sql = N'    
        SELECT
            c = COUNT_BIG(*),
            s = SUM(p.Score * 1.),
            m = MAX(u.DisplayName),
            r = MIN(u.Reputation)
        FROM dbo.Users AS u
        JOIN dbo.Posts AS p
            ON p.OwnerUserId = u.Id
        WHERE u.Reputation = ' + CONVERT(nvarchar(2), @i) + ';
    ';
    
    RAISERROR
    ( 
        @sql,
        0,
        1
    )
    WITH
        NOWAIT;

    SET STATISTICS XML ON;
        EXEC sys.sp_executesql
            @sql;
    SET STATISTICS XML OFF;
    
    SELECT 
        @i += 1;
    
END;

After that, we can look at the plan cache and see what happened.

Large Amounts


These 10 executions will generate 3-4 different query plans, but even when the same plan is chosen, it has different identifiers.

2021 12 06 17 24 47
beleefs

For high frequency execution queries, or more complicated queries (think lots of left joins, etc.) that may spend a lot of time in the optimization process trying out different join orders and plan shapes, you probably want to avoid not parameterizing queries, or only partially parameterizing them.

Thanks for reading!

Going Further


If this is the kind of SQL Server stuff you love learning about, you’ll love my training. Blog readers get 25% off the Everything Bundle — over 100 hours of performance tuning content. Need hands-on help? I offer consulting engagements from targeted investigations to ongoing retainers. Want a quick sanity check before committing to a full engagement? Schedule a call — no commitment required.

Software Vendor Mistakes With SQL Server: Not Strongly Typing Parameters

Month Out


Far and away, my most common clients are people who create or host applications that run on top of SQL Server. Over the years, I’ve noticed some common trends, but I’ve never written a cohesive set of posts that bring them all together in an easy to find reference.

All the posts in this series will be under the “Software Vendor Mistakes” tag, and I’ll have a roundup post at the end that links to them all. The topics I’m going to cover are purely from the perspective of software development, not infrastructure.

Many infrastructure decisions are made before problems with code, indexes, etc. are fixed, or to cover them up. I understand that line of thinking, but I want to reach the people who can make fundamental changes so a clear picture of what hardware is necessary comes through.

Enough preamble. Business time.

Parameter Inference


When working with ORMs, care has to be taken to strongly type your parameters to match the data type, length, precision, and scale of the columns those parameters will be compared to. Time and time again, I see the same patterns with string parameters:

  • They’re unnecessarily typed as Unicode/nvarchar
  • They’re not defined with an appropriate length
  • They’re used as catch-all parameters for temporal types (dates, etc.)

These coding malfeasances cause issues with:

  • Implicit conversions (index scans 🙀)
  • Unnecessary later filters (predicates that can’t be used as seek operators)
  • Plan cache pollution (compiling a new plan for every query)

I see this in particular with applications that attempt to be “database agnostic”, which almost seems to really mean “database atheistic”. It’s like developers don’t believe that databases really exist, and they can flaunt the rules that govern reliable performance.

Sure, the implicit conversion thing can happen outside of ORMs, but the length thing isn’t generally an issue.

Examples


I don’t have a handy example of the length issue causing plan cache pollution outside of this Stack Exchange Q&A: Parameterized query creating many plans

But that’s only because I recently moved computers and I’m not quite set up for that demo. But an implicit conversion demo is quite easy enough to demonstrate when you have a varchar column and you compare it to an nvarchar predicate. I do that in this video, normally part of my paid training:

Going Further


If this is the kind of SQL Server stuff you love learning about, you’ll love my training. Blog readers get 25% off the Everything Bundle — over 100 hours of performance tuning content. Need hands-on help? I offer consulting engagements from targeted investigations to ongoing retainers. Want a quick sanity check before committing to a full engagement? Schedule a call — no commitment required.