Does Using DISTINCT In SQL Server Queries Cause Performance Problems?

Footnote


I have two queries. They return the same number of rows.

The only difference is one column in the select list.

This query has the Id column, which is the primary key and clustered index of the Posts table.

    SELECT   DISTINCT
             p.Id, p.AcceptedAnswerId, p.AnswerCount, p.Body, p.ClosedDate,
             p.CommentCount, p.CommunityOwnedDate, p.CreationDate,
             p.FavoriteCount, p.LastActivityDate, p.LastEditDate,
             p.LastEditorDisplayName, p.LastEditorUserId, p.OwnerUserId,
             p.ParentId, p.PostTypeId, p.Score, p.Tags, p.Title, p.ViewCount
    FROM     dbo.Posts AS p
    JOIN     dbo.Votes AS v
        ON p.Id = v.PostId
    WHERE    p.PostTypeId = 2
    AND      p.CreationDate >= '20131225'
    ORDER BY p.Id;

The query plan for it looks like this:

SQL Server Query Plan
Eligible

Notice that no operator in this plan performs any kind of aggregation.

There’s no Hash Match Aggregate, no Stream Aggregate, no Distinct Sort, NADA!

It runs for ~1.9 seconds to return about 25k rows.

Lessen


Watch how much changes when we remove that Id column from the select list.

    SELECT   DISTINCT
             p.AcceptedAnswerId, p.AnswerCount, p.Body, p.ClosedDate,
             p.CommentCount, p.CommunityOwnedDate, p.CreationDate,
             p.FavoriteCount, p.LastActivityDate, p.LastEditDate,
             p.LastEditorDisplayName, p.LastEditorUserId, p.OwnerUserId,
             p.ParentId, p.PostTypeId, p.Score, p.Tags, p.Title, p.ViewCount
    FROM     dbo.Posts AS p
    JOIN     dbo.Votes AS v
        ON p.Id = v.PostId
    WHERE    p.PostTypeId = 2
    AND      p.CreationDate >= '20131225';

This is what the query plan now looks like:

SQL Server Query Plan
What’s wrong with you.

Zooming in a bit…

SQL Server Query Plan
Woof.

After we Scan the Posts table, we sort about 47k rows.

After the join to Votes, we aggregate data twice. There are two Stream Aggregate operators.

What do we sort?

SQL Server Query Plan
Boogers.

We Sort every column in the table by every column in the table.

In other words, we order by every column we’ve selected.

What do we aggregate?

SQL Server Query Plan

Everything. Twice.

What Does It All Mean?


When selecting distinct rows, it can be beneficial to include a column that the optimizer can guarantee is unique in the set of selected columns. Think of a primary key, or another column with a uniqueness constraint on it.

Without that, you can end up doing a lot of extra work to create a distinct result set.

Of course, there are times when that changes the logic of the query.

Thanks for reading!

Going Further


If this is the kind of SQL Server stuff you love learning about, you’ll love my training. I’m offering a 75% discount to my blog readers if you click from here. I’m also available for consulting if you just don’t have time for that and need to solve performance problems quickly.

SQL Server Index Fragmentation And Broken Demos

Egg Meet Face


The other night I was presenting for a user group, and I had a demo break on me.

Not the first time, not the last time. But this was weird because I had rehearsed things that morning.

I skipped over it at the time, but afterwards I started thinking about what had happened, and walking back through other stuff I had done that day.

Turns out, I had fragmented my indexes, and that broke a trivial plan demo.

Just Too Trivial


The working demo looks like this.

I run these queries. The top one receives a trivial plan, and doesn’t have a missing index request.

The bottom one gets full optimization, and one shows up.

	/*Nothing for you*/
	SELECT *
	FROM dbo.Users AS u
	WHERE u.Reputation = 2;

	/*Missing index requests*/
	SELECT *
	FROM dbo.Users AS u
	WHERE u.Reputation = 2
	AND 1 = (SELECT 1);
SQL Server Query Plan
Picture perfect.

Snap Your Shot


How I had broken this demo was by playing with Snapshot Isolation.

At some point earlier in the day, I had done something like this:

ALTER DATABASE StackOverflow2013 
    SET ALLOW_SNAPSHOT_ISOLATION ON;

BEGIN TRAN
UPDATE dbo.Users SET Reputation += 1
ROLLBACK

When you use optimistic isolation levels, a 14 byte pointer gets added to every row to keep track of its version.

If I had run the update without it, it wouldn’t have been a big deal. But, you know.

I’m not that lucky. Or smart.

See, after updating every row in the table, my table got uh… bigger.

SQL Server Query Results
Looter in a riot

Now, if I rebuild the table with snapshot still on, the problem goes away.

The problem is that I didn’t do that before or after my little experiment.

With a heavily fragmented index, both queries not only get fully optimized, but also go parallel.

SQL Server Query Results
Faster/Stronger

They’re both a bit faster. They both use a little more resources.

Why? Because SQL Server looked at the size of the table and decided it would be expensive to scan this big chonker.

Egg Wipes


Moral of the story: Index fragmentation makes your queries better.

Don’t @ me.

Going Further


If this is the kind of SQL Server stuff you love learning about, you’ll love my training. I’m offering a 75% discount to my blog readers if you click from here. I’m also available for consulting if you just don’t have time for that and need to solve performance problems quickly.

Are Table Variable Indexes Ever Useful In SQL Server?

Oughtta Know


Indexes are good for so much more than what they’re given credit for by the general public.

One example where indexes can be useful is with the oft-maligned table variable.

Now, they won’t help you get a better estimate from a table variable. In versions prior to the upcoming 2019 release, table variables will only net you a single row estimate.

Yes, you can recompile to get around that. Yes, you can use a trace flag to occasionally be helpful with that.

Those defenses are inadequate, and you know it.

Help How?


Let’s say we have this query against a table variable.

SELECT u.DisplayName, b.Date
FROM dbo.Users AS u
CROSS APPLY
    (
        SELECT TOP 1 *
        FROM @waypops AS w
        WHERE u.Id = w.UserId
        ORDER BY w.Date DESC
    ) AS b
WHERE u.Reputation >= 100000;

With an unindexed table variable, the plan looks like this:

SQL Server Query Plan
Sucko

You can see by the helpful new operator time stats in SSMS 18 that this query runs for 13.443 seconds.

Of that, 13.333 seconds is spent scanning the table variable. Bad guess? You bet.

If we change the table variable definition to include an index, the plan changes, and runs much faster.

SQL Server Query Plan
Holla holla

The query no longer goes parallel, but it runs for 226ms.

A significant change aside from parallelism is that the Top operator is no longer a Top N Sort.

The clustered index has put the table variable data in useful order for our query.

Insertions


The table variable insert looks like this:

DECLARE @waypops TABLE 
(
  UserId INT NOT NULL,
  Date DATETIME NOT NULL
  --, INDEX c CLUSTERED(UserId, Date DESC)
);

INSERT @waypops 
        (UserId, Date)
SELECT b.UserId, b.Date
FROM dbo.Badges AS b
WHERE b.Name IN ( N'Popular Question')
UNION ALL 
SELECT b.UserId, b.Date
FROM dbo.Badges AS b
WHERE b.Name IN (N'Notable Question' )

Right now, I’ve got the index definition quoted out. The insert runs for .662ms.

SQL Server Query Plan
Oh Boy

The insert with the index in place runs for .967ms:

SQL Server Query Plan
Grab an umbrella

Given the 13 second improvement to the final query, I’ll take the ~300ms hit on this one.

Wierda


If you’re wondering why I’ve got the insert query broken up with a UNION ALL, it’s because the alternative really sucks:

DECLARE @waypops TABLE 
(
  UserId INT NOT NULL,
  Date DATETIME NOT NULL
  , INDEX c CLUSTERED(UserId, Date DESC)
);

INSERT @waypops 
        (UserId, Date)
SELECT b.UserId, b.Date
FROM dbo.Badges AS b
WHERE b.Name IN ( N'Popular Question', N'Notable Question')
SQL Server Query Plan
@_@

This insert takes 1.4 seconds, and introduces a spilling sort operator.

So uh, don’t do that IRL.

Thanks for reading!

Going Further


If this is the kind of SQL Server stuff you love learning about, you’ll love my training. I’m offering a 75% discount to my blog readers if you click from here. I’m also available for consulting if you just don’t have time for that and need to solve performance problems quickly.

Should An Optimistic Isolation Level Be The New Default For SQL Server Databases?

Two Words


Alright, I’ve lied to you already. There are way more than two words involved, here.

I recently had breakfast (JUST BREAKFAST, GOD) with Microsoft’s Most Handsome Man™, and the topic came up.

Partially because there are such fundamental changes coming to SQL Server, and also because it’s already the default in Azure SQL DB.

If I had to name a redeeming quality of Azure SQL DB, that would be it.

Unboxing


I’ve seen pessimistic locking causing problems and heartache on many, many servers.

While it wasn’t totally the fault of the isolation level (query and index tuning was needed, and there was some other silliness), it shouldn’t take that kind of dedication to make It Just Run Faster©.

Possibly the worst side effect is people leaning heavily on reading dirty data (via read uncommitted/nolock) to avoid issues.

You can’t preach about the evils of dirty reads without offering ways to avoid blocking.

Yes, I’m looking at you.

You all cackle at seeing NOLOCK everywhere, but I don’t hear much about solving blocking problems without it.

Standards and Futures


Right now “other major database platforms” offer optimistic locking as the default.There are implementation differences, but the net result is the same.

Readers and writers don’t suffer locking contention, and only fully committed data is read.

SQL Server currently offers optimistic locking via Read Committed Snapshot Isolation (RCSI from here), and Snapshot Isolation (SI from here).

Right now, they both send row versions to tempdb. But in the works for SQL Server 2019 is a feature called Accelerated Database Recovery (ADR from here). The mechanism that makes this possible is a Persistent Version Store (PVS from here) that’s local to the database, not tempdb.

While RCSI and SI could end up sending quite a bit of data to tempdb, which could cause contention there without a lot of precautions and setup work, any potential contention from ADR would be localized.

I know, Microsoft has been addressing tempdb, too. Setup now configures tempdb in a mostly sane way, and trace flags 1117 and 1118 are the default behavior in 2016+. That should make optimistic locking a more comfortable setting for people, but no. No. I hardly ever see it in use.

Dependencies


Breaking changes are hard. I know, there are people out there who depend on pessimistic locking for certain patterns to maintain correctness.

The thing is, it’s a lot easier to have just these processes use pessimistic locking while allowing the rest of the us to not have to sprinkle NOLOCK hints every which where to get a report to run.

An example of a process that requires some locking hints is Paul White’s post about Sequence Tables.

At this point in time, if you’re implementing a queue in SQL Server, you should be the one learning about how to get the kind of locking you need to get it working. Normal people who just want their app to work shouldn’t be the ones staring at articles about isolation levels, locking hints, lock escalation, etc.

Get It, Get It


This is a good problem to get in front of. I’d be quite happy to not have to talk about the reader/writer aspects of locking anymore.

In the same way, it would be nice to not have to talk to users who are endlessly frustrated by locking problems, explain dirty reads, explain optimistic isolation levels, caution them against certain issues, and then tell them to have fun removing all those old lock hints.

Thanks for reading!

Going Further


If this is the kind of SQL Server stuff you love learning about, you’ll love my training. I’m offering a 75% discount to my blog readers if you click from here. I’m also available for consulting if you just don’t have time for that and need to solve performance problems quickly.

The Real Value Of Optimistic Isolation Levels In SQL Server

Erroneous


While a lot of people speak highly of optimistic locking because it cuts down on blocking issues, I think it’s of equal or higher value that dirty reads are prevented.

“Imagine” a situation where someone ran a query they shouldn’t have.

Either forgetting a join, a where, or some other limiting condition.

You know, while they’re continuously integrating something.

Out, damn spot


    BEGIN TRAN;
    UPDATE h
    SET h.Score = 2147483647
    FROM dbo.HighQuestionScores AS h
    WHERE 1=1;

This will update every row in the table. I know this because once upon a time, I wrote a similar query and learned the importance of backups.

I also learned that tools that throw a warning when modification queries are missing WHERE clauses think this one is just fine.

But now if I go into another window, this query will return wrong results.

    SELECT TOP 10 *
    FROM dbo.HighQuestionScores AS hqs WITH(NOLOCK)
    ORDER BY hqs.Id DESC;
SQL Server Query Results
BIGINT FOR U

In fact, any query that runs with a nolock hint will show incorrect values here.

  • Boss runs a report? Wrong.
  • Trigger fires based on a score change? Wrong.
  • User checks their account? Wrong.

Fully Correct


    SET TRANSACTION ISOLATION LEVEL SNAPSHOT;
    
    SELECT TOP 10 *
    FROM dbo.HighQuestionScores AS hqs
    ORDER BY hqs.Id DESC;

This query uses the snapshot isolation level.

It would do the same thing under read committed snapshot isolation, but without needing to set the isolation level.

But now we don’t get someone’s accident in our query results.

SQL Server Query Results
Big Baby

Remember folks: yeah, blocking sucks, but incorrect data is usually way, way worse.

Thanks for reading!

Going Further


If this is the kind of SQL Server stuff you love learning about, you’ll love my training. I’m offering a 75% discount to my blog readers if you click from here. I’m also available for consulting if you just don’t have time for that and need to solve performance problems quickly.

Breaking Columnstore Delta Rowgroups

The documentation on delta rowgroups says:

A delta rowgroup is a clustered index that’s used only with columnstore indexes. It improves columnstore compression and performance by storing rows until the number of rows reaches a threshold and are then moved into the columnstore.

This clustered index isn’t chosen by the person who creates the table. It’s a hidden internal column automatically added to delta rowgroups. Perhaps the implementation is similar to that of table spools:

The worktable is structured as if it was defined with a clustered index on zero columns. This means that a 4-byte uniqueifier is added to each row stored except the first.

You know how programmers are: they love reusing old code. If a similar implementation is used for delta rowgroups then it should be possible to see SQL Server errors with the right pattern of data loading. More investigation is required.

Defining the rules


It might be possible to find evidence of this clustered index by using DBCC PAGE. In the T-SQL code below, I create a table clustered columnstore index, insert 500 rows, delete 499 rows, insert 500 more rows, and delete 499 rows again:

CREATE TYPE dbo.SEAN_GALLARDY_INT FROM SMALLINT NOT NULL;

DROP TABLE IF EXISTS dbo.view_hidden_clustered_index;

CREATE TABLE dbo.view_hidden_clustered_index (
	ID SEAN_GALLARDY_INT,
	INDEX CCI CLUSTERED COLUMNSTORE
);

GO

CREATE OR ALTER PROCEDURE #p AS
BEGIN
	SET NOCOUNT ON;

	DECLARE @value_to_insert INT = 1;

	WHILE @value_to_insert <= 500
	BEGIN
		INSERT INTO dbo.view_hidden_clustered_index VALUES (@value_to_insert);

		SET @value_to_insert = @value_to_insert + 1;
	END;

	DELETE FROM dbo.view_hidden_clustered_index
	WHERE ID < 500;

	WHILE @value_to_insert <= 1000
	BEGIN
		INSERT INTO dbo.view_hidden_clustered_index VALUES (@value_to_insert);

		SET @value_to_insert = @value_to_insert + 1;
	END;

	DELETE FROM dbo.view_hidden_clustered_index
	WHERE ID > 500 AND ID < 1000;
END;

GO

EXEC #p;

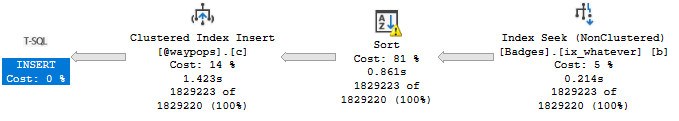
There’s only a single page that stores the 2 rows currently held by the table. This can be viewed with the undocumented DBCC PAGE, TF 3604, and the undocumented sys.dm_db_database_page_allocations:

DECLARE @file_id SEAN_GALLARDY_INT;
DECLARE @page_id INT;

SELECT @file_id = allocated_page_file_id, @page_id = allocated_page_page_id
FROM sys.dm_db_database_page_allocations 
    (DB_ID(), OBJECT_ID('dbo.view_hidden_clustered_index'),NULL, NULL, 'DETAILED')
WHERE is_allocated = 1 AND allocation_unit_type = 1 AND is_iam_page = 0 and page_type = 1;

DBCC TRACEON(3604);
DBCC PAGE('TEST',@file_id,@page_id,3) WITH TABLERESULTS;
DBCC TRACEOFF(3604);

The information that we’re looking for is near the bottom of the result set:

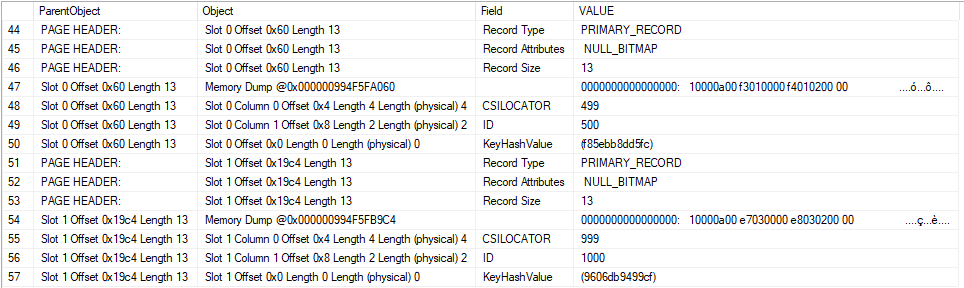
A few things are worth calling out. The 500th row that was inserted into the table has a value of 499 for the “CSILOCATOR” field. This value appears to be stored in little-endian format in the memory dump for Slot 0 Offset 0x60. You can decode the raw value to 499 in T-SQL if desired:

SELECT CAST(0x000001F3 AS INT);

The 1000th row that was inserted into the table into the table has a value of 999 for the CSILOCATOR field. Most importantly, this CSILOCATOR field has a length of four bytes. A typical four byte int in SQL Server has a maximum value of 2147483647. If it’s possible to load billions of rows into a single delta rowgroup then we may run out of values for the CSILOCATOR field.

Of course, a single delta rowgroup cannot hold more than 1048576 rows. As you can see in this example, SQL Server does not always reuse freed up values for the CSILOCATOR field. The table currently has two rows, yet the field has advanced to 999. The right pattern of deletes, inserts, and updates should allow the CSILOCATOR to continue to grow without running out of room for rows in the delta rowgroup.

As a final note, I cannot prove that the CSILOCATOR field corresponds to the clustered index, but it certainly seems to serve the function of a uniqueifier that would be needed for said clustered index.

Running up the score


I need to find a relatively efficient way to advance the CSILOCATOR because I need to do it over 2 billion times, if my theory is correct about the maximum allowed value. Both updating all of the rows in a delta rowgroup and deleting and reinserting advance the CSILOCATOR. I expected that small batch sizes would work best, and they did. For my table’s schema, the sweet spot for updates is about 275 rows and the sweet spot for delete/inserts is about 550 rows. Delete/inserts appeared to be faster than updates for the purpose of constantly reloading the same rows over and over.

Strategies that use multiple CPU cores are possible, but I wanted to do other work on this PC and didn’t want to listen to a loud fan all day. Here’s what the final testing code looked like:

DROP TABLE IF EXISTS dbo.delta_store_test;

CREATE TABLE dbo.delta_store_test (
	ID TINYINT NOT NULL,
	INDEX CCI CLUSTERED COLUMNSTORE
);


DROP TABLE IF EXISTS dbo.LOG_TABLE;

CREATE TABLE dbo.LOG_TABLE (
	log_time DATETIME,
	loop_count INT,
	PRIMARY KEY (log_time)
);

GO

DROP TABLE IF EXISTS dbo.delta_store_source;
CREATE TABLE dbo.delta_store_source (
	ID TINYINT NOT NULL
);

INSERT INTO dbo.delta_store_source
SELECT TOP (550) 1
FROM master..spt_values t1
OPTION (MAXDOP 1);

GO

CREATE OR ALTER PROCEDURE #p AS
BEGIN
	SET NOCOUNT ON;

	DECLARE @loops INT = 0;

	WHILE @loops <= 8000000
	BEGIN
		DELETE FROM dbo.delta_store_test

		INSERT INTO dbo.delta_store_test
		SELECT 1
		FROM dbo.delta_store_source WITH (TABLOCK);

		SET @loops = @loops + 1;

		IF @loops % 10000 = 0
		BEGIN
			INSERT INTO dbo.LOG_TABLE
			VALUES (GETDATE(), @loops);
		END;
	END;
END;

GO

EXEC #p;

If you’re wondering about the temporary stored procedure creation, it’s a habit that I’ve gotten into whenever I write a T-SQL while loop. While not applicable here, very fast loops can incur ASYNC_NETWORK_IO overhead due to the passing of DONE tokens to the client.

Winning the game


After about seven hours the code reaches its glorious end:

Msg 666, Level 16, State 2, Procedure #p, Line 11 [Batch Start Line 26]
The maximum system-generated unique value for a duplicate group was exceeded for index with partition ID 72057596406595584. Dropping and re-creating the index may resolve this; otherwise, use another clustering key.

I loaded a few more rows into the table until I was unable to insert even one row. Using DBCC PAGE and friends again, we can see that the CSILOCATOR has a very large value of 2147483646.

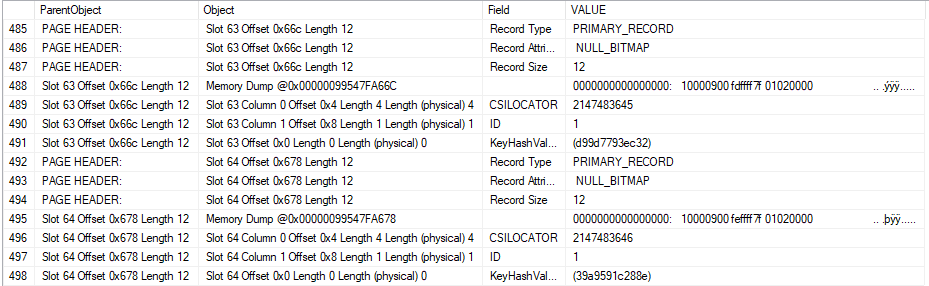
Issuing a REBUILD does resolve the issue because it wipes away our sins, as REBUILDs often do. Naturally using another clustering key is not an option.

Joe: 1

Microsoft: 0

The cost of playing


My desktop computer has an intel core i5-4670 processor. Intel claims a TDP of 84 watts. Using CPUID HWMonitor, it looks like my CPU uses about 15 W of additional power when running the workload. It’s a single core workload, so I feel that 15 W is reasonable. 15 watts is 0.015 kW, and when used over 7 hours it translates to 0.105 kWh. My last electric bill has a rate of $0.11663 per kWh, so the total cost of this test comes out to about 1.2 cents. I will be sending Erik an invoice.

Final thoughts


It is possible to hit error 666 when maliciously loading data into a columnstore index. It requires loading over 2 billion rows into the same delta rowgroup, so it’s difficult to think of a production scenario that would lead to this outcome. For those of you with eccentric workloads that give cause for concern, you can roughly check if you are running of IDs by running a query similar to the following for each columnstore table:

SELECT 2147483647 - 1 - MAX(CAST(SUBSTRING(%%physloc%%, 5, 4) AS INT)) REMAINING_CSILOCATORS
FROM dbo.delta_store_test;

Thanks for reading!

Underused sp_WhoIsActive capabilities: @delta_interval

Great Ghost


In the last post, we looked at how to see if your query is misbehaving, or if things are running normally.

Note that I didn’t say “good” here. Just normal.

For you.

What Have You Done For Me Lately?


Using sp_WhoIsActive in a slightly different way, we can see what a query has been up to over a duration of our choosing.

The delta columns are what happened over the span of time we pick. The columns that come back normally are cumulative to where the query is at now.

So for a 5 seconds interval:

EXEC sp_WhoIsActive @delta_interval = 5;
sp_WhoIsActive Results
Stacked

I’m stacking a couple screens shots from the normal single line of results, because they’re a little too wide all at once.

What deltas can help you figure out is how “active” your query really is.

In other words, it can answer the question: is my query stuck, or is my query doing something?

As an example, here’s a query that opened a transaction, ran an update, and then… sat there.

sp_WhoIsActive Results

Over all, we’ve done 4.4 million reads, 80k writes, and used about 7k ms of CPU.

But in the last five seconds, we haven’t done anything at all.

Thanks for reading!

Going Further


If this is the kind of SQL Server stuff you love learning about, you’ll love my training. I’m offering a 75% discount to my blog readers if you click from here. I’m also available for consulting if you just don’t have time for that and need to solve performance problems quickly.

Underused sp_WhoIsActive Capabilities For Troubleshooting SQL Server: @get_avg_time

Ablazemalls


Look, it’s impressive enough that sp_WhoIsActive works as well as it does. Most people who’ve been using it for a while are familiar with using @get_plans to retrieve query plans, or @get_locks to see locking information. I’m gonna spend a couple posts talking about less well known flags that I really like.

We’re gonna start off with one that can help you figure out if a particular query is misbehaving, or if things are just cruising along normally.

Nipples


I’ve got a stored procedure. What it does is unimportant. What’s important is that it’s sensitive to parameter sniffing.

We may not know this walking into an emergency, but we can figure it out pretty quickly using sp_WhoIsActive.

EXEC sp_WhoIsActive @get_avg_time = 1;
sp_WhoIsActive Results
Breathe Easy

This’ll give us back the usual information about how long our query has been running, but now right next to it is another column that ends in (avg).

When you use this switch, sp_WhoIsActive goes into the plan cache and looks at how long a particular query runs for on average.

If that number is much lower than how long the query has been running for, and it isn’t being blocked, you just might have a case of parameter sniffing on your hands.

Thanks for reading!

Going Further


If this is the kind of SQL Server stuff you love learning about, you’ll love my training. I’m offering a 75% discount to my blog readers if you click from here. I’m also available for consulting if you just don’t have time for that and need to solve performance problems quickly.

Last Week’s Almost Definitely Not Office Hours: May 3

ICYMI


Last week’s thrilling, stunning, flawless episode of whatever-you-wanna-call-it.

Going Further


If this is the kind of SQL Server stuff you love learning about, you’ll love my training. I’m offering a 75% discount to my blog readers if you click from here. I’m also available for consulting if you just don’t have time for that and need to solve performance problems quickly.

The Only Thing Worse Than Optional Parameters For SQL Server Query Performance

Kitchen Stink


A lot has been written about “kitchen sink” queries. A couple of my favorites are by Aaron Bertrand and Gail Shaw.

Both articles have similar start and end points. But I’m going to start at an even worse point.

Catch All Parameters


This is the worst possible idea.

    CREATE OR ALTER PROCEDURE dbo.AwesomeSearchProcedure (@SearchString NVARCHAR(MAX))
    AS
    SET NOCOUNT, XACT_ABORT ON;
    SET STATISTICS TIME, IO OFF;
    BEGIN
    
    DECLARE @AltString NVARCHAR(MAX) = N'%'
    
    SELECT TOP (1000) p.OwnerUserId, p.Title, p.CreationDate, p.LastActivityDate, p.Body
    FROM dbo.Posts AS p
    WHERE p.OwnerUserId LIKE ISNULL(N'%' + @SearchString + N'%', @AltString)
    OR    p.Title LIKE ISNULL(N'%' + @SearchString + N'%', @AltString)
    OR    p.CreationDate LIKE ISNULL(N'%' + @SearchString + N'%', @AltString)
    OR    p.LastActivityDate LIKE ISNULL(N'%' + @SearchString + N'%', @AltString)
    OR    p.Body LIKE ISNULL(N'%' + @SearchString + N'%', @AltString);
        
    END;
    GO

It doesn’t get any better if you do this, either.

    SELECT TOP (1000) p.OwnerUserId, p.Title, p.CreationDate, p.LastActivityDate, p.Body
    FROM dbo.Posts AS p
    WHERE (p.OwnerUserId LIKE N'%' + @SearchString + N'%' OR @SearchString IS NULL)
    OR    (p.Title LIKE N'%' + @SearchString + N'%' OR @SearchString IS NULL)
    OR    (p.CreationDate LIKE N'%' + @SearchString + N'%' OR @SearchString IS NULL)
    OR    (p.LastActivityDate LIKE N'%' + @SearchString + N'%' OR @SearchString IS NULL)
    OR    (p.Body LIKE N'%' + @SearchString + N'%' OR @SearchString IS NULL);

Sample Run


In both cases, just searching for a single value results in a query that runs for >2 minutes.

    EXEC dbo.AwesomeSearchProcedure @SearchString = N'35004';
    GO

The problem is that we’re just searching for an OwnerUserId, but SQL Server doesn’t know that.

The query plan looks like this:

Badness

See that Filter? That’s where we do all of our search work. We scan the whole Posts table, and push every row across the pipe to the Filter.

Messy

Irritable


This pattern might work on a small amount of data, but like most things that are efficient in small doses this will quickly fall apart when your database reaches a mature size.

My example is pretty simple, too, just hitting one table. In real life, you monsters are going this across joins, throwing in row numbers, distincts, and ordering by the first 10 columns.

It only gets worse as it gets more complicated.

Thanks for reading!

Going Further


If this is the kind of SQL Server stuff you love learning about, you’ll love my training. I’m offering a 75% discount to my blog readers if you click from here. I’m also available for consulting if you just don’t have time for that and need to solve performance problems quickly.