Informational vs. Relational Columns In SQL Server Queries, And How That Impact Performance

Quarrelin’


The next time you’re writing a query, I want you to try something in your head: Break the columns down into two groups.

  • Informational: Columns you’re only selecting
  • Relational: Columns that show up below the “from” clause

There may be some crossover, and that’s okay. If you’re selecting a short enough list of columns, and doing a group by, there might be total crossover.

But I’m willing to bet most of your queries don’t look that neat and tidy.

SQL Server Query
Silk Stalkings

Your queries probably have a distinctly more robust list of columns, probably with a DISTINCT to fend off the dozen or so left joins for just in case columns.

And that’s… Okay, let’s reserve judgement. Instead, let’s figure out a better way to get them all.

Narrowin’


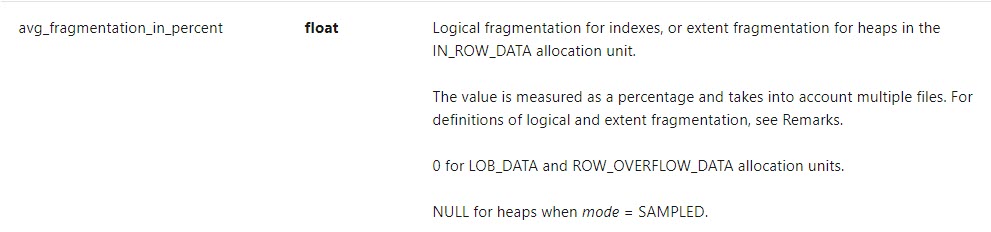
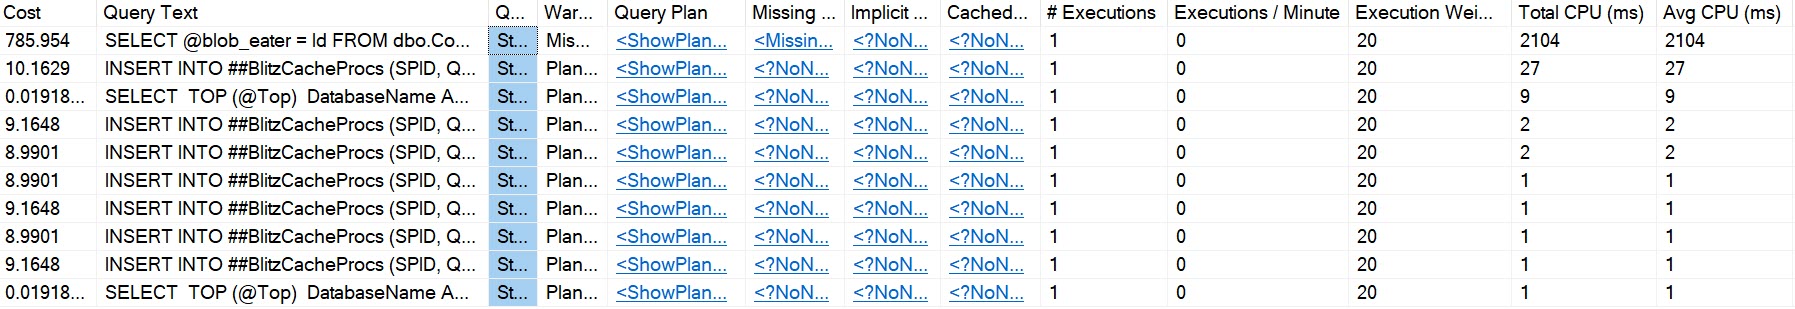
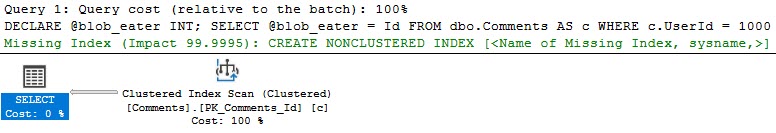
That long list of columns in your query has weight to it. Not physical weight, exactly. But to the optimizer, it represents a bunch of weight in CPU and I/O.

The more columns you want to drag around, the harder you make your queries work. Especially because the architect who migrated your app from Access to SQL Server 2000 made every column as wide as possible.

That weight changes a lot of things:

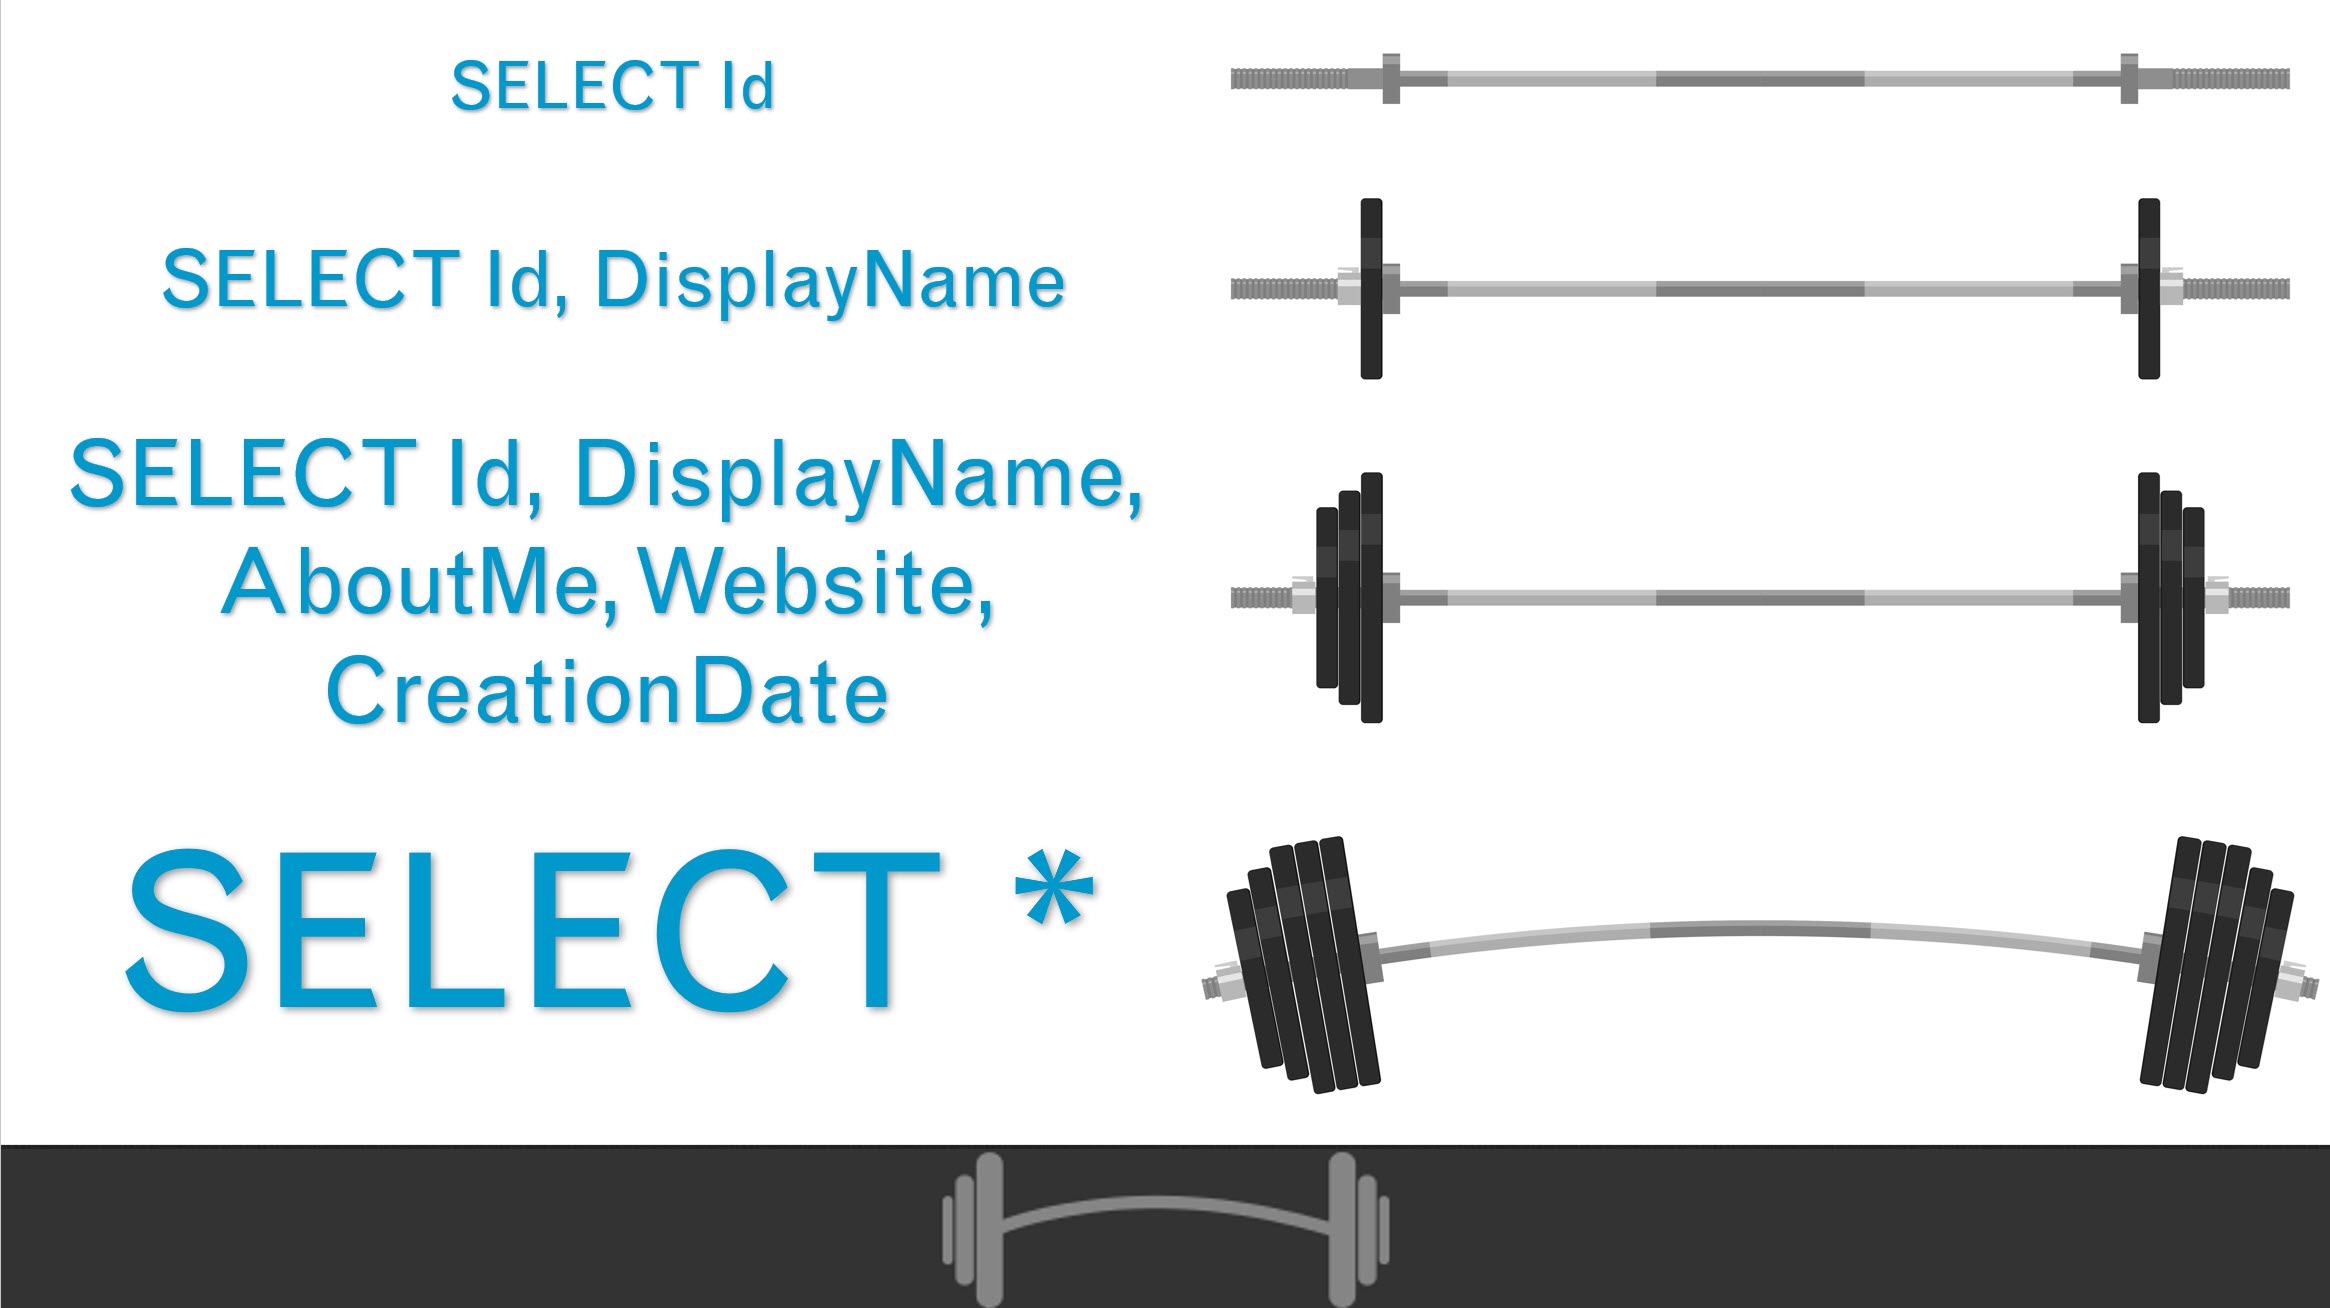
  • How much memory your query asks for
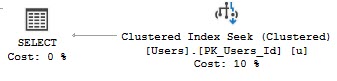
  • Which indexes your query uses
  • The kind of operators the optimizer chooses

And I know, you need to show people that data. I’m not opposed to that.

I’m only opposed to when you’re doing it.

Filterin’


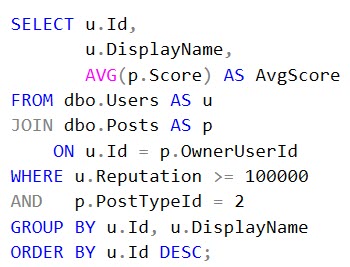
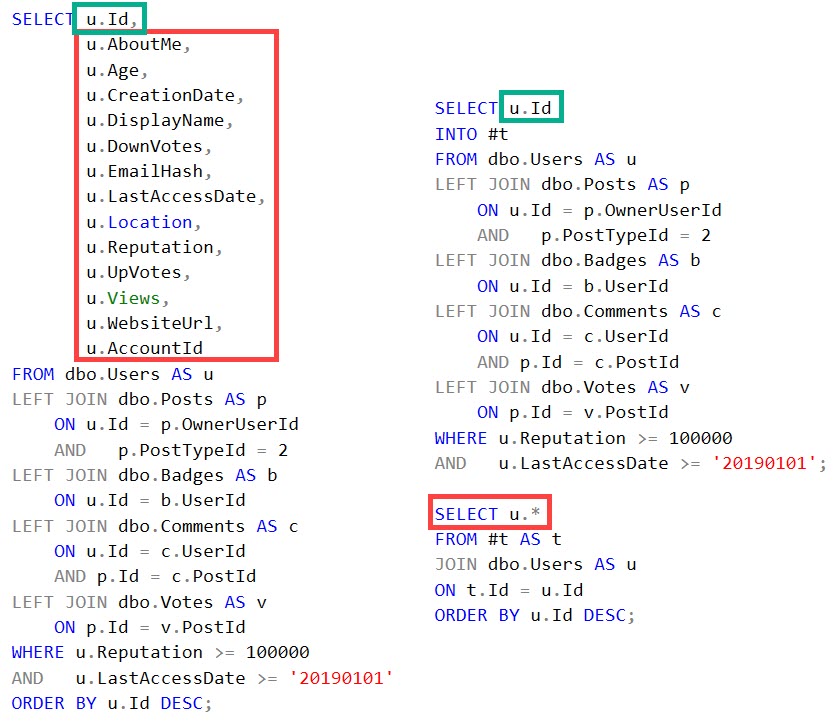
The reason why I want you to separate these concepts mentally is so that when you’re writing a query and you know you have to show people a lot of columns, to not try to show them all immediately. Instead, just take the columns you need to relate tables and put them in a temp table. It’s fine if you have your joins and where clause stuff here.

The idea is to get a narrow list of columns for a filtered set of rows. We’ll worry about the informational stuff after we get the relational stuff.

Something like this:


SQL Server Queries
Pleasant things

Splainin’


If you avoid getting long lists of columns up front, you can:

  • Avoid overly wide indexes, and just index for the important stuff in the join/where clause
  • Be less sensitive to parameter sniffing, because there will be less variability in plan choices
  • Need fewer resources to push queries with, because less data is moving about

Thanks for reading!

Going Further


If this is the kind of SQL Server stuff you love learning about, you’ll love my training. I’m offering a 75% discount to my blog readers if you click from here. I’m also available for consulting if you just don’t have time for that and need to solve performance problems quickly.

Why SQL Server Index Fragmentation Isn’t A Problem On Modern Storage Hardware

Two Dollars


My Dear Friend™ Sean recently wrote a post talking about how people are doing index maintenance wrong. I’m going to go a step further and talk about how the method your index maintenance scripts use to evaluate fragmentation is wrong.

If you look at how the script you use to decide whether or not you’re going to rebuild indexes works, and this goes for maintenance plans, too (I ran PROFILER LONG LIVE PROFILER GO TEAM PROFILER to confirm the query), you’ll see they run a query against dm_db_index_physical_stats.

All of the queries use the column avg_fragmentation_in_percent to measure if your index needs to be rebuilt. The docs (linked above) for that column have this to say:

fragmentation documentation
He cried

It’s measuring logical fragmentation. Logical fragmentation is when pages are out of order.

If you’re on decent disks, even on a SAN, or if you have a good chunk of memory, you’ll learn from Sean’s Great Post© that this is far from the worst fate to befall your indexes. If you keep up your stats maintenance, things will be okay for you.

Cache Rules


If you’re the kind of person who cares about various caches on your server, like the buffer pool or the plan cache, then you’d wanna measure something totally different. You’d wanna measure how much free space you have on each page, because having a bunch of empty space on each page means your data will take up more space in memory when you read it in there from disk.

You could do that with the column avg_page_space_used_in_percent.

BUT…

fragmentation documentation
Oops

Your favorite index maintenance solution will do you a favor and only run dm_db_index_physical_stats in LIMITED mode by default. That’s because taking deeper measurements can be rough on a server with a lot of data on it, and heck, even limited can run for a long time.

But if I were going to make the decision to rebuild an index, this is the measurement I’d want to use. Because all that unused space can be wasteful.

The thing is, there’s not a great correlation between avg_fragmentation_in_percent being high, and avg_page_space_used_in_percent.

Local Database


When looking at fragmentation in my copy of the Stack Overflow 2013 database:

SQL Server index fragmentation details
Scum

Both of those tables are fragmented enough to get attention from a maintenance solution, but rebuilding only really helps the Posts table, even though we rebuilt both.

On the comments table, avg_page_space_used_in_percent goes down a tiny bit, and Posts gets better by about 10%.

The page count for Comments stays the same, but it goes down by about 500k for Posts.

This part I’m cool with. I’d love to read 500k less pages, if I were scanning the entire table.

But I also really don’t wanna be scanning the entire table outside of reporting or data warehouse-ish queries.

If we’re talking OLTP, avoiding scanning large tables is usually worthwhile, and to do that we create nonclustered indexes that help our queries find data effectively, and write queries with clear predicates that promote the efficient use of indexes.

Right?

Right.

Think About Your Maintenance Settings


They’re probably at the default of 5% and 30% for reorg and rebuild thresholds. Not only are those absurdly low, but they’re not even measuring the right kind of fragmentation. Even at 84% “fragmentation”, we had 75% full pages.

That’s not perfect, but it’s hardly a disaster.

Heck, you’ve probably been memed into setting fill factor lower than that to avoid fragmentation.

Worse, you’re probably looking at every table >1000 pages, which is about 8 MB.

If you have trouble reading and keeping 8 MB tables in memory, maybe it’s time to go shopping.

Thanks for reading!

Going Further


If this is the kind of SQL Server stuff you love learning about, you’ll love my training. I’m offering a 75% discount to my blog readers if you click from here. I’m also available for consulting if you just don’t have time for that and need to solve performance problems quickly.

SQL Saturday Portland: One Week To Go!

Training Daze


Right now, we’re only one week out from SQL Saturday Portland.

I’ll be delivering my Total Server Tuning session, where you’ll learn all sorts of horrible things about SQL Server.

To get ready for the session, you’ll need a local version of SQL Server Developer Edition, 2017 + whatever the latest CU is.

I’m writing this a few weeks out, and who knows what kind of antics Microsoft will get up to.

Will they release, un-release, re-release, re-un-release, and then delete all internet history of another CU?

STAY TUNED!

For Sure


One thing you’ll definitely need is a copy of the StackOverflow2013 database.

Seats are limited, so hurry on up and get yourself one before you get FOMO in your MOJO.

Thanks for reading!

Going Further


If this is the kind of SQL Server stuff you love learning about, you’ll love my training. I’m offering a 75% discount to my blog readers if you click from here. I’m also available for consulting if you just don’t have time for that and need to solve performance problems quickly.

SQL Server 2019: Please Increase the RAM Limit For Standard Edition

C’monnnn


It’s that time of the release cycle again! Microsoft has published the stuff that different editions of SQL Server 2019 will do or not do.

First up, I don’t disagree with any of the feature choices. They’re fine.

Second up, the RAM limit on Standard Edition is still a cruel, cruel mockery.

Here’s Why


I could point out that I have a desktop with 128 GB of RAM, or that current gen laptops allow up to 128 GB of RAM.

Sure, I could point out that many larger instance sizes in Azure and AWS make no sense for Standard Edition (even with constrained CPUs in Azure).

I could trot out charts and graphs and talk about how the limit is only for the buffer pool.

But the bottom line is this: If the automatic and intelligent query tuning features are that powerful, then giving Standard Edition either a 256GB buffer pool cap, or a buffer pool cap that scales with CPU licensing spend still won’t make it competitive, because hardware isn’t solving the kind of problems that those features do.

If they’re not, they shouldn’t be Enterprise only. Clearly hardware is the differentiator.

Increasing the buffer pool limit is a free choice


Microsoft gave away most of the important programmability features with 2016 SP1 to Standard Edition, and they’re giving up TDE in 2019.

Those are features that cost real human time to develop, support, and maintain. A larger buffer pool costs nothing.

Thanks for reading!

Going Further


If this is the kind of SQL Server stuff you love learning about, you’ll love my training. I’m offering a 75% discount to my blog readers if you click from here. I’m also available for consulting if you just don’t have time for that and need to solve performance problems quickly.

Stuff I Learned In Joe Obbish’s Precon On Column Store

Joy Of Joys


Speaking daily with Joe is one of the best choices I’ve ever made. Not only do I regularly learn things about SQL Server that I would probably not run into, but he’s quite a character. That’s why when I started to help organize SQL Saturday NYC, I was more than happy to offer him a precon.

While it may be impractical to have more Joes in the world, it’s very practical to have people learn from him.

So what did I learn from his precon?

Column store is Different


How you load data into tables matters a lot. Not only is the number of rows you insert at a time crucial, but all sorts of things from the column data types to the inserted values can work for or against you. This can affect compression, query performance, and how well data loading scales.

The other place where column store differs from row store indexes is that maintenance is important. Yes, the very maintenance that’s an absurd crutch to row store indexes can be make or break to column store performance. Right now, the only two solutions that have special rules for column store indexes are Niko Neugebauer’s CISL scripts, and the Tiger Team’s Adaptive Defrag. Other maintenance solutions aren’t taking the right things into account.

Modifications Are Harsh! Deleting and Updating rows in column store indexes can have some nasty side effects — the kind that make maintenance necessary.

Performance Tuning Is Wild


If you’re dealing with column store indexes, chances are you’re dealing with some really big tables. While that by itself doesn’t change how you tune queries, you do have to remind yourself that “missing indexes” aren’t going to be the answer. You also need to keep in mind that some operators and query constructs don’t allow for good segment/row group elimination. You can think of those like partition elimination in a partitioned table. You can skip large amounts of data irrelevant to your query.

Strings Are The Devil


That’s all. Avoid them.

Details Are In The Devil


I’m not giving away too much here, because I hope Joe will deliver this again. If you see it pop up in your area, buy tickets ASAP.

Thanks for reading!

Going Further


If this is the kind of SQL Server stuff you love learning about, you’ll love my training. I’m offering a 75% discount to my blog readers if you click from here. I’m also available for consulting if you just don’t have time for that and need to solve performance problems quickly.

In SQL Server, Isolation Levels Don’t Control Locking

Different Engines


I seem to have gotten quite a few questions about this lately, so I’m going to write down some thoughts here.

It’s probably crappy form for a blog post, but what the heck.

Queries Decide The Isolation Level


They can choose anything from read uncommitted to serializable. Read uncommitted is the more honest term for what’s going on. When people see the “nolock” hint, they often assume that means their query won’t take any locks. What it really means is that it will ignore locks taken by other queries. The more accurate term would be “norespect”. This is probably what leads to confusion: reading uncommitted data sounds different than not locking data. But they’re both the same.

The Storage Engine Decides Which Locks Are Used


And if lock escalation is attempted. The storage engine will respect the query’s isolation level, and any table-level settings related to lock granularity, like not allowing row or page locks. It may not fully respect any query level hints regarding lock granularity.

One thing that helps reduce the chance of lock escalation is having a good index to help your modification query find rows. Though if you need to find a million rows, don’t expect SQL Server to happily take a million row locks, just because of an index.

Batching modifications is one way to avoid lock escalation when you need to modify a lot of rows, though it isn’t always possible to do this. If for some reason you need to roll the entire change back, you’d have to keep track of all the committed batches somewhere, or wrap the entire thing in a transaction (which would defeat the purpose, largely).

One thing that increases the chance of lock escalation is having many indexes present on a table. For inserts and deletes, all of those indexes will get touched (unless they’re filtered around the rows to be inserted or deleted. For updates, any indexes containing the column(s) to be modified will need to be touched (again, barring filtering around the updated portion). Lock counts are cumulative across objects.

Not All “Blocking” Is “Locking”


In other words, when you see queries being blocked, there may not be an LCK wait involved. Some “blocking” can happen with resource contention, whether it’s physical (CPU, memory, disk), logical (like if there’s latch or spinlock contention), or even programmatic (if you’re lucky enough to see the source code).

This can happen in tempdb if you’re creating a lot of objects rapid-fire, even if you’re using table variables. Table variables can avoid some of the overhead that temp tables incur under high frequency execution, but not all of it.

Thanks for reading!

Going Further


If this is the kind of SQL Server stuff you love learning about, you’ll love my training. I’m offering a 75% discount to my blog readers if you click from here. I’m also available for consulting if you just don’t have time for that and need to solve performance problems quickly.

Why You Should Look At Your Plan Cache By Averages, Too

Like vim, I Can’t Quit You


I’m going to be honest with you, I have no idea how most people who use sp_BlitzCache run it.

Most people I talk to are like “oh, that’s not sp_Blitz?”

Ahem.

Anyway, I’m going to show you a cool way to look at your plan cache a little bit more differenter than usual.

Average The Life


When you run it and use @SortOrder, it will sort by the “total” column of whichever metric you pick. CPU, Reads, Duration, Writes — you get the picture.

But you can also run it to sort by what uses the most of a metric on average.

Sure, totals point out what runs a lot — but things that run a lot might not have much to tune.

You can make a note like “Should we be caching this?” for you developers to laugh at.

Here are some examples:

EXEC sp_BlitzCache @SortOrder = 'avg cpu';
EXEC sp_BlitzCache @SortOrder = 'avg duration';
EXEC sp_BlitzCache @SortOrder = 'avg reads';
EXEC sp_BlitzCache @SortOrder = 'avg writes';
EXEC sp_BlitzCache @SortOrder = 'avg spills';
EXEC sp_BlitzCache @SortOrder = 'memory grant';

No, memory grant isn’t an average. But it can show you some real bangers.

Here’s an example of why you should use those average sort orders:

EXEC sp_BlitzCache @SortOrder = 'cpu'
Public Visitation

Those queries all executed a whole bunch. They racked up a bunch of total CPU time.

But looking at any of those execution plans, aside from not running the query so much, there’s nothing really to tune.

We met at GitHubs

But if we look at the plan cache by averages…

EXEC sp_BlitzCache @SortOrder = 'avg cpu'
Told her she take me back

We get… Alright, look. Those queries all have recompile hints. They still show up.

But the top one is interesting! It has way higher average CPU than the rest.

SQL Server Query Plan
I’ll make more pull requests

This query plan is a little bit different. It’s scanning the clustered index rather than seeking, and it’s got a missing index request.

In total, it wasn’t using a lot of CPU compared to other queries, but on average it was a lot suckier.

SQL University


I always look at the averages, because you can find some really interesting plans in there.

Sure, you might find some one-off stuff that you can ignore, but that’s what @MinimumExecutionCount is for.

You did read the documentation, didn’t you?

Queries that use a lot of resources on average often stand a good chance at being tuned, where queries that just use a lot of resources because of how frequently they run may not.

Anyway, that’ll be $1.

Thanks for reading!

Going Further


If this is the kind of SQL Server stuff you love learning about, you’ll love my training. I’m offering a 75% discount to my blog readers if you click from here. I’m also available for consulting if you just don’t have time for that and need to solve performance problems quickly.

SQL Saturday Portland: Two Weeks To Go!

Training Daze


Right now, we’re only two weeks out from SQL Saturday Portland.

The Oregon one, not the Maine one.

I’ll be delivering my Total Server Tuning session


Where you’ll learn all sorts of horrible things about SQL Server. The kind of stuff that no one else wants to talk about.

Here’s the promo video that I recorded it for SQL Bits, which I still love today.

Seats are limited, so hurry on up and get yourself one before you get FOMO in your MOJO.

Thanks for reading!

Going Further


If this is the kind of SQL Server stuff you love learning about, you’ll love my training. I’m offering a 75% discount to my blog readers if you click from here. I’m also available for consulting if you just don’t have time for that and need to solve performance problems quickly.

Live SQL Server Q&A!

ICYMI


Last week’s thrilling, stunning, flawless episode of whatever-you-wanna-call-it.

Going Further


If this is the kind of SQL Server stuff you love learning about, you’ll love my training. I’m offering a 75% discount to my blog readers if you click from here. I’m also available for consulting if you just don’t have time for that and need to solve performance problems quickly.

SQL Server Needs Built-In Health Check Views

Goes To The Runner


Just like SQL Server needs centralized performance views, SQL Server needs easy views into health data.

Right now, there’s too much spread around too many different places to be helpful to people.

You ever try to assemble a backup report? Worse, what about things you don’t know about?

I seem to catch people weekly with the wrong type of page verification across a bunch of databases.

You shouldn’t need special scripts to figure out when you last ran DBCC CHECKDB.

What Should They Cover?


In a centralized schema, maybe called health (or something else that would stick out to end users — not just an ocean of “sys” views):

  • Backups (schedule, failures)
  • CHECKDB (last good, failures)
  • Agent Job Failures/Operators Notified
  • Bad Settings or configurations (like shrinking or auto close)
  • Server Events, like restarts, memory dumps, high severity errors, etc.

That’s a pretty good start. It won’t replace All Your Favorite Scripts™, but it’ll help a lot of people out who just don’t know where to start.

Thanks for reading!

Going Further


If this is the kind of SQL Server stuff you love learning about, you’ll love my training. I’m offering a 75% discount to my blog readers if you click from here. I’m also available for consulting if you just don’t have time for that and need to solve performance problems quickly.