How Many Indexes Is Too Many In SQL Server?

To Taste


Indexes remind me of salt. And no, not because they’re fun to put on slugs.

More because it’s easy to tell when there’s too little or too much indexing going on. Just like when you taste food it’s easy to tell when there’s too much or too little salt.

Salt is also one of the few ingredients that is accepted across the board in chili.

To continue feeding a dead horse, the amount of indexing that each workload and system needs and can handle can vary quite a bit.

Appetite For Nonclustered


I’m not going to get into the whole clustered index thing here. My stance is that I’d rather take a chance having one than not having one on a table (staging tables aside). Sort of like a pocket knife: I’d rather have it and not need it than need it and not have it.

At some point, you’ve gotta come to terms with the fact that you need nonclustered indexes to help your queries.

But which ones should you add? Where do you even start?

Let’s walk through your options.

If Everything Is Awful


It’s time to review those missing index requests. My favorite tool for that is sp_BlitzIndex, of course.

Now, I know, those missing index requests aren’t perfect.

There are oodles of limitations, the way they’re presented is weird, and there are lots of reasons they may not be there. But if everything is on fire and you have no idea what to do, this is often a good-enough bridge until you’ve got more experience, or more time to figure out better indexes.

I’m gonna share an industry secret with you: No one else looking at your server for the first time is going to have a better idea. Knowing what indexes you need often takes time and domain/workload knowledge.

If you’re using sp_Blitzindex, take note of a few things:

  • How long the server has been up for: Less than a week is usually pretty weak evidence
  • The “Estimated Benefit” number: If it’s less than 5 million, you may wanna put it to the side in favor of more useful indexes in round one
  • Duplicate requests: There may be several requests for indexes on the same table with similar definitions that you can consolidate
  • Insane lists of Includes: If you see requests on (one or a few key columns) and include (every other column in the table), try just adding the key columns first

Of course, I know you’re gonna test all these in Dev first, so I won’t spend too much time on that aspect ?

If One Query Is Awful


You’re gonna wanna look at the query plan — there may be an imperfect missing index request in there.

SQL Server Query Plan
Hip Hop Hooray

And yeah, these are just the missing index requests that end up in the DMVs added to the query plan XML.

They’re not any better, and they’re subject to the same rules and problems. And they’re not even ordered by Impact.

Cute. Real cute.

sp_BlitzCache will show them to you by Impact, but that requires you being able to get the query from the plan cache, which isn’t always possible.

If You Don’t Trust Missing Index Requests


And trust me, I’m with you there, think about the kind of things indexes are good at helping queries do:

  • Find data
  • Join data
  • Order data
  • Group data

Keeping those basic things in mind can help you start designing much smarter indexes than SQL Server can give you.

You can start finding all sorts of things in your query plans that indexes might change.

Check out my talk at SQLBits about indexes for some cool examples.

And of course, if you need help doing it, I’m here for just that sort of thing.

Thanks for reading!

Going Further


If this is the kind of SQL Server stuff you love learning about, you’ll love my training. I’m offering a 75% discount to my blog readers if you click from here. I’m also available for consulting if you just don’t have time for that and need to solve performance problems quickly.
SQL Server Performance Problem Solving: Why I Love Consulting

30 Second Abs


I love helping people solve their problems. That’s probably why I stick around doing what I do instead of opening a gym.

That and I can’t deal with clanking for more than an hour at a time.

Recently I helped a client solve a problem with a broad set of causes, and it was a lot of fun uncovering the right data points to paint a picture of the problem and how to solve it.

Why So Slow?


It all started with an application. At times it would slow down.

No one was sure why, or what was happening when it did.

Over the course of looking at the server together, here’s what we found:

  • The server had 32 GB of RAM, and 200 GB of data
  • There were a significant number of long locking waits
  • There were a significant number of PAGEIOLATCH_** waits
  • Indexes had fill factor of 70%
  • There were many unused indexes on important tables
  • The error log was full of 15 second IO warnings
  • There was a network choke point where 10Gb Ethernet went to 1Gb iSCSI

Putting together the evidence


Alone, none of these data points means much. Even the 15 second I/O warnings could just be happening at night, when no one cares.

But when you put them all together, you can see exactly what the problem is.

Server memory wasn’t being used well, both because indexes had a very low fill factor (lots of empty space), and because indexes that don’t help queries had to get maintained by modification queries. That contributed to the PAGEIOLATCH_** waits.

Lots of indexes means more objects to lock, which generally means more locking waits.

Because we couldn’t make good use of memory, and we had to go to disk a lot, the poorly chosen 1Gb iSCSI connections were overwhelmed.

To give you an idea of how bad things were, the 1Gb iSCSI connections were only moving data at around USB 2 speeds.

Putting together the plan


Most of the problems could be solved with two easy changes: getting rid of unused indexes, and raising fill factor to 100. The size of data SQL Server would regularly have to deal with would drop drastically, so we’d be making better use of memory, and be less reliant on disk.

Making those two changes fixed 90% of their problems. Those are great short term wins. There was still some blocking, but user complaints disappeared.

We could make more changes, like adding memory to be even less reliant on disk, and replacing the 1Gb connections, sure. But the more immediate solution didn’t require any downtime, outages, or visits to the data center, and it bought them time to carefully plan those changes out.

If you’re hitting SQL Server problems that you just can’t get a handle on, drop me a line!

Thanks for reading!

Going Further


If this is the kind of SQL Server stuff you love learning about, you’ll love my training. I’m offering a 75% discount to my blog readers if you click from here. I’m also available for consulting if you just don’t have time for that and need to solve performance problems quickly.

Identifying Performance Problems With SQL Server Virtual Machines

Errywhere


Everyone’s on VMs these days. That’s cool. Nothing against computers.

But here’s how people screw up SQL Server on VMs bigtime:

  • Fewer than 4 cores (this is a licensing minimum)
  • Multiple single-core sockets
  • Not fully reserving memory
  • Oversubscribing hosts

Why are these bad?

  • 4 cores is the minimum license
  • Single CPU sockets often leave Standard Edition with unusable CPUs
  • Memory gets siphoned off to other processes
  • CPU intensive workloads can’t get a thread in edge-wise

Pox


This doesn’t even touch more advanced concepts, like CPU ready time, NUMA alignment, power modes, or the impact of the hot add option.

Even when you get all that right, you’re left with storage waits that make trans-Pacific flights look tolerable.

I often find myself pointing people to this article by Jonathan Kehayias: Troubleshooting CPU Performance on VMware.

Also, the official guide for SQL Server from VMware. They update the guide fairly often, and I’m linking to one from April of 2019.

Make sure you’re looking at the latest and greatest.

Cloudness


The Cloud is basically an AirBnB for your server. Again, that’s cool.

They’re still VMs.

But the point is: pay close attention to how cloud VMs are set up for SQL server.

They’re not doing any of the stuff I listed up there.

Sure, storage and networking still kinda sucks, even if you pay for the good stuff.

But no one puts out the nice linens for strangers.

The point here is that they want you to complain as little as possible for the price.

Part of that is not goofing up the obvious stuff.

Thanks for reading!

Going Further


If this is the kind of SQL Server stuff you love learning about, you’ll love my training. I’m offering a 75% discount to my blog readers if you click from here. I’m also available for consulting if you just don’t have time for that and need to solve performance problems quickly.
When Are Wait Stats Actually Useful For SQL Server Performance Tuning?

The People Who Stare At Plans


I’m going to be honest with you, dear readers. I’ve fallen out of like with wait stats.

Unless there’s a massive resource or blocking problem, they’re a bit bland.

Tuning a single query, I don’t look at them at all.

Sure, they can be a good detail when you’re painting an overall picture of a server, but they’re misleading a lot.

They could be more useful, if:

  • You knew when they happened
  • You knew which queries caused them
  • You knew which queries were impacted by them

Let’s say I look at your server. Let’s say I run any script that analyzes wait stats.

Even Your Worst


Holy cow, you sure have a lot of (THREADPOOL, RESOURCE_SEMAPHORE) waits here, pal.

You got a big problem with hardware.

Well, maybe.

Let’s say they happen at night, when no one’s around.

We could sit there all day hitting F5 and never see a sign of the problem.

It sure would be nice to know when they happened.

It Was Really Something


Not everyone’s server is a 24/7 performance nightmare.

Lots of people have servers that get steadily used from 9-5, but don’t really have spikes normally.

Except at the beginning or end of the month/year/quarter.

If you look at wait stats in general, the server might look very bored most of the time.

All those sums and averages smooth out over time.

Most people don’t always have a heart rate of 180 bpm, but they might for the 5 minutes they have a heart attack.

That’s sort of important.

The Sanest Days Are Mad


What if we see a lot of long lock waits?

I bet users are really mad about those.

Have you heard about our Lord and Savior, RCSI?

You’re definitely gonna need that.

Which database?

Oh, that logging database that users never query.

Darn.

Again, knowing which queries were on the giving and receiving end of that would be stellar.

Toolio, My Toolio


It’s not that wait stats themselves are dull, it’s the way we’re forced to look at them today.

You either have to hit F5 at the magic moment to catch them, log them on your own, or buck up for a monitoring tool.

It’s a matter of how and what, and when data gets logged for them, not a matter of tool quality.

I’d love to see a more complete picture of these things when trying to diagnose or troubleshoot issues.

Thanks for reading!

Going Further


If this is the kind of SQL Server stuff you love learning about, you’ll love my training. I’m offering a 75% discount to my blog readers if you click from here. I’m also available for consulting if you just don’t have time for that and need to solve performance problems quickly.
SQL Server 2019: Are Query Plans For Big Values Better For Performance

Outline


In SQL Server 2019, a few cool performance features under the intelligent query processing umbrella depend on cardinality estimation.

  • Batch Mode For Row Store (which triggers the next two things)
  • Adaptive Joins
  • Memory Grant Feedback

If SQL Server doesn’t estimate > 130k(ish) rows are gonna hop on through your query, you don’t get the Batch Mode processing that allows for Adaptive Joins and Memory Grant feedback. If you were planning on those things helping with parameter sniffing, you now have something else to contend with.

Heft


Sometimes you might get a plan with all that stuff in it. Sometimes you might not.

The difference between a big plan and little plan just got even more confusing.

Let’s say you have a stored procedure that looks like this:

CREATE OR ALTER PROCEDURE dbo.lemons(@PostTypeId INT)
AS
BEGIN

    SELECT OwnerUserId, 
	       PostTypeId,
		   SUM(Score * 1.0) AS TotalScore,
		   COUNT_BIG(*) AS TotalPosts
	FROM dbo.Posts AS p
	JOIN dbo.Users AS u
	    ON p.OwnerUserId = u.Id
	WHERE PostTypeId = @PostTypeId
	AND u.Reputation > 1
	GROUP BY OwnerUserId,
             PostTypeId
	HAVING COUNT_BIG(*) > 100;

END
GO

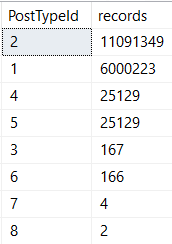
There’s quite a bit of skew between post types!

SQL Server Management Studio Query Results
Working my way down

Which means different parameters will get different plans, depending on which one comes first.

EXEC dbo.lemons @PostTypeId = 4;

EXEC dbo.lemons @PostTypeId = 1;

Fourry Friends


When we run four first, this is our plan:

SQL Server Query Plan
Disco Dancer

It’s not “bad”. It finishes in 116 ms.

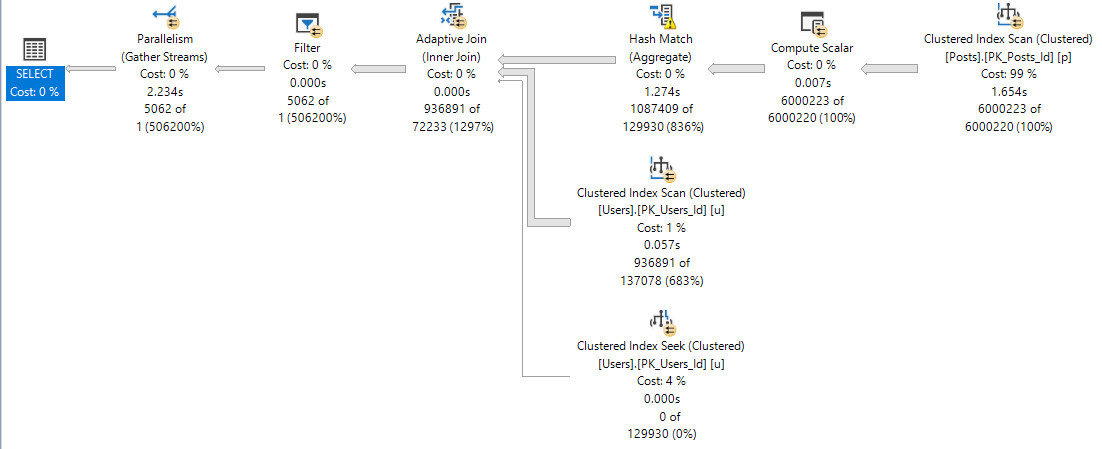
But when we run 1 next, it’s fewer well.

Less gooder?

You decide.

SQL Server Query Plan
Inching along

At 12 seconds, one might accuse our query of sub-par performance.

One and Lonely


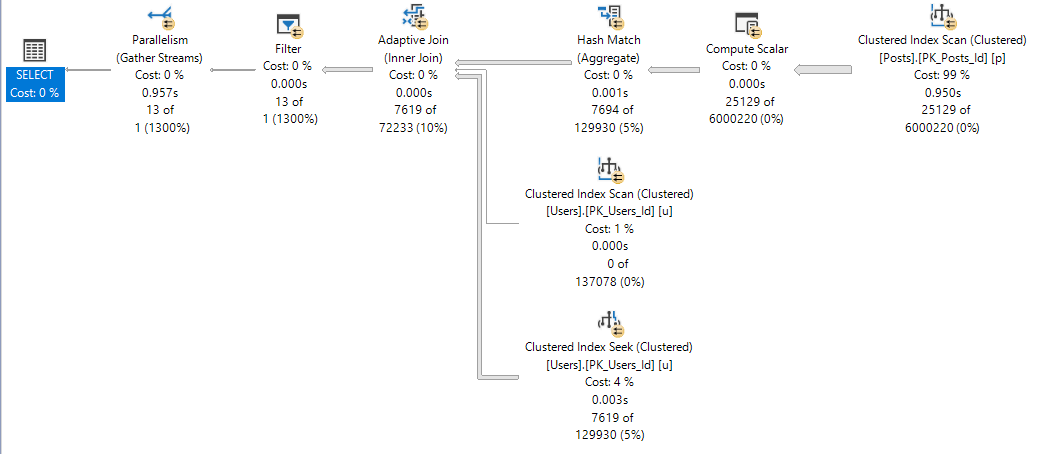
When one runs first, the plan is insanely different.

SQL Server Query Plan
22 2s

It’s about 10 seconds faster. And the four plan?

Not too shabby.

SQL Server Query Plan
Four play

We notice the difference between 116ms and 957ms in SSMS.

Are application end users aware of ~800ms? Sometimes I wonder.

Alma Matters


The adaptive join plan with batch mode operators is likely a better plan for a wider range of values than the small plan.

Batch mode is generally more efficient with larger row counts. The adaptive join means no one who doesn’t belong in nested loops hell will get stuck there (probably), and SQL Server will take a look at the query in between runs to try to find a happy memory grant medium (this doesn’t always work splendidly, but I like the effort).

Getting to the point, if you’re going to SQL Server 2019, and you want to get all these new goodies to help you avoid parameter sniffing, you’re gonna have to start getting used to those OPTIMIZE FOR hints, and using a value that results in getting the adaptive plan.

This has all the same pitfalls of shooting for the big plan in older versions, but with way more potential payoff.

I wish there was a query hint that pushed the optimizer towards picking this sort of plan, so we don’t have to rely on potentially changing values to optimize for.

Thanks for reading!

Going Further


If this is the kind of SQL Server stuff you love learning about, you’ll love my training. I’m offering a 75% discount to my blog readers if you click from here. I’m also available for consulting if you just don’t have time for that and need to solve performance problems quickly.
Does SQL Server Choose Multiple Indexes Based On Selectivity?

Will Travel


If you recall yesterday’s post, we added a couple two column indexes to the Posts table.

Each one helped a slightly different query, but either index would likely be “good enough”.

This post will focus on another common scenario I see, where people added many single column indexes over the years.

In this scenario, performance is much more variable.

Singletonary


Here are our indexes:

CREATE INDEX ix_spaces
ON dbo.Posts(ParentId);

CREATE INDEX ix_tabs
ON dbo.Posts(Score);

Taking the same queries from yesterday:

SELECT COUNT_BIG(*) AS records
FROM   dbo.Posts AS p
WHERE  p.ParentId < 1
AND    p.Score > 19000
AND 1 = (SELECT 1);

SELECT COUNT_BIG(*) AS records
FROM   dbo.Posts AS p
WHERE  p.ParentId > 21100000
AND    p.Score < 1
AND 1 = (SELECT 1);

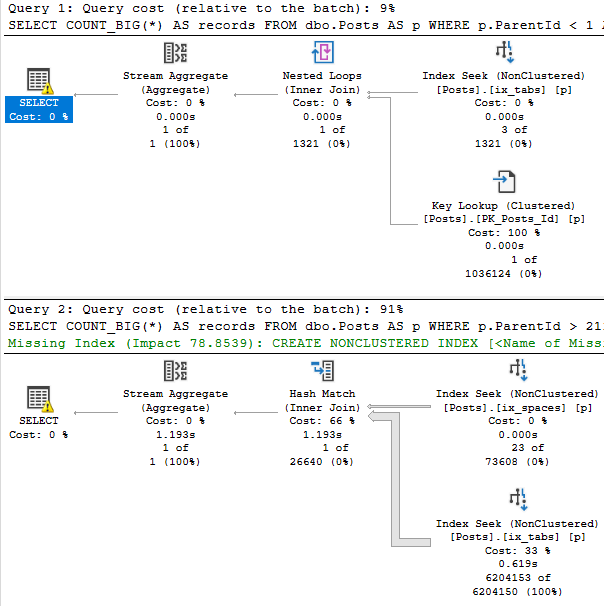
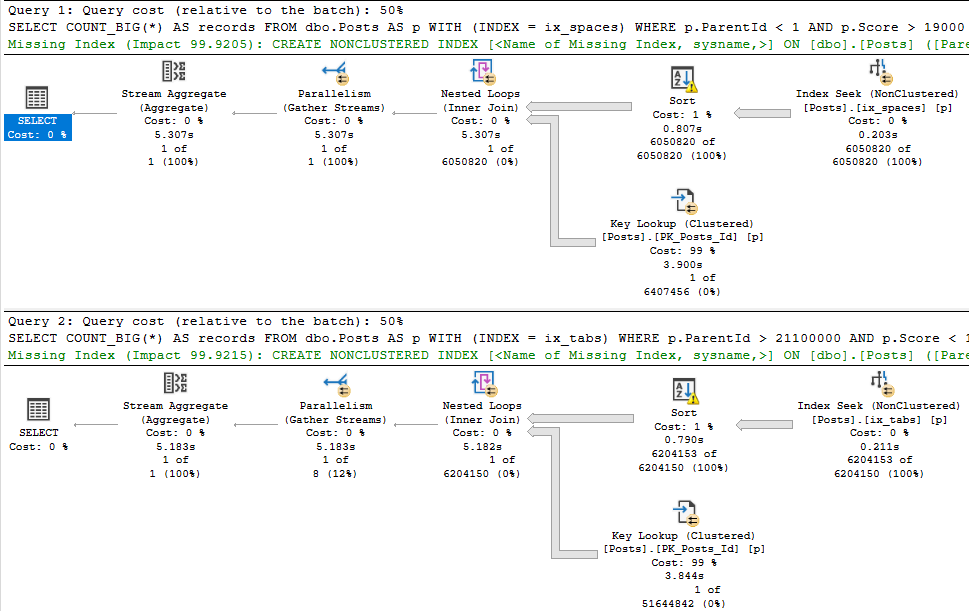
This is what the new plans look like:

SQL Server Query Plan
Curious

The first thing you may notice is that the top plan performs a rather traditional key lookup, and the bottom plan performs a slightly more exotic index intersection.

Both concepts are similar. Since clustered index key columns are present in nonclustered indexes, they can be used to either join a nonclustered index to the clustered index on a table, or to join two nonclustered indexes together.

It’s a nice trick, and this post definitely isn’t to say that either is bad. Index intersection just happens to be worse here.

Wait, But…


You may have noticed that both queries get pretty bad estimates. You might even be thinking about leaving me a comment to update stats.

The thing is that I created these indexes, which means they get stats built with a full scan, and it’s a demo database where nothing changes.

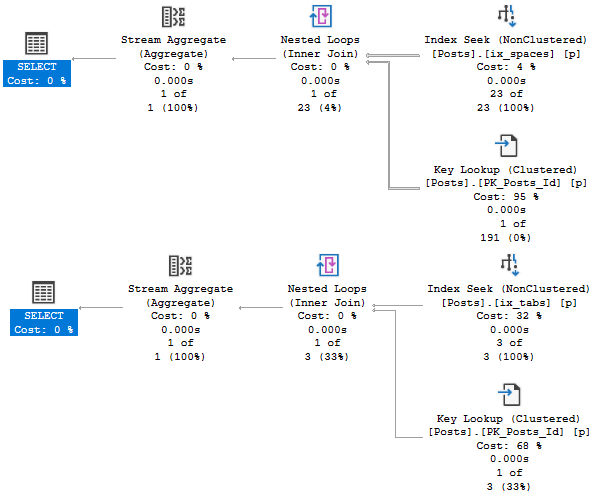
We just get unfortunate histograms, in this case. If I create very specific filtered statistics, both plans perform a key lookup.

CREATE STATISTICS s_orta ON dbo.Posts(ParentId) WHERE ParentId > 21100000 WITH FULLSCAN;
CREATE STATISTICS s_omewhat ON dbo.Posts(Score) WHERE Score < 1 WITH FULLSCAN;
CREATE STATISTICS s_emi ON dbo.Posts(ParentId) WHERE ParentId < 1 WITH FULLSCAN;
CREATE STATISTICS s_lightly ON dbo.Posts(Score) WHERE Score > 19000 WITH FULLSCAN;

This is necessary with the legacy cardinality estimator, too. Rain, sleet, shine.

Bad estimates happen.

When your tables are large enough, those 200 (plus one for NULLs, I know, I know) steps often can’t do the data justice.

Filtered stats and indexes can help with that.

Something I try to teach people is that SQL Server can use whatever statistics or methods it wants for cardinality estimation, even if they’re not directly related to the indexes that it uses to access data.

With filtered statistics, things go fine for both plans:

SQL Server Query Plan
Sunshine

When Could This Cause Trouble?


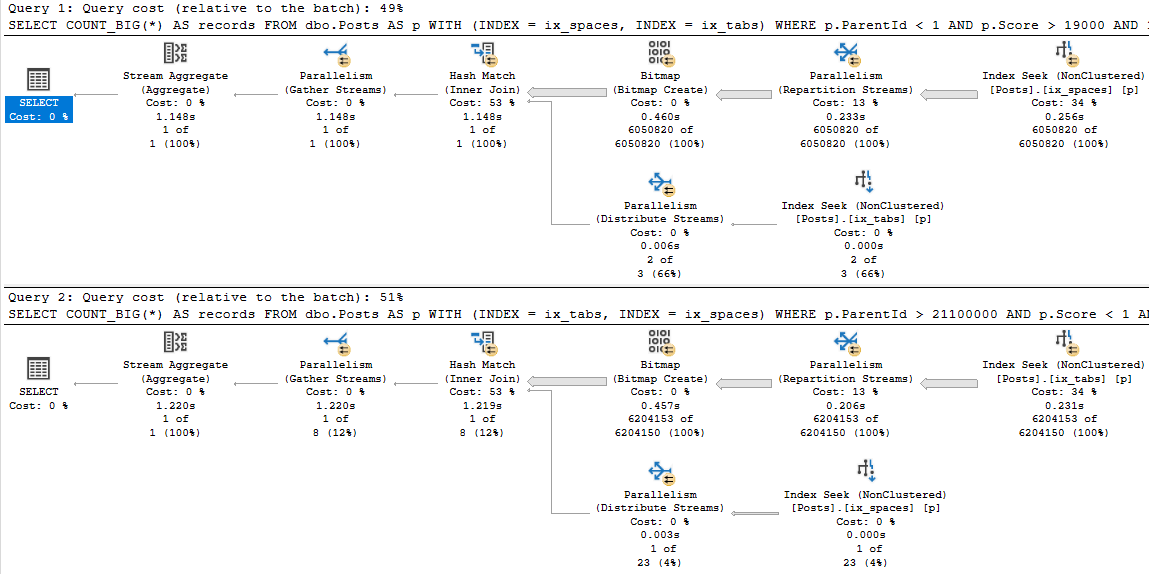
Obviously, plans like this are quite sensitive to parameter sniffing. Imagine a scenario where a “bad” plan got cached.

SQL Server Query Plan
Multihint

Having one instance of this query running doesn’t cause much of a CPU uptick, but if user concurrency is high then you’d notice it pretty quickly.

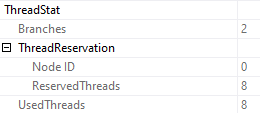
Parallel plans, by definition, use a lot more CPU, and more worker threads. These both reserve and use 8 threads.

SQL Server Query Plan Properties
Stretch

Those two plans aren’t even the worst possible case from a duration perspective. Check out these:

SQL Server Query Plan
5-4-3-2-1

Doubledown


When talking index design, single column indexes are rarely a good idea.

Sometimes I’ll see entire tables with an index on every column, and just that column.

That can lead to some very confusing query plans, and some very poor performance.

Thanks for reading!

Going Further


If this is the kind of SQL Server stuff you love learning about, you’ll love my training. I’m offering a 75% discount to my blog readers if you click from here. I’m also available for consulting if you just don’t have time for that and need to solve performance problems quickly.
Underused sp_WhoIsActive capabilities: @delta_interval

Great Ghost


In the last post, we looked at how to see if your query is misbehaving, or if things are running normally.

Note that I didn’t say “good” here. Just normal.

For you.

What Have You Done For Me Lately?


Using sp_WhoIsActive in a slightly different way, we can see what a query has been up to over a duration of our choosing.

The delta columns are what happened over the span of time we pick. The columns that come back normally are cumulative to where the query is at now.

So for a 5 seconds interval:

EXEC sp_WhoIsActive @delta_interval = 5;
sp_WhoIsActive Results
Stacked

I’m stacking a couple screens shots from the normal single line of results, because they’re a little too wide all at once.

What deltas can help you figure out is how “active” your query really is.

In other words, it can answer the question: is my query stuck, or is my query doing something?

As an example, here’s a query that opened a transaction, ran an update, and then… sat there.

sp_WhoIsActive Results

Over all, we’ve done 4.4 million reads, 80k writes, and used about 7k ms of CPU.

But in the last five seconds, we haven’t done anything at all.

Thanks for reading!

Going Further


If this is the kind of SQL Server stuff you love learning about, you’ll love my training. I’m offering a 75% discount to my blog readers if you click from here. I’m also available for consulting if you just don’t have time for that and need to solve performance problems quickly.
Spill Levels Are Weird In SQL Server Query Plans

Get Low


There’s a wonderful explanation from Paul White about spill levels here. At the risk of offending the copyright godses, I’m going to quote it here.

Consider the task of sorting 4000MB of data, when we only have 500MB of memory available. Obviously, we cannot sort the whole set in memory at once, but we can break the task down:

We first read 500MB of data, sort that set in memory, then write the result to disk. Performing this a total of 8 times consumes the entire 4000MB input, resulting in 8 sets of sorted data 500MB in size. The second step is to perform an 8-way merge of the sorted data sets. Note that a merge is required, not a simple concatenation of the sets since the data is only guaranteed to be sorted as required within a particular 500MB set at the intermediate stage.

Alright, interesting! That’d make me think that the number of pages involved in the spill would increase the spill level. In real life, I saw spill level 11 once. I wish I had that plan saved.

Rowed To Nowhere


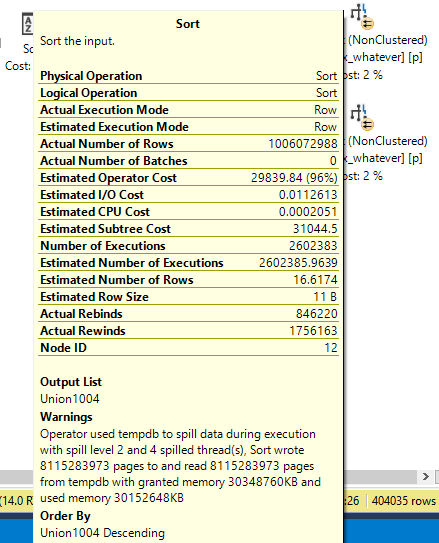
Here’s a pretty big spill. But it’s only at level two.

SQL Server Query Plan
Insert commas.

That’s 8,115,283,973 rows.

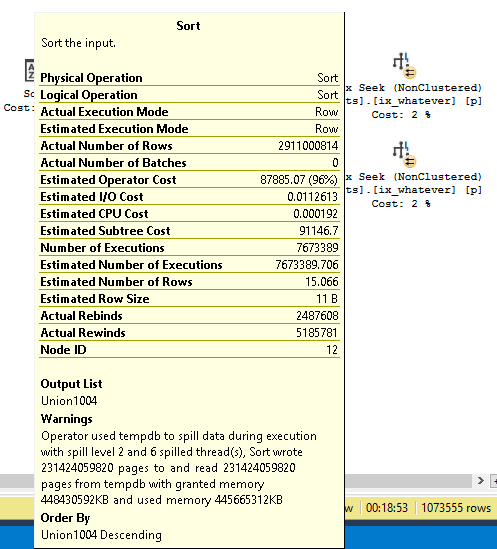
Here’s a much larger spill that’s still only at level two.

SQL Server Query Plan
Insert more commas.

That’s um… hang on.

231,424,059,820 rows. It’s crazy that we can add 223,308,775,847 rows to a spill and not need more passes than before.

But hey, okay. That’s cool. I get it.

SQL Server Query Plan
Waaaaaiiiiitttt

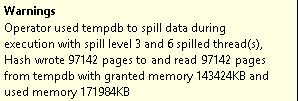
I found level three! With uh 97,142 pages. That’s weird. I don’t get it.

But whatever, it probably can’t get much weirder than

SQL Server Query Plan

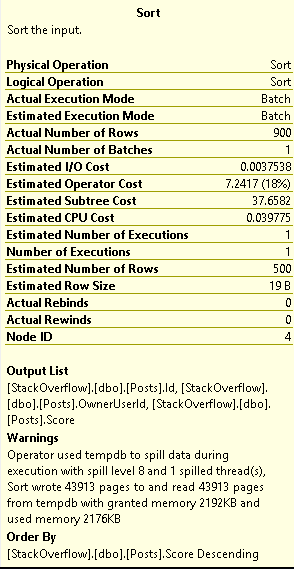
SPILL LEVEL 8 FOR 43,913 PAGES 1-800-COME-ON-YO!

This Is Gonna Take More Digging


I’m gonna have my eye on weird spill levels from now on, and I’ll try to follow up as I figure stuff out.

Thanks for reading!

Going Further


If this is the kind of SQL Server stuff you love learning about, you’ll love my training. I’m offering a 75% discount to my blog readers if you click from here. I’m also available for consulting if you just don’t have time for that and need to solve performance problems quickly.
Memory Grants For The SQL Variant Data Type In SQL Server

Great Question, You


During my (sold out, baby!) Madison precon, one attendee asked a great question while we were talking about memory grants.

Turns out, if you use the SQL Variant datatype, the memory grants function a lot like they do for any long string type.

From the documentation, which hopefully won’t move or get deleted:

sql_variant can have a maximum length of 8016 bytes. This includes both the base type information and the base type value. The maximum length of the actual base type value is 8,000 bytes.

Since the optimizer needs to plan for your laziness indecisiveness lack of respect for human life inexperience, you can end up getting some rather enormous memory grants, regardless of the type of data you store in variant columns.

Ol’ Dirty Demo


Here’s a table with a limited set of columns from the Users table.

CREATE TABLE dbo.UserVariant 
( 
    Id SQL_VARIANT, 
    CreationDate SQL_VARIANT, 
    DisplayName SQL_VARIANT,
    Orderer INT IDENTITY
);

INSERT dbo.UserVariant WITH(TABLOCKX)
( Id, CreationDate, DisplayName )
SELECT u.Id, u.CreationDate, u.DisplayName
FROM dbo.Users AS u

In all, about 2.4 million rows end up in there. In the real table, the Id column is an integer, the CreationDate column is a DATETIME, and the DisplayName column is an NVARCHAR 40.

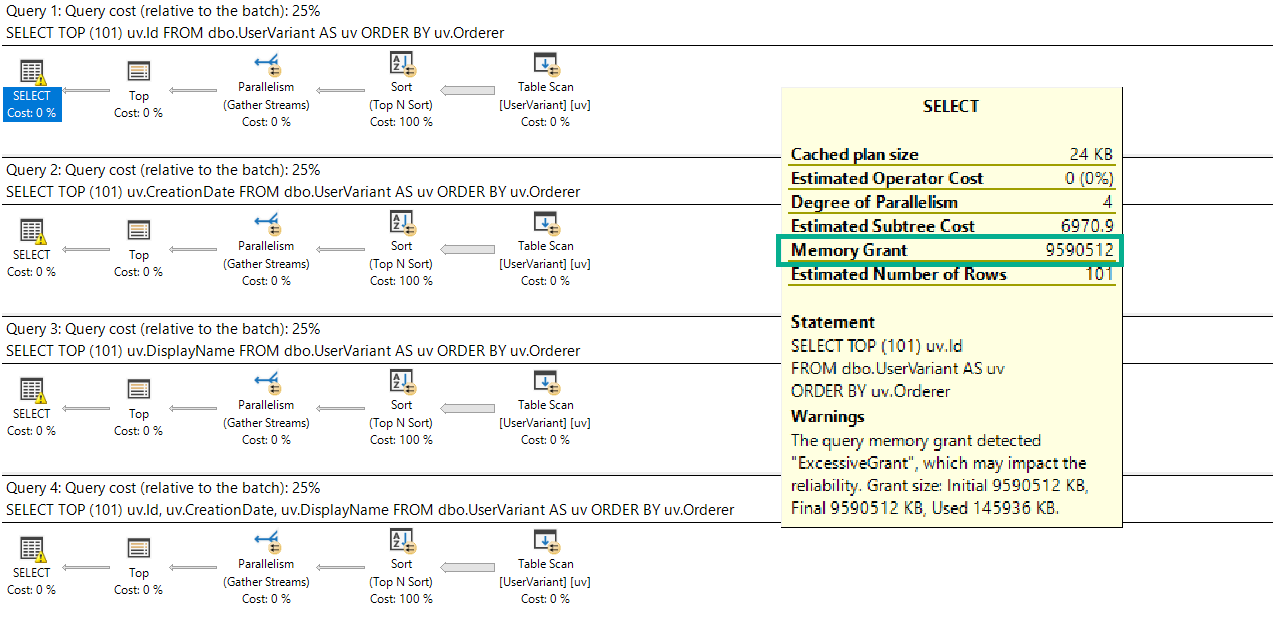
Sadly, no matter which column we select, the memory grant is the same:

SELECT TOP (101) uv.Id
FROM dbo.UserVariant AS uv
ORDER BY uv.Orderer;

SELECT TOP (101) uv.CreationDate
FROM dbo.UserVariant AS uv
ORDER BY uv.Orderer;

SELECT TOP (101) uv.DisplayName
FROM dbo.UserVariant AS uv
ORDER BY uv.Orderer;

SELECT TOP (101) uv.Id, uv.CreationDate, uv.DisplayName
FROM dbo.UserVariant AS uv
ORDER BY uv.Orderer;

It’s also the maximum memory grant my laptop will allow: about 9.6GB.

SQL Server Query Plan
Large Marge

Get’em!


As if there aren’t enough reasons to avoid sql_variant, here’s another one.

Thanks for reading.

Going Further


If this is the kind of SQL Server stuff you love learning about, you’ll love my training. I’m offering a 75% discount to my blog readers if you click from here. I’m also available for consulting if you just don’t have time for that and need to solve performance problems quickly.
Why Selects That Cause Writes Can Mean Performance Trouble In SQL Server

Answer Time


While answering a question on dba.se, I got to thinking about if there would be a good way to detect SELECT queries that cause writes.

In newer versions of SQL Server, sys.dm_exec_query_stats has columns that show you spills.

That’s a pretty good start, but what about other kinds of writes, like the ones outlined in the Q&A I linked to?

So uh, I wrote this script to find them.

Downsides


The downsides here are that it’s looking at the plan cache, so I can’t show you which operator is spilling. You’ll have to figure that out on your own.

The source of the writes may be something else, too. It could be a spool, or a stats update, etc. That’s why I tried to set the spill size (1024.) kind of high, to not detect trivial writes.

You may be able to loosely correlate spills to IO_COMPLETION or SLEEP_TASK waits.

Thanks for reading!

WITH 
XMLNAMESPACES 
    ('http://schemas.microsoft.com/sqlserver/2004/07/showplan' AS x),
writes AS
(
    SELECT TOP (100)
        deqs.statement_start_offset,
        deqs.statement_end_offset,
        deqs.plan_handle,
        deqs.creation_time,
        deqs.last_execution_time,
        deqs.total_logical_writes,
        deqs.last_logical_writes,
        deqs.min_logical_writes,
        deqs.max_logical_writes,
        deqs.query_hash,
        deqs.query_plan_hash
    FROM sys.dm_exec_query_stats AS deqs
    WHERE deqs.min_logical_writes > 1024.
    ORDER BY deqs.min_logical_writes DESC
),
plans AS
(
    SELECT DISTINCT
        w.plan_handle,
        w.statement_start_offset,
        w.statement_end_offset,
        w.creation_time,
        w.last_execution_time,
        w.total_logical_writes,
        w.last_logical_writes,
        w.min_logical_writes,
        w.max_logical_writes
    FROM writes AS w
    CROSS APPLY sys.dm_exec_query_plan(w.plan_handle) AS deqp
    CROSS APPLY deqp.query_plan.nodes('//x:StmtSimple') AS s(c)
    WHERE deqp.dbid > 4
    AND   s.c.value('@StatementType', 'VARCHAR(100)') = 'SELECT'
    AND   NOT EXISTS 
          (   
              SELECT      
                  1/0 --If nothing comes up, quote out the NOT EXISTS. 
              FROM writes AS w2
              CROSS APPLY deqp.query_plan.nodes('//x:StmtSimple') AS s2(c)
              WHERE w2.query_hash = w.query_hash
              AND   w2.query_plan_hash = w.query_plan_hash
              AND   s2.c.value('@StatementType', 'VARCHAR(100)') <> 'SELECT' 
          )
)
SELECT      
    p.creation_time,
    p.last_execution_time,
    p.total_logical_writes,
    p.last_logical_writes,
    p.min_logical_writes,
    p.max_logical_writes,
    text = 
        SUBSTRING
        (
            dest.text, 
        	( p.statement_start_offset / 2 ) + 1,
            (( 
        	    CASE p.statement_end_offset 
        		     WHEN -1 
        			 THEN DATALENGTH(dest.text) 
        	         ELSE p.statement_end_offset 
                END - p.statement_start_offset 
        	  ) / 2 ) + 1
        ),
    deqp.query_plan
FROM plans AS p
CROSS APPLY sys.dm_exec_sql_text(p.plan_handle) AS dest
CROSS APPLY sys.dm_exec_query_plan(p.plan_handle) AS deqp
ORDER BY p.min_logical_writes DESC
OPTION ( RECOMPILE );

Going Further


If this is the kind of SQL Server stuff you love learning about, you’ll love my training. I’m offering a 75% discount to my blog readers if you click from here. I’m also available for consulting if you just don’t have time for that and need to solve performance problems quickly.