You have alerts for when jobs fail, when they run long, and they’re all emailed to the ENTIRE COMPANY in beautifully formatted CSS.
Have a cigar.
But we all go on vacation sometime.
Overtime
One thing that can make a workload feel artificially sluggish is maintenance.
Index stuff: Lotsa work, sometimes blocking
Backup stuff: Native fulls of VLDBs, with compression
DBCC CHECKDB: Oh, you forgot to run this because you were busy rebuilding indexes
Darn. Gimme that cigar back.
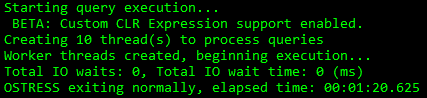
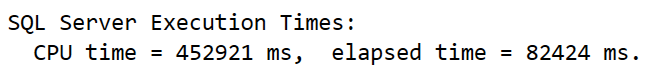
Right now, I’ve got a DBCC CHECK, and a query workload, that both run for one minute and 20 seconds when they run alone.
Quick QueriesDoublefast DBCC CHECKDB
Overlap
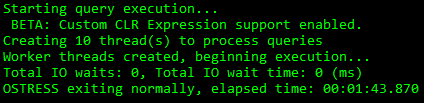
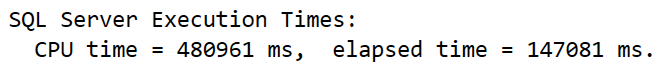
The problem becomes when I run them both at the same time. The query workload runs for about 25 seconds longer, and CHECKDB runs for two and a half minutes.
That’s like, almost twice as long.
Ugly QueriesDusty DBCC CHECKDB
Now, it’s okay if you don’t have all those alerts set up. I guess.
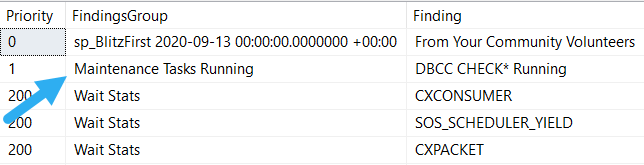
Because you can use sp_BlitzFirst to see what’s going on, and get warned:
If you can end maintenance tasks and have performance go back to normal-bad, congratulations! You’ve solved today’s problem.
Have a cigar.
Thanks for reading!
Going Further
If this is the kind of SQL Server stuff you love learning about, you’ll love my training. I’m offering a 75% discount to my blog readers if you click from here. I’m also available for consulting if you just don’t have time for that and need to solve performance problems quickly.
This isn’t the way most people do it, but it is the least impactful.
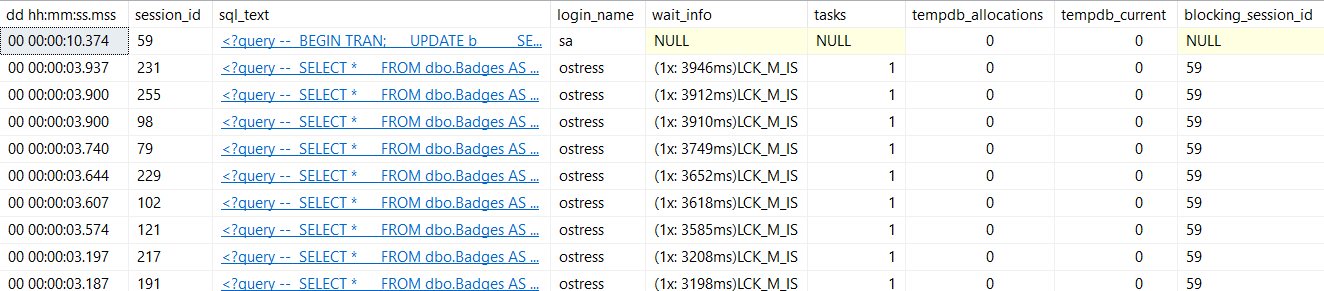
You get back the normal set of results:
peachy
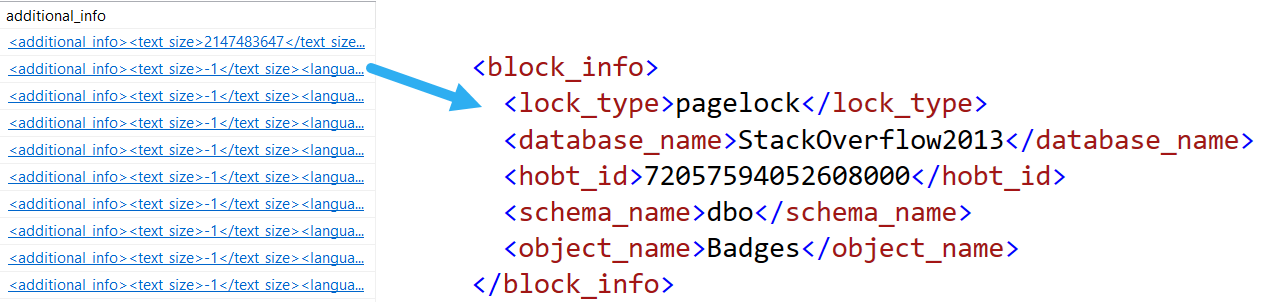
Cool, you can see queries, lock waits, and blocking sessions. But a short scroll to the right also brings you to this additional_info clickable column:
oily water
It’s not so helpful for the query doing the blocking, but it’ll tell you what the queries being blocked are stuck on.
The usual way
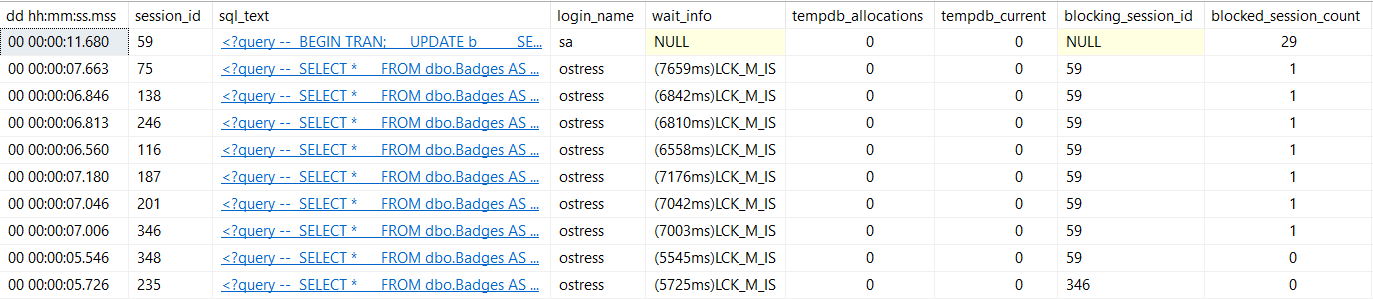
EXEC sp_WhoIsActive @get_locks = 1;
This is the way I normally demo looking for blocking with it, because it is more useful to see what the blocking query is doing.
But I’ve also had it be slow. Really, really slow.
That can happen when there is JUST SO MUCH BLOCKING that it takes a long time to enumerate all of it.
It’s not always obvious by runtime which session is causing blocking, so you can use this command to find blocking chains, and order output by who’s doing the most blocking.
troubleshot
Fixins
When you need to troubleshoot live blocking, these are the ways I usually check in on things with sp_WhoIsActive. It’s hard to beat.
We’ve peeled back a couple scenarios where oddball things can slow a server down. Tomorrow we’ll look at a new one!
What’ll it be?
Your guess is not as good as mine.
Thanks for reading!
Going Further
If this is the kind of SQL Server stuff you love learning about, you’ll love my training. I’m offering a 75% discount to my blog readers if you click from here. I’m also available for consulting if you just don’t have time for that and need to solve performance problems quickly.
Don’t you love lists? I love lists. They’re so nice and tidy, like a RegEx. Just the other night I was thinking how nice it’d be to write a RegeEx to detect RegEx patterns.
I didn’t sleep.
Anyway, SQL Server. Things. Things running slowly. What’s up with that?
In these posts, I’ll walk through some common scenarios, and how to look for them.
It might even be in the EXACT SAME VERY ORDER I LOOK FOR THEM!
Put your money away.
Reason 1: The Server Is Overloaded
If you go to open a new tab in SSMS and you hear a creaking sound, it might be time to revisit some of your hardware choices.
But that’s a problem for future you. Your problem is right now.
What to look for: Stuck queries, Resource Usage, Wait Stats
By default, it’ll look at both CPU and Memory counters. If you don’t know what’s going on, just hit F5.
EXEC dbo.sp_PressureDetector;
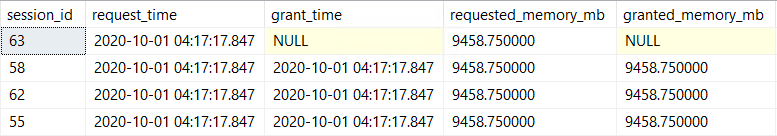
If you’re hitting memory limits, things will look like this:
are you ready?
Some queries will have requested memory, but it won’t have been granted.
payday
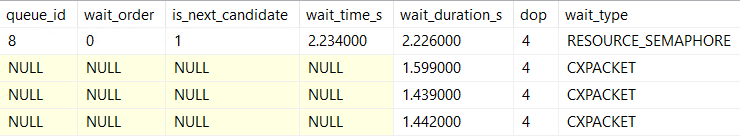
Waiting queries will be stuck in a queue, waiting on RESOURCE_SEMAPHORE.
we’re having a good time
A significant amount of memory will have been granted out, and available memory will be on the lower side. You’ll also probably see the waiter_count column
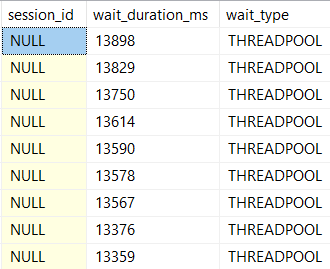
If you’re hitting CPU limits, things will look like this:
negative creep
Available threads might be a negative, or very low number. Requests may be waiting on threads, and the number will pretty closely match the number of rows that are…
bum
Waiting in the pool.
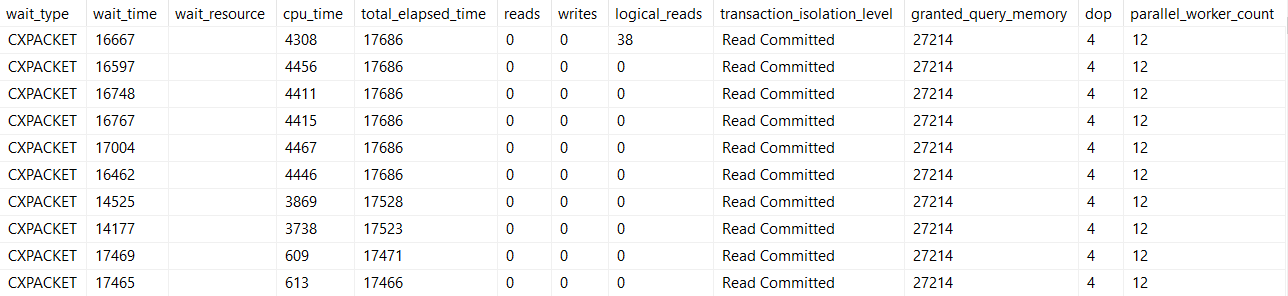
she works hard for the money
This’ll also show you queries that are running, and which ones are using the most threads.
Can You Fix It Quickly?
Maybe, maybe not. If you’re allowed to kill off queries, you might be able to right the ship now. If not, you’re stuck waiting for queries to finish and give back their resources.
Longer term, you have a long checklist to go through, including asking tough questions about hardware, settings memory and parallelism settings, and your queries and indexes. This script will give you a lot of information about what’s going on. It’s up to you to figure out why.
If you need help with this sort of thing, drop me a line.
Thanks for reading!
Going Further
If this is the kind of SQL Server stuff you love learning about, you’ll love my training. I’m offering a 75% discount to my blog readers if you click from here. I’m also available for consulting if you just don’t have time for that and need to solve performance problems quickly.
I had a brief opportunity to do SQL Server workload testing on an eight socket server. It didn’t go well.
Sockets
I’ll give an extremely brief introduction to NUMA and sockets because I have a bit more free time these days. You’re probably reading this blog post on a machine with a single socket. All that means is that there’s a single CPU chip plugged into the motherboard. All of the RAM for the machine is local to that CPU chip. The recent king of single socket performance for SQL Server is the Intel 8280. 28 cores at 2.7 GHz with the latest instruction sets is quite a lot of processing power. There’s a newer chip out there now but it’s not clear to me if anyone can buy it yet.
What can you do if a workload can’t be scaled out and it needs more than the CPU power available with a single socket solution? A two socket solution could be the answer. A two socket server has two CPU chips plugged into different slots on a motherboard and each CPU has a local bank of RAM. Any part of memory can be access by either CPU but there is a performance penalty for foreign memory access, which is just accessing memory from a different CPU. See the simple diagram below:
As mentioned earlier, it is more expensive for CPU0 to access memory local to CPU1 compared to its own local memory. The performance penalty of NUMA will depend on the workload as well as the hardware. It can range from not noticeable at all to a serious issue that needs to be addressed in some way. In some situations this can be as easy as convincing your VM admin to change how the VM is set up. In others, your best bet may be to figure out a way to keep the workload on a single socket. Some folks advocate for single socket solutions compared to two socket solutions for OLTP workloads due to the NUMA penalty.
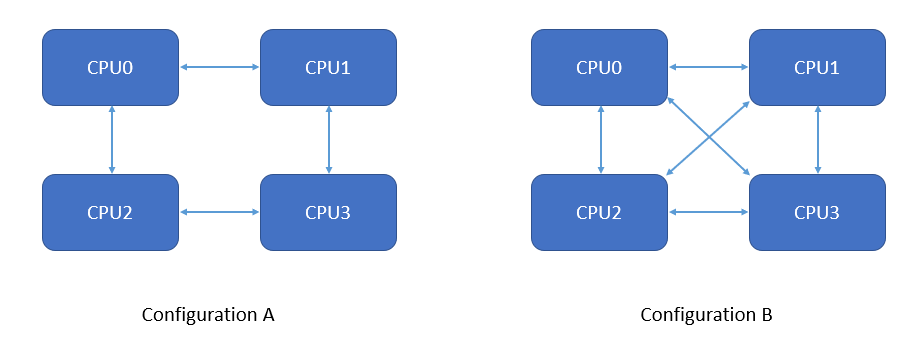
Perhaps you are wondering what happens if a workload needs more power available from a two socket server? Enter the four socket server. Four socket servers have four slots for CPU chips. An Intel 8280 processor in a four socket configuration gives you a total of 112 physical cores. That’s a lot. Four socket servers are more expensive than two socket servers and are significantly less common to find in data centers. Often, they are a custom order which makes months for the hardware vendor to build and deliver. In addition, the connections between CPUs are more complicated. Below are two common configurations:
Under configuration A, it takes two hops for CPU0 to access memory local to CPU3. That will increase latency more than going to CPU1 or CPU2. However, memory latency between CPUs won’t be the same for all pairs even in configuration B. In addition, it’s more complicated for SQL Server to try to manage memory on a four socket box. Even in the best case scenario for memory management, by design everything stored in SQL Server owned memory isn’t NUMA aware, such as the columnstore object pool. Nonetheless, if you need more CPU than a two socket server or VM can provide then you’re stuck living with the complexities of a four socket solution.
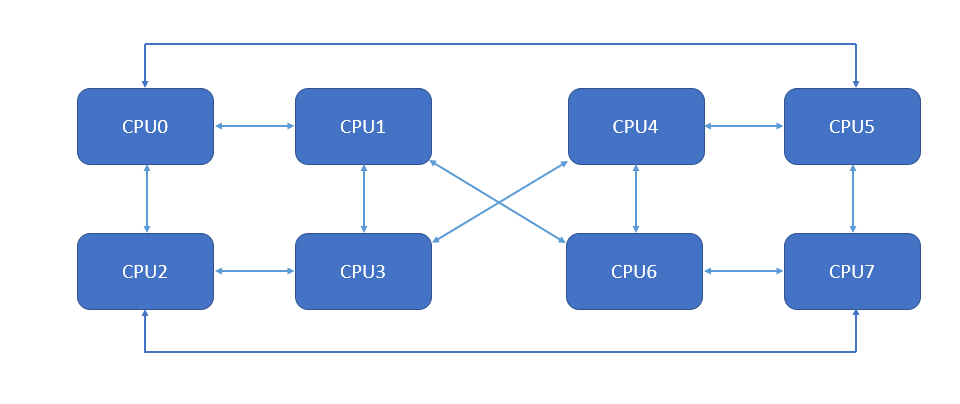
What if you need even more power? Hardware manufacturers once again have you covered with eight socket servers. These are even more expensive and uncommon than four socket solutions. Different vendors handle NUMA differently. There are simply more possible permutations with eight CPUs compared to four. I’m told that the following is an example layout for an eight socket machine:
I’m not a NUMA expert by any means. However, I think it’s fair to say that it looks a lot more complicated. There are many more instances where accessing foreign memory will take two hops instead of one. I also don’t see a way to carve out a four socket VM with all CPUs just one hop away. All in all, that diagram makes me nervous. As a final note, eight socket machines are not the limit of what’s possible, but I’ll stop here because I’ve never run code on anything larger than eight sockets.
Test Setup
I elected to use a high concurrency CCI insert workload to compare performance between a four socket VM and an eight socket VM. Quite conveniently, I already had a test columnstore workload that I knew pushed the SQL Server scalability limits in terms of memory management. To perform the threading I used the SQL Server Multi Thread open source framework. I wanted all sessions to go to their own schedulers. That could have been tough to manage with tests up to 200 threads but the threading framework handles that automatically.
For those following along at home, testing was done with SQL Server 2019 with LPIM and TF 876 enabled. Guest VMs were built with VMware with Windows Server 2019 installed. The four and eight socket VMs were created on the same physical host with about 5.5 TB of RAM available to the guest OS in both configurations.
Test Results
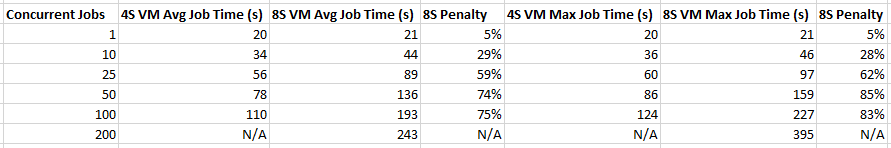
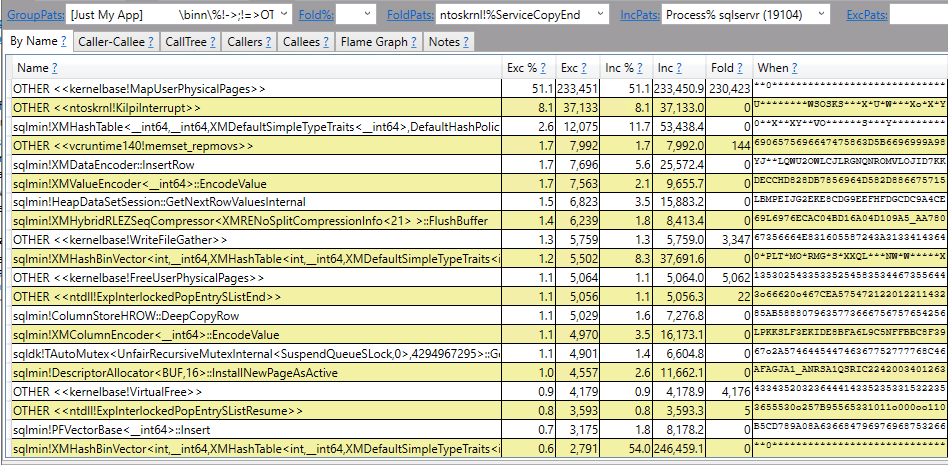
In case you didn’t click the earlier link, each job inserts about 10.4 million rows into a table with a clustered columnstore index. The smallest test ran just a single thread. The largest test on the four socket VM ran 100 concurrent jobs for a total insert volume of a billion rows. The largest test on the eight socket VM ran 200 concurrent jobs for a total insert volume of two billion rows. In all test scenarios, the four socket VM performed more work per second than the eight socket VM:
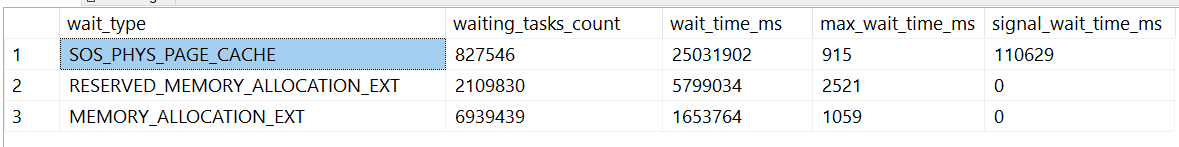
Quite a disappointing result. Double your SQL Server license fees for a slower overall system! There are the expected memory related wait stats for the 200 thread result:
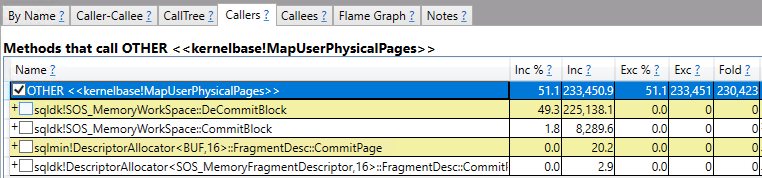
Drilling into the top stack shows that decommitting memory is a scalability issue:
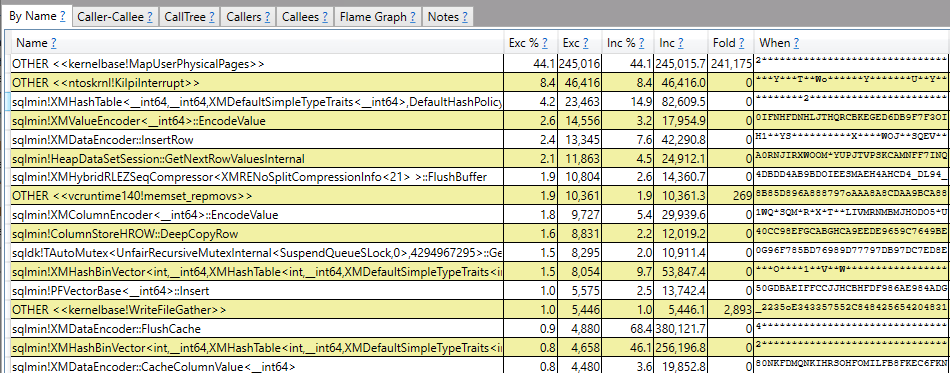
The stacks for the 100 thread test on the four socket VM results are a bit surprising by comparison:
Overall CPU reported by PerfView is the same. Perhaps this is a limitation of the tool. However, it really does seem like all of those extra cores simply aren’t helping under the eight socket configuration. Throughput goes down instead of up. I had very limited time with this machine and don’t want to repeat much of a previous blog post, so I’ll stop the technical analysis here. It’s likely that nothing can really be done to improve the workload except large configuration or hardware changes.
If I had to make this workload perform better, I would directly engage with the vendors. If that didn’t work, I would try a bare metal configuration, SQL Server on Linux, or running on an eight socket machine from a different vendor. I think that it’s fair to say that the test results would be different, but I can’t speculate as to whether they would be better or worse or what the difference would be.
Final Thoughts
We live in a wonderful era of hardware prosperity. With a big enough checkbook, you can run your SQL Server workloads on servers with hundreds of CPU cores. However, proceed with extreme caution if you’re considering moving a SQL Server workload to a server or VM with more than four sockets. It might not scale as well as you’re hoping. Thanks for reading!
There are waits, and then there are waits. If you know, you know, you know?
If you don’t know, here’s the deal: there are some waits that are gonna happen, and you’re not gonna be able to do much about them.
In this post, I’d rather introduce you to waits that you should pay attention to and can fix, and how they relate.
This isn’t meant to cover every single scenario, but it’s a good starting place. For example, with cloud and VM workloads being more common than ever, you may need to look at different settings or configurations outside of SQL Server.
This also goes for those of you using SANs, where everything from the networking to the controllers to the disk arrays can potentially be a bottleneck.
If one looks hard enough, one may find inefficiencies anywhere.
Going For Speed
The waits I generally feel are common enough and fixable enough are below.
There are plenty of less common waits with perfectly fine solutions, but let’s get you started with the ones that tend to drift up towards the top of all those magical scripts you find strewn about the internet.
CXPACKET/CXCONSUMER: Parallelism
LCK_*: Locking
PAGEIOLATCH_*: Reading pages from disk
RESOURCE_SEMAPHORE: Running out of memory to grant queries
THREADPOOL: Running out of worker threads
Of course, these waits can be closely related, can’t they?
Many concurrent parallel queries can lead to running out of worker threads
A common way to have many parallel queries stack up is to have them get blocked
Granting lots of memory to queries can mean less room for the buffer pool and more reading from disk
Of course, it’s really when these waits happen that matters, isn’t it? If there’s no end-user impact, who cares?
Always Be Checking
For the billionth time, if you have servers you care about performance for, get a monitoring tool.
If your boss won’t spring for one, try a free one. Or if you’re feeling really saucy, download a free trial of a paid tool.
Once you know which waits are happening when users might care, you stand a better chance at being able to start fixing things.
But I don’t want you to think you always need wait stats to tune things. Often, waits for a single query don’t matter. Waits really matter when you want to judge a workload.
Of course, there are exceptions. If every 2nd or 3rd time you run a query, it spends 20 seconds reading pages from disk, but the rest of the time it takes 2 seconds, it’s probably not the query (assuming everything in the plan is identical).
Tomorrow we’ll dig into CPU related waits, and how to address those.
Thanks for reading!
Going Further
If this is the kind of SQL Server stuff you love learning about, you’ll love my training. I’m offering a 75% discount to my blog readers if you click from here. I’m also available for consulting if you just don’t have time for that and need to solve performance problems quickly.
If you talk to anyone who bills by the hour for SQL Server, one of the first things they’ll ask you is what your wait stats are.
It’s not a bad question; it kills some time, and it lets them gauge how engaged you are with your server.
Waits can sometimes indicate a severe bottleneck
Waits can also be “high” on a server that has perfectly acceptable throughput
There are also some problems with wait stats, and performance counters in general: there’s no direct correlation between the counters and the queries that caused them.
Sure, Query Store in 2017+ tracks high level wait stats for queries, but I don’t run into a lot of people using Query Store still.
The other trouble with performance counters is that they just aggregate over time, with no partitioning either by database or time.
Brooklyn Basement
Some things to keep in mind when you’re looking at wait stats:
How they compare to server uptime
How many times the wait occurred
How long each occurrence took to complete on average
If your script or monitoring tool doesn’t report this stuff, it’s leaving some really important stuff out of the picture.
The relationship to server up-time is important, because if all you have to work off of is percentages, you have no idea if your server is constantly grinding on these waits, or if they only happened for a few minutes.
As a thought experiment: say 100% of your waits are on PAGEIOLATCH_SH, and you have 2 hours total of those waits.
How does your opinion of those waits change if the server has been up for:
1 hour
4 hours
24 hours
96 hours
Typically, the longer a server has been up, and the less concentrated waits become, the less of a focal point they should be. There’s no magic ratio here, but for me, the closer wait times are to up time, the more I may want to look at them.
Longs and Shorts
Yes, there can be a mix of these, but there’s still two basic ways that wait stats rack up.
Lots of waits that happen pretty quickly
Fewer waits that last a long time
Obviously, the source of those waits will impact how much we care about them. Here are some common examples:
You wait often on storage, but the waits are short (say <10 ms)
You don’t wait often on locks, but the waits are long (say > 10,000 ms)
I’m not gonna reinvent any wheels here, but I will reiterate a couple things:
You can see which queries are generating waits while they’re running, but…
If you’re not constantly logging that, it disappears on you
Once waits are completed, they are faceless and blameless
Waits in general can be far less valuable when workloads are inconsistent
Attentione!
Tomorrow, I’ll talk through some of the most common waits, and first-line ways to start solving them.
They may not solve every single problem, but they’re generally a good place to start.
Thanks for reading!
Going Further
If this is the kind of SQL Server stuff you love learning about, you’ll love my training. I’m offering a 75% discount to my blog readers if you click from here. I’m also available for consulting if you just don’t have time for that and need to solve performance problems quickly.
For many people, index tuning means occasionally adding an index when there’s a report about a slow query. Those indexes might come from a query plan, or from the missing index DMVs, where SQL Server stores every complaint the optimizer files when it thinks an index might make a query better.
Sure, there are some people who think index tuning means rebuilding indexes or running DTA and checking all the boxes, but I ban those IP addresses.
Of course, there’s a whole lot more to index tuning. Adding indexes is fine to a point, but you really should spring clean those suckers once in a while, too.
Look for overlapping indexes, unused indexes, and check for any Heaps that may have snuck in there. sp_BlitzIndex is a pretty cool tool for that.
But even for adding indexes, sometimes it takes more than one pass, especially if you’re taking advice from query plans and DMVs.
How The What
Let’s say you’re looking at a server for the first time, or you’re not quite comfortable with designing your own indexes. No judgment, there.
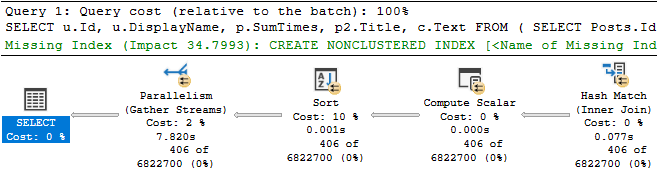
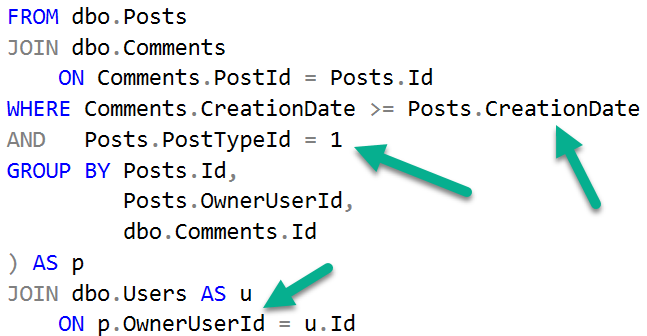
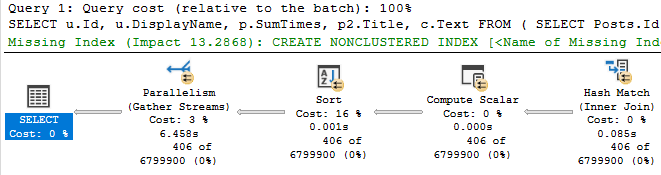
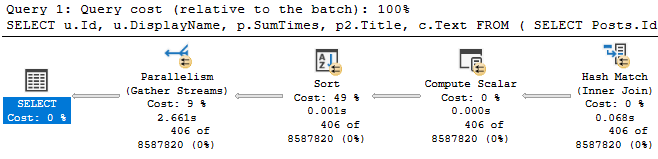
You see a query plan for some piece of code that’s running slowly, and it has a missing index request.
Sugar Sugar Sugar
There’s only one missing index request — there’s not a bunch of hidden ones like in some plans — and it looks moderately helpful so you decide to try it.
Treefiddy
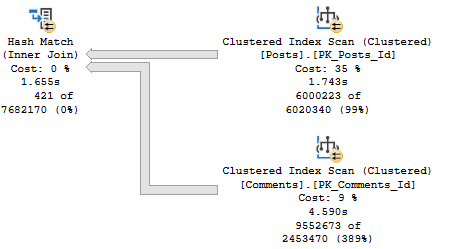
The thing is that as far as “stuff I want to go faster” in the plan, the clustered index scan on Posts is about 3x faster than the clustered index scan on Comments.
Deal with it
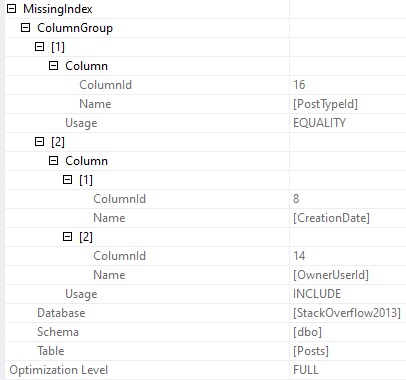
And the index that’s being asked for is only going to help us find PostTypeId = 1. It’s not going to help with the rest of or join or filtering very much.
CREATE NONCLUSTERED INDEX [<Name of Missing Index, sysname,>]
ON [dbo].[Posts] ([PostTypeId])
INCLUDE ([CreationDate],[OwnerUserId])
Una Posta
We still need to filter on CreationDate, and join on OwnerUserId later. Sometimes this index will be “good enough” and other times it “won’t”.
If PostTypeId were really selective, or if this query were searching for a particularly selective PostTypeId, then it’d probably be okay-ish.
But we’re not, so we may settle on this index instead.
CREATE NONCLUSTERED INDEX p
ON [dbo].[Posts] ([PostTypeId], [CreationDate], [OwnerUserId]);
With that in place, we only get marginal improvement in the timing of the plan. It’s about 1.5 seconds faster.
Probably not what we’d wanna report to end users.
Hella
But we have new green text! This time it’s for the Comments table, which is where our pain point lies time-wise.
CREATE NONCLUSTERED INDEX [<Name of Missing Index, sysname,>]
ON [dbo].[Comments] ([PostId],[CreationDate])
We add that, and reduce our query runtime to less than half of what it was originally.
Babewood
Is 2.6 seconds good? Or great? All depends on expectations.
Could we keep going and experimenting? Sure.
It all depends what we’re allowed to change, what our skill level is (mine is quite low, ho ho ho), and what our priorities are (these are also quite low).
This Is Just One Query
And since we had the luxury of having it in front of us, running it, adding an index, running it again to test the index, etc., we were able to spot the second index request that ended up helping even more than the first one.
If you don’t have that luxury, or if you just poke around the missing index DMVs every 3-6 months, you could miss stuff like this. Sure, that first request would be there, and it might look tempting enough for you to add, but the second one wouldn’t appear until after that. That’s the one that really helped.
Whenever you’re tuning indexes, or releasing code that’s going to use existing data in new ways, you’d be doing yourself a big favor to check in on this stuff at least weekly.
You might be an index tuning wiz and not need to — if you are, I’d be amazed if you made it this far into my blog post, though — or you may catch “obvious” new indexes during development.
But I’m going to tell you something about end users: they’re devious, mischievous, and they’re out to make you look bad.
As soon as they start using those new features of yours, they’re going to abuse them. They’re going to do all sorts of horrible things that you never would have dreamed of. And I’ll bet some different indexes would help you keep your good name.
Or at least your job.
Thanks for reading!
As a postscript to this: I don’t want you to think that missing index requests are the end-all be-all of indexing wisdom. There are lots of limitations, and suggested column order isn’t perfect. But if you’re just getting started, they’re a great way to start to understand indexing, and see the problems they do and don’t solve. And look, the only way to make them better would be to spend longer during compilation thinking about things. That’s not how the optimizer should be spending its time. We’re lucky to get these for free, and you should view them as a learning tool.
Going Further
If this is the kind of SQL Server stuff you love learning about, you’ll love my training. I’m offering a 75% discount to my blog readers if you click from here. I’m also available for consulting if you just don’t have time for that and need to solve performance problems quickly.
If this is the kind of SQL Server stuff you love learning about, you’ll love my training. I’m offering a 75% discount to my blog readers if you click from here. I’m also available for consulting if you just don’t have time for that and need to solve performance problems quickly.
I speak with a lot of people who have SQL Server performance problems. Sometimes they’re constant, sometimes they’re obvious, and sometimes they’re intermittent.
Constant and obvious problems are easy to observe, though not necessarily easy to resolve without experience. Still, they’re a bit less frustrating, because at least you’ve got some idea what’s going on. It’s those intermittent problems that can be a real pain.
SQL Server is very catch-me-if-you-can when it comes to most issues. I’ve talked about this before I’m sure, but if you’re not hitting F5 at in the right place at the right time, you could totally miss what happened when you had a problem, and very there’s no time sliced data collection (except in query store) that can help with any reliability.
Not wait stats, not perfmon, not index usage. The plan cache can be okay, but is often unreliable, and has many blind spots.
Whatcha Got?
The people I talk to generally fall into two groups:
We don’t have a monitoring tool at all
We have one, but we can’t figure anything out with it
If you don’t have one, Sentry One is a good place to start. It’s not perfect, but I tend to have good luck with it.
If you do have one, make the most of it. Have a sales tech give you some training. That’s part of what you pay for. Take it a step further: tell them about the kind of problems you have, and ask them to show you how to find them using their monitoring tool. If they can’t do that, it might be time to shop around for one that can.
Old Block
This isn’t just for you, either. This request is sort of selfish.
Let’s say you call someone like me in to look at your server. If you’ve got intermittent issues, it’s a whole lot easier to show me what was happening in the monitoring tool the last time you had an issue than to try to explain to me what happened. It’s a lot less annoying than hoping it happens again while we’re looking at the server together, or trying to recreate it.
Thanks for reading!
Going Further
If this is the kind of SQL Server stuff you love learning about, you’ll love my training. I’m offering a 75% discount to my blog readers if you click from here. I’m also available for consulting if you just don’t have time for that and need to solve performance problems quickly.
There are lots of great options out there for figuring out what’s happening on a server. If you’re the kind of person still running sp_who, or sp_who2, or sp_who8045, it’s time to stop.
You’ve got much better options, like sp_WhoIsActive, or the First Responder Kit. They’re both great, but sometimes I needed this very specific information very quickly without all the bells and whistles.
I call it the pressure detector. It’s four simple DMV queries that will give you different levels of detail about memory and CPU usage currently taking place on a server. Like a lot of these scripts, when a server is Baltimoring, you’re better off running them using the DAC. Otherwise, you’re kinda stuck in the same place all your other queries are.
So what does this help you with? Situations where you’re running out of worker threads, or when you’re running out of memory.
When you hit those, you’ll get smacked with a couple nasty waits:
THREADPOOL: Running out of worker threads
RESOURCE_SEMAPHORE: Running out of query memory
The thing is, sometimes it’s hard to see what’s happening, what’s causing problems, and what’s on the receiving end.
Check out this video to walk you through the proc results.
Video Killed
Thanks for reading!
Going Further
If this is the kind of SQL Server stuff you love learning about, you’ll love my training. I’m offering a 75% discount to my blog readers if you click from here. I’m also available for consulting if you just don’t have time for that and need to solve performance problems quickly.