If this is the kind of SQL Server stuff you love learning about, you’ll love my training. I’m offering a 75% discount to my blog readers if you click from here. I’m also available for consulting if you just don’t have time for that and need to solve performance problems quickly.
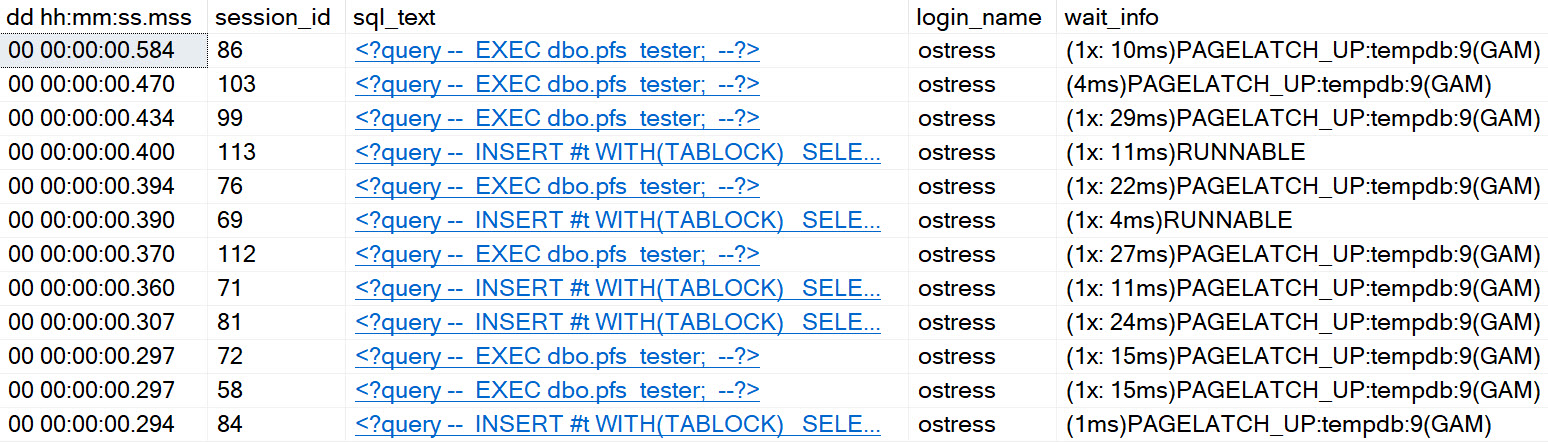
Even on SQL Server 2019, with in-memory tempdb metadata enabled, and an appropriate number of evenly sized data files, you can experience certain types of contention in tempdb.
It’s better. It’s definitely and totally better, but it’s still there. With that in mind, I wrote a stored procedure that you can stick in your favorite stress tool, to see how tempdb handles different numbers of concurrent sessions. You can download it here, on GitHub.
If you need a tool to run a bunch of concurrent sessions against SQL Server, my favorite two free ones are:
If you’re on < SQL Server 2016, you might need trace flags 1117 and 1118
You might have a bunch of other stuff hemming up tempdb, too
Thanks for reading!
Going Further
If this is the kind of SQL Server stuff you love learning about, you’ll love my training. I’m offering a 75% discount to my blog readers if you click from here. I’m also available for consulting if you just don’t have time for that and need to solve performance problems quickly.
CPUs aren’t normally expensive, but ask them to run a query and the cost skyrockets. It doesn’t matter where you are in the world or in the cloud, prepare to get gouged.
You’d think SQL Server was an Hermes purse.
Life is a bit worse in the cloud, where CPU count and RAM amount are inexorably tied together. Sure, Azure offers constrained vCPU instances that help with that, but still.
Money is expensive, and it never goes on sale.
Slacker
If your CPU load stays consistently under 20%, and you don’t need a bunch of cushion for regularly scheduled tasks like ETL or ELT or LET me write a sentence before changing the acronym, then what’s the point of all those CPUs?
I’m not saying they have to run at 100% and you should be using them to air fry your Hot Pockets, but what’s wrong with running at 40-60%? That still leaves you a good bit of free ticks and cycles in case a parameter gets poorly sniffed or some other developer disaster befalls your server.
When a workload is pretty well-tuned, you should focus on right-sizing hardware rather than staring at your now-oversized hardware.
Bragging Rights
It’s often quite an achievement to say that you tuned this and that and got CPU down from 80% to 20%, but now what?
Can you give back some cores to the VM host? Consolidate workloads? Move to a smaller instance size?
Fashion models are great, but they’re not great role models for servers. CPUs should not be sitting around being expensive and bored.
Thanks for reading!
Going Further
If this is the kind of SQL Server stuff you love learning about, you’ll love my training. I’m offering a 75% discount to my blog readers if you click from here. I’m also available for consulting if you just don’t have time for that and need to solve performance problems quickly.
When I’m working with clients, we look at a lot of stuff together to make sure things are in good working order.
If we’re tuning a single query, the goal is pretty easy to define. We want it to finish as fast as possible.
How you get there is where things may get interesting, but let’s be honest: most of the time you’re going to be fixing the same half a dozen problems in some combination.
Note that the query finishing, and results being finished returning are two different metrics. A query may finish very quickly, but returning results may take considerably longer for various reasons.
You can think of this as responsiveness, and it’s a cornerstone to building something people are happy with. When you’re talking about user experience, performance has to be part of the conversation.
How fast individual queries finish also plays a big part in overall concurrency.
Put Through
Typically this matters more for OLTP workloads. Data warehouses aren’t usually high concurrency environments in that the Batch Requests/Sec counter is sitting around bored. Joe Obbish has a great talk on improving data warehouse loading patterns, because usually isn’t always. Ha ha ha. Barf.
Workloads that do have OLTP characteristics are more sensitive to all sorts of things, and I don’t just mean parameters. Locking and Deadlocking are high up on the list, along with available hardware resources.
Rather obviously, if you want to improve overall throughput, having queries finish as quickly as possible is an attractive goal. You can run way more queries in one second if they take 100ms than if they take 900ms, you know? You know. You’re smart.
Factorials
What are the factors that influence query speed?
Starting in the database:
Well written queries
Thoughtful indexes
Maintained Statistics
Correctly stored data types
Properly normalized tables
Moving out a little bit further, there are some important settings:
Parallelism
Optimistic Isolation Levels
Max Server Memory
tempdb stuff
Instant File Initialization
Lock Pages In Memory (mostly)
Further out, we have the hardware:
CPU
Memory
Disk
Network Path To Disks (SAN)
A lot of times something being off in one place can make it look like there’s a bottleneck in another place. Probably the easiest example to conjure up is if you’re missing an opportune nonclustered index, and you end up scanning a clustered index over and over again. The clustered index doesn’t fit in memory, so you end up generating a lot of PAGEIOLATCH_SH waits.
It might look like you have a memory shortage, but in reality you could be making far better use of the memory you have.
Margin For Error
Being able to identify and fix specific bottlenecks is an important skill. Wait stats and other counters can be useful, but are often underwhelming unless you’re watching at the right time, or you have a monitoring tool that logs them for you. Bottlenecks can live in many places, and oftentimes performance tuning is like playing whack-a-mole with them.
Hitting hard limits and running out of CPU or RAM is never fun. Picking hardware that’s up to the task is step one, but staying on top of query and index tuning to make sure it stays adequate for longer is a process that you need to go through. If this is the sort of thing you need help with, drop me a line.
Thanks for reading!
Going Further
If this is the kind of SQL Server stuff you love learning about, you’ll love my training. I’m offering a 75% discount to my blog readers if you click from here. I’m also available for consulting if you just don’t have time for that and need to solve performance problems quickly.
We’ve got a set of missing index requests for a single table, and we’ve got the queries asking for them.
Going back to our queries and our index requests, all the queries have two things in common:
They filter on OwnerUserId
They order by Score
There are of course other elements in the where clause to attend to, but our job is to come up with one index that helps all of our queries.
Query Real Hard
To recap, these are our queries.
SELECT TOP (10)
    p.*
FROM dbo.Posts AS p
WHERE p.OwnerUserId = 22656
ORDER BY p.Score DESC;
GO 10

SELECT TOP (10)
    p.*
FROM dbo.Posts AS p
WHERE p.OwnerUserId = 22656
AND   p.CreationDate >= '20130101'
ORDER BY p.Score DESC;

SELECT TOP (10)
    p.*
FROM dbo.Posts AS p
WHERE p.OwnerUserId = 22656
AND   p.PostTypeId = 1
ORDER BY p.Score DESC;

SELECT TOP (10)
    p.*
FROM dbo.Posts AS p
WHERE p.OwnerUserId = 22656
AND   p.LastActivityDate >= '20130101'
ORDER BY p.Score DESC;

SELECT TOP (10)
    p.*
FROM dbo.Posts AS p
WHERE p.OwnerUserId = 22656
AND   p.Score > 0
ORDER BY p.Score DESC;
Index Real Dumb
Which means that all of our missing index requests are going to be on maybe a couple key columns, and then include every other column in the Posts table.
This is a bad idea, so we’re going to dismiss the includes and focus on keys.
CREATE INDEX [OwnerUserId_LastActivityDate_Includes]
    ON [StackOverflow2013].[dbo].[Posts] ([OwnerUserId], [LastActivityDate]);

CREATE INDEX [OwnerUserId_Score_Includes]
    ON [StackOverflow2013].[dbo].[Posts] ([OwnerUserId], [Score]);

CREATE INDEX [OwnerUserId_PostTypeId_Includes]
    ON [StackOverflow2013].[dbo].[Posts] ([OwnerUserId], [PostTypeId]);

CREATE INDEX [OwnerUserId_CreationDate_Includes]
    ON [StackOverflow2013].[dbo].[Posts] ([OwnerUserId], [CreationDate]);

CREATE INDEX [OwnerUserId_Includes]
    ON [StackOverflow2013].[dbo].[Posts] ([OwnerUserId]);
Now that we’ve got a more sane bunch of requests to focus on, let’s do something thinking.
I hate thinking, so we won’t do a lot of it.
Indexes put data in order, and equality predicates preserve ordering of secondary index columns. That makes putting the key on (OwnerUserId, Score) a no-brainer. One could make an entire career out of avoiding sorting in the database.
But now we have three other columns to think about: LastActivityDate, PostTypeId, and CreationDate.
We could spend a whole lot of time trying to figure out the best order here, considering things like: equality predicates vs inequality predicates, and selectivity, etc.
But what good would it do?
Dirty Secret
No matter what order we might put index key columns in after Score, it won’t matter. Most of our queries don’t search on OwnerUserId and then Score. Only one of them does, and it doesn’t search on anything else.
That means that most of the time, we’d be seeking to OwnerUserId, and then performing residual predicates against other columns we’re searching on.
On top of that, we’d have whatever overhead there is of keeping things in order when we modify data in the key of the index. Not that included columns are free-of-charge to modify, but you get my point. There’s no order preserved in them.
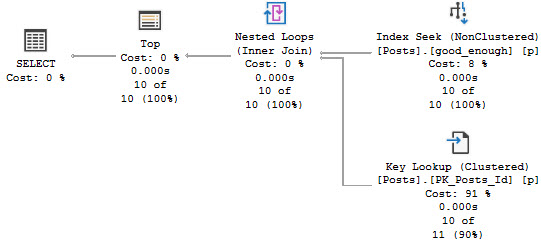
In reality, a good-enough-index for the good-enough-optimizer to come up with a good-enough-plan looks like this:
CREATE INDEX good_enough
    ON dbo.Posts
        (OwnerUserId, Score)
    INCLUDE
        (PostTypeId, CreationDate, LastActivityDate);
Planama
The index above does two things:
It helps us search on a selective predicate on OwnerUserId
It keeps Score in order after the quality so the order by is free
It has all the other potential filtering elements so we can apply predicates locally
It teaches us that include column order doesn’t matter
All of the query plans will look roughly like this, regardless of the where clause:
you can do it
What Difference Does It Make?
Alright, so we’ve got one good-enough index for a bunch of different queries. By adding the index, we got all of them to go from taking ~600ms to taking 0ms.
What else did we do?
We made them faster without going parallel
They no longer need memory to sort data
And we did it without creating a gigantic covering index.
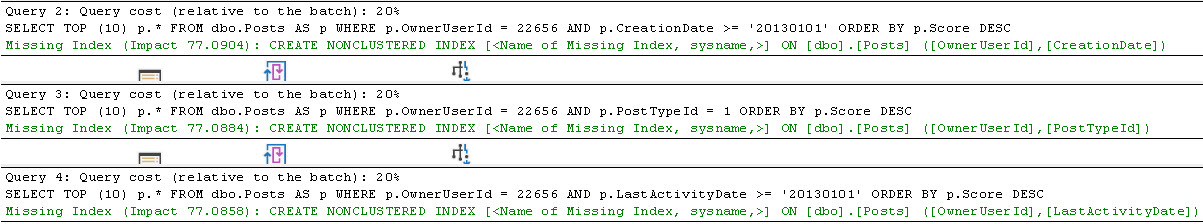
Of course, the optimizer still thinks we need indexes…
of what?
But do we really need them?
No.
77% of nothing is nothing.
Thanks for reading!
Going Further
If this is the kind of SQL Server stuff you love learning about, you’ll love my training. I’m offering a 75% discount to my blog readers if you click from here. I’m also available for consulting if you just don’t have time for that and need to solve performance problems quickly.
In yesterday’s post, we talked a little about different ways to approach looking at missing index requests, and how their benefit is calculated in sp_BlitzIndex.
If you’re on SQL Server 2019, you may be able to get some idea which queries are generating missing index requests. It’s not documented yet, but that’s never stopped anyone from using anything in production.
Let’s look at the queries asking for them.
Natural Ruckus
Let’s take a look at what queries are causing those missing index requests.
Since I’m running them, I don’t have to do any work.
SELECT TOP (10)
    p.*
FROM dbo.Posts AS p
WHERE p.OwnerUserId = 22656
ORDER BY p.Score DESC;

SELECT TOP (10)
    p.*
FROM dbo.Posts AS p
WHERE p.OwnerUserId = 22656
AND   p.CreationDate >= '20130101'
ORDER BY p.Score DESC;

SELECT TOP (10)
    p.*
FROM dbo.Posts AS p
WHERE p.OwnerUserId = 22656
AND   p.PostTypeId = 1
ORDER BY p.Score DESC;

SELECT TOP (10)
    p.*
FROM dbo.Posts AS p
WHERE p.OwnerUserId = 22656
AND   p.LastActivityDate >= '20130101'
ORDER BY p.Score DESC;

SELECT TOP (10)
    p.*
FROM dbo.Posts AS p
WHERE p.OwnerUserId = 22656
AND   p.Score > 0
ORDER BY p.Score DESC;
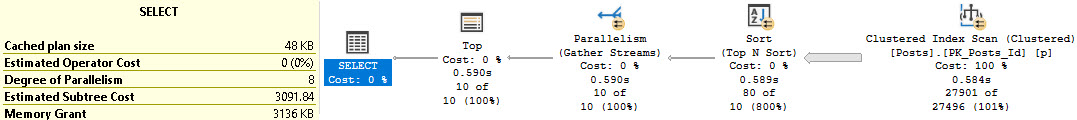
Without any helpful indexes, all of these take about the same amount of time — between 600 and 700ms, and most of the time is spent scanning the clustered index on Posts, which is around 17 million rows, just to return ~27k rows..
That’s Not “Slow”
Usually when people are complaining about slow queries, they’re talking about stuff that drags on for several seconds or longer.
At just about half a second, most people wouldn’t getting a running start to jump through hoops to make these faster.
But they all have a “high cost” of a touch over 3000 query bucks. If you’re the type of person who only focuses on one metric, you might be overlooking a whole lot of things that need attention.
spuriously yours
If we made this query 99% faster, it would mean a rather miniscule improvement in elapsed time. The flip side of the one-metric thing is using duration alone as a metric. Queries might have a very long duration because they’re blocked, but use minimal resource when they’re finally allowed to run by the gods of ACID compliance.
My favorite queries to find and tune are ones that:
Unnecessarily run for a long time, using a lot of CPU
Unnecessarily ask for large memory grants
Have issues with parameter sniffing
Let’s pretend there might be some value to tuning these, though. Maybe we’re upset that they’re going parallel. Maybe we have something against scanning clustered indexes. Maybe we just don’t have anything else to do.
In tomorrow’s post, we’ll look at how to take all of those requests and come up with one good enough-index for our queries.
Just like how the optimizer comes up with one “good enough” plan for all queries.
Thanks for reading!
Going Further
If this is the kind of SQL Server stuff you love learning about, you’ll love my training. I’m offering a 75% discount to my blog readers if you click from here. I’m also available for consulting if you just don’t have time for that and need to solve performance problems quickly.
I often find myself reviewing missing index requests during consulting engagements. Not because they’re so awesome, but because they’re often just good enough to provide some quick relief before more fine-tuned efforts are explored.
More to the point: if someone has no idea which queries they need to tune, and everything is pretty slow, this is a good starting place.
Given sufficient server uptime, of course.
World Tour
Sometimes you’ll see that slam-dunk missing index request with lots of uses, and you can tie it to a query that you know is bad. Of course, I’m quite partial to using sp_BlitzIndex to analyze indexes. There are a few different places that missing indexes will be detailed in.
Mode 0: the most important stuff
Mode 4: anything and everything
Mode 3: just missing index requests
Table Mode: analyzing just one table
The easiest way to find examples like I’ll be talking about is to look at just one table. In this case, the Posts table.
EXEC sp_BlitzIndex @TableName = 'Posts';
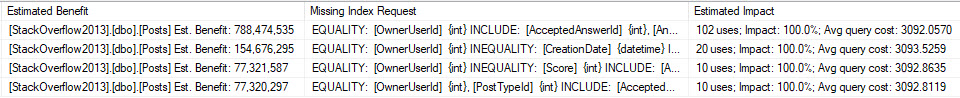
If you have missing index requests for a table, they’ll look something like this:
where you ack
That estimated benefit number is pretty big here, so it jumps out a bit. Normally I don’t start really paying attention until that number is >5 million. That’s not terribly scientific, but you have to draw the line somewhere.
Of course, one very sneaky thing to consider is when you have a set of duplicative requests with low-ish estimated benefit individually, but combined they just might add up to something quite useful.
Just A Kid
The estimated benefit number is just a function of the three feedback metrics that get logged with missing index requests: uses * impact * average query cost.
Uses is a fairly reliable metric, but impact and average query cost are a little more hand-wavy. Even high-cost queries can be very fast. It doesn’t mean that they can’t be tuned or don’t need indexes, but they might not be your worst-performers.
In tomorrow’s post, we’ll look at that, and how you can come up with a good-enough index for a bunch of similar queries.
Thanks for reading!
Going Further
If this is the kind of SQL Server stuff you love learning about, you’ll love my training. I’m offering a 75% discount to my blog readers if you click from here. I’m also available for consulting if you just don’t have time for that and need to solve performance problems quickly.
Class Title: The Beginner’s Guide To Advanced Performance Tuning
Abstract: You’re new to SQL Server, and your job more and more is to fix performance problems, but you don’t know where to start.
You’ve been looking at queries, and query plans, and puzzling over indexes for a year or two, but it’s still not making a lot of sense.
Beyond that, you’re not even sure how to measure if your changes are working or even the right thing to do.
In this full day performance tuning extravaganza, you’ll learn about all the most common anti-patterns in T-SQL querying and indexing, and how to spot them using execution plans. You’ll also leave knowing why they cause the problems that they do, and how you can solve them quickly and painlessly.
If you want to gain the knowledge and confidence to tune queries so they’ll never be slow again, this is the training you need.
If this is the kind of SQL Server stuff you love learning about, you’ll love my training. I’m offering a 75% discount to my blog readers if you click from here. I’m also available for consulting if you just don’t have time for that and need to solve performance problems quickly.
I know, it sounds foolish. Trivial, even. Don’t let people make changes without permission.
But the number of times I’ve been reviewing server hardware and settings with people, and they’ve started head scratching about how something ended up the way it did is fairly astounding.
There’s almost no way to audit every since change, either.
Fun, right? SQL is fun. That’s why everyone acts like it’s terrible. We wanna keep the fun to ourselves.
Sticker Shock
There are a lot of things that can change under the covers.
One fairly sneaky thing is if someone makes sp_configure changes without running configure, that kick in after a reboot.
Unexpected failovers, patching cycles that require reboots, and all sorts of other bump-in-the-night incidents can lead to this.
On top of that, there are just so many settings that can cause erratic performance, it’d be disingenuous of me to list them all here, even though it’d probably be great for SEO.
Instead, have a scroll through this list. See what I mean?
You’re gonna have a hard time remembering to keep track of what all your settings are now, and if they’re different in the middle of a performance storm. I don’t usually tell people to run sp_Blitz when that’s going on, but it can be a good sanity check, too.
Not all performance problems are caused by the robots. Some are caused by the humans, too.
For a general check, I’ll run it like this:
sp_Blitz @CheckServerInfo = 1;
You might be able to get to the root cause of things pretty quickly.
Thanks for reading!
Going Further
If this is the kind of SQL Server stuff you love learning about, you’ll love my training. I’m offering a 75% discount to my blog readers if you click from here. I’m also available for consulting if you just don’t have time for that and need to solve performance problems quickly.
Okay look, you probably should update stats. At least when you do it, you have some control over the situation.
If you let SQL Server get up to its own devices, you might become quite surprised.
One after-effect of updated stats is, potentially, query plan invalidation. When that happens, SQL Server might get hard to work coming up with a new plan that makes sense based on these new statistics.
And that, dear friends, is where things can go bad.
New Contributor ?
Let’s say we have this query, which returns the average post and comment score for a single user.
CREATE OR ALTER PROCEDURE dbo.AveragePostScore(@UserId INT)
AS
BEGIN
SET NOCOUNT, XACT_ABORT ON;

SELECT u.DisplayName,
       AVG(p.Score * 1.) AS lmao_p,
       AVG(c.Score * 1.) AS lmao_c
FROM   dbo.Users AS u
JOIN   dbo.Posts AS p
    ON p.OwnerUserId = u.Id
JOIN   dbo.Comments AS c
    ON c.UserId = u.Id
WHERE u.Id = @UserId
GROUP BY u.DisplayName;

END;
GO
Most of the time, the query runs fast enough for the occasional run to not end too poorly.
But then a recompile happens, and a new contributor decides to look at their profile.
Okay To Worse
What comes next you could fill a textbook with.
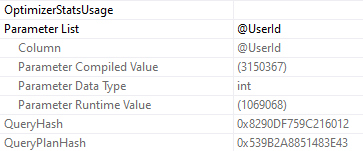
EXEC dbo.AveragePostScore @UserId = 3150367;
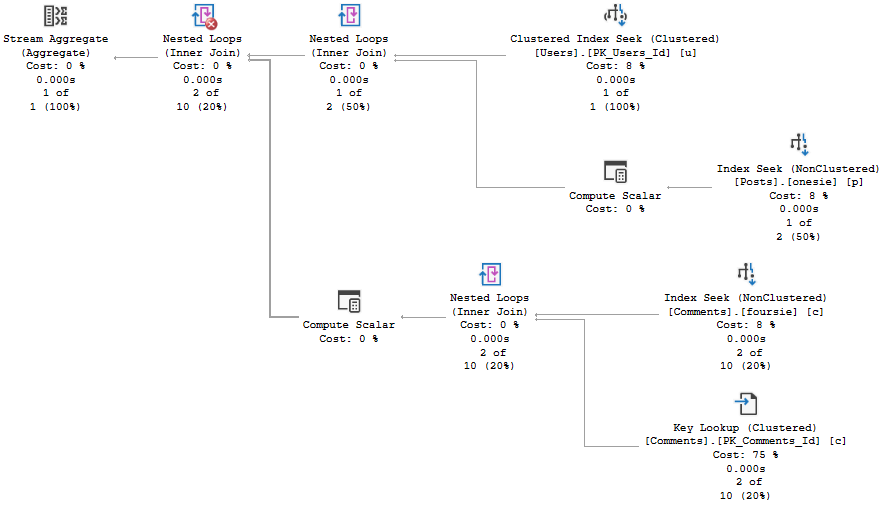
A new plan gets compiled:
wouldn’t get far
And you know, it looks great for a new user.
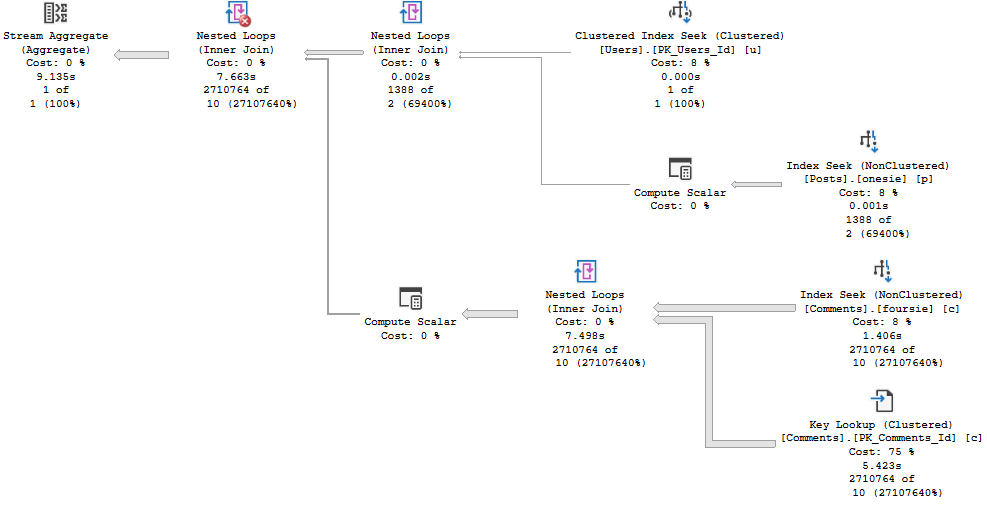
And you know, it looks not so great for a slightly more seasoned user.
you shouldn’t have!
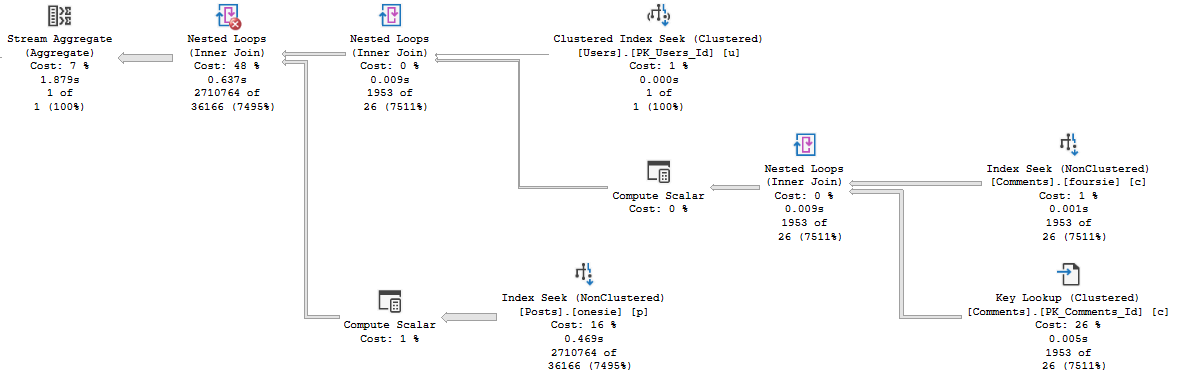
So What Changed?
Running the query first for a user with a bit more site history gives us a plan with a very different shape, that finishes in under 2 seconds. Repeating that plan for less experienced users doesn’t cause any problems. It finishes in very little time at all.
JERN ERDR
The plan itself remains largely more familiar than most parameter sniffing scenarios wind up. There are plenty more similarities than differences. It really does just come down to join order here.
Alright, now we know what happened. How would we figure out if this happened to us IRL?
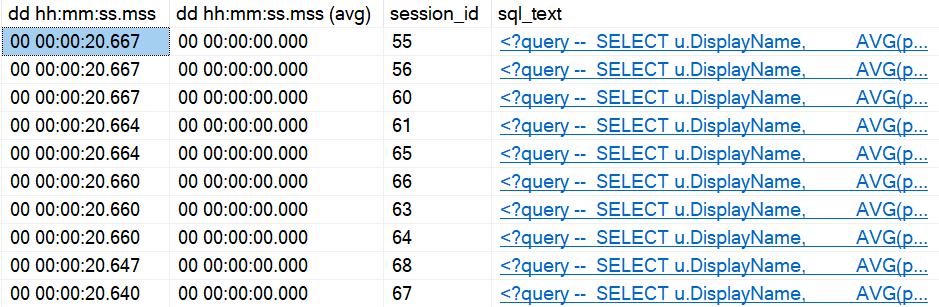
I Shot The Trouble
We can do what we did yesterday, and run sp_BlitzFirst. That’ll warn us if stats recently got updated.
To use DBCC FREEPROCCACHE to target a specific query, you need the sql handle or plan handle. You don’t wanna jump off and clear the whole cache here, unless you’re desperate. Just make sure you understand that you might fix one query, and break others, if you clear the whole thing.
It’s better to be targeted when possible.
And of course, if you’ve got Query Store up and running, you may do well to look at Regressed or High Variance query views there, and force the faster plan.
Thanks for reading!
Going Further
If this is the kind of SQL Server stuff you love learning about, you’ll love my training. I’m offering a 75% discount to my blog readers if you click from here. I’m also available for consulting if you just don’t have time for that and need to solve performance problems quickly.