Class Title: The Beginner’s Guide To Advanced Performance Tuning
Abstract: You’re new to SQL Server, and your job more and more is to fix performance problems, but you don’t know where to start.
You’ve been looking at queries, and query plans, and puzzling over indexes for a year or two, but it’s still not making a lot of sense.
Beyond that, you’re not even sure how to measure if your changes are working or even the right thing to do.
In this full day performance tuning extravaganza, you’ll learn about all the most common anti-patterns in T-SQL querying and indexing, and how to spot them using execution plans. You’ll also leave knowing why they cause the problems that they do, and how you can solve them quickly and painlessly.
If you want to gain the knowledge and confidence to tune queries so they’ll never be slow again, this is the training you need.
If this is the kind of SQL Server stuff you love learning about, you’ll love my training. I’m offering a 75% discount to my blog readers if you click from here. I’m also available for consulting if you just don’t have time for that and need to solve performance problems quickly.
Okay look, you probably should update stats. At least when you do it, you have some control over the situation.
If you let SQL Server get up to its own devices, you might become quite surprised.
One after-effect of updated stats is, potentially, query plan invalidation. When that happens, SQL Server might get hard to work coming up with a new plan that makes sense based on these new statistics.
And that, dear friends, is where things can go bad.
New Contributor ?
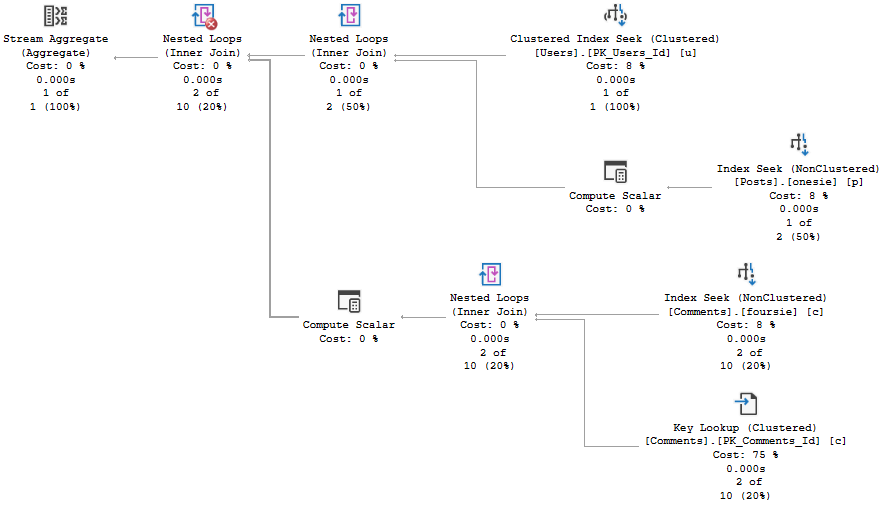
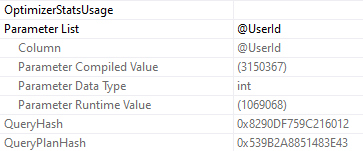
Let’s say we have this query, which returns the average post and comment score for a single user.
CREATE OR ALTER PROCEDURE dbo.AveragePostScore(@UserId INT)
AS
BEGIN
SET NOCOUNT, XACT_ABORT ON;

SELECT u.DisplayName,
       AVG(p.Score * 1.) AS lmao_p,
       AVG(c.Score * 1.) AS lmao_c
FROM   dbo.Users AS u
JOIN   dbo.Posts AS p
    ON p.OwnerUserId = u.Id
JOIN   dbo.Comments AS c
    ON c.UserId = u.Id
WHERE u.Id = @UserId
GROUP BY u.DisplayName;

END;
GO
Most of the time, the query runs fast enough for the occasional run to not end too poorly.
But then a recompile happens, and a new contributor decides to look at their profile.
Okay To Worse
What comes next you could fill a textbook with.
EXEC dbo.AveragePostScore @UserId = 3150367;
A new plan gets compiled:
wouldn’t get far
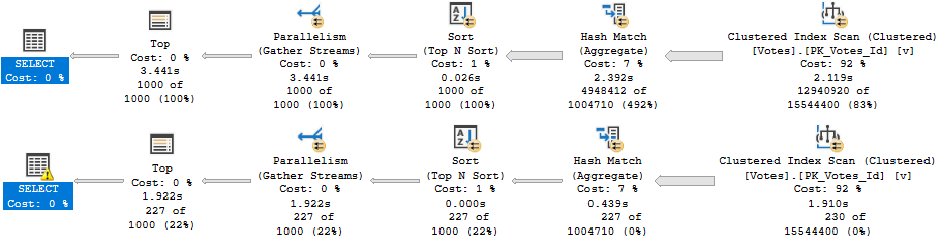
And you know, it looks great for a new user.
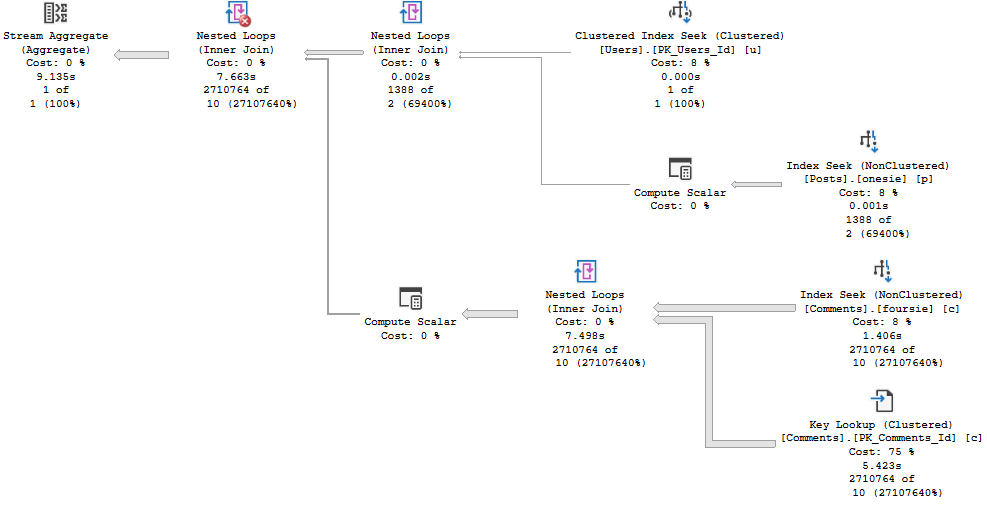
And you know, it looks not so great for a slightly more seasoned user.
you shouldn’t have!
So What Changed?
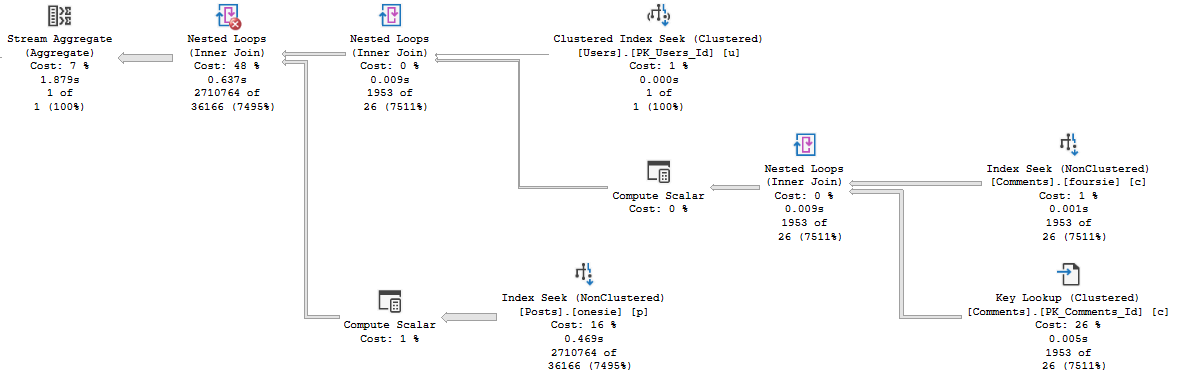
Running the query first for a user with a bit more site history gives us a plan with a very different shape, that finishes in under 2 seconds. Repeating that plan for less experienced users doesn’t cause any problems. It finishes in very little time at all.
JERN ERDR
The plan itself remains largely more familiar than most parameter sniffing scenarios wind up. There are plenty more similarities than differences. It really does just come down to join order here.
Alright, now we know what happened. How would we figure out if this happened to us IRL?
I Shot The Trouble
We can do what we did yesterday, and run sp_BlitzFirst. That’ll warn us if stats recently got updated.
To use DBCC FREEPROCCACHE to target a specific query, you need the sql handle or plan handle. You don’t wanna jump off and clear the whole cache here, unless you’re desperate. Just make sure you understand that you might fix one query, and break others, if you clear the whole thing.
It’s better to be targeted when possible.
And of course, if you’ve got Query Store up and running, you may do well to look at Regressed or High Variance query views there, and force the faster plan.
Thanks for reading!
Going Further
If this is the kind of SQL Server stuff you love learning about, you’ll love my training. I’m offering a 75% discount to my blog readers if you click from here. I’m also available for consulting if you just don’t have time for that and need to solve performance problems quickly.
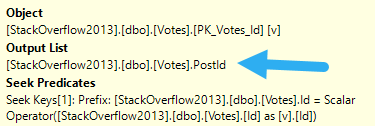
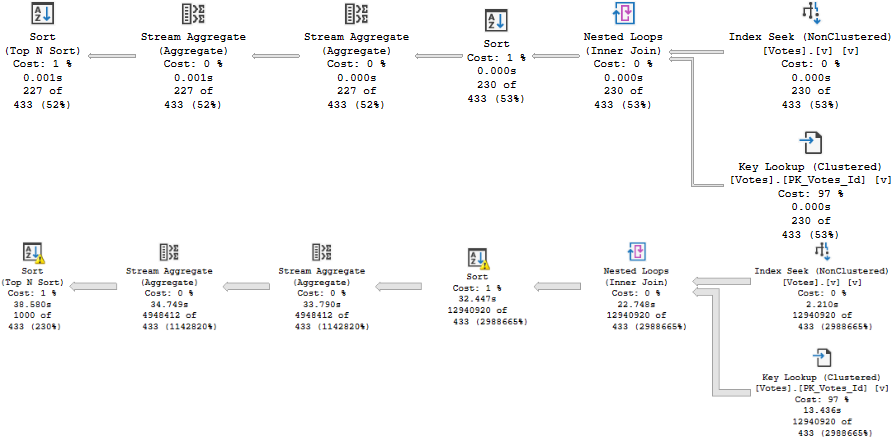
It would certainly be a good candidate for index changes though, because the first thing we need to address is that key lookup.
It’s a sensitive issue.
King Index
We’re going to walk through something I talked about what seems like an eternity ago. Why? Because it has practical application here.
When you look at the core part of the query, PostId is only in the select list. Most advice around key lookups (including, generally, my own) is to consider putting columns only in the output into the includes of the index.
and that’s where this is
But we’re in a slightly different situation, here.
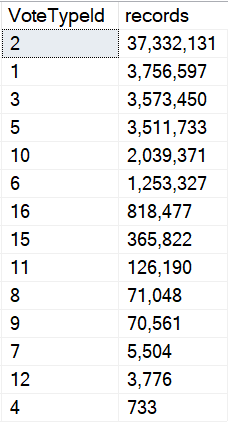
SELECT v.VoteTypeId,
       v.PostId,
       COUNT_BIG(v.PostId) AS TotalPosts,
       COUNT_BIG(DISTINCT v.PostId) AS UniquePosts
FROM dbo.Votes AS v
WHERE v.CreationDate >= DATEADD(YEAR, (-1 * @YearsBack), '2014-01-01')
AND   v.VoteTypeId = @VoteTypeId
GROUP BY v.VoteTypeId,
         v.PostId
We’re getting a distinct count, and SQL Server has some choices for coming up with that.
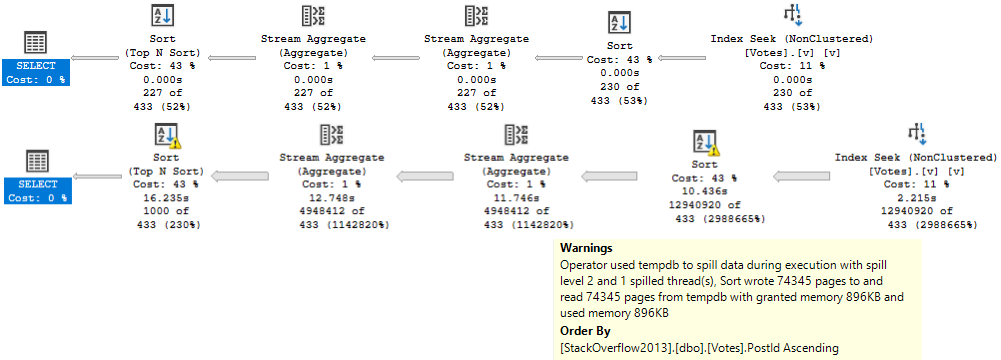
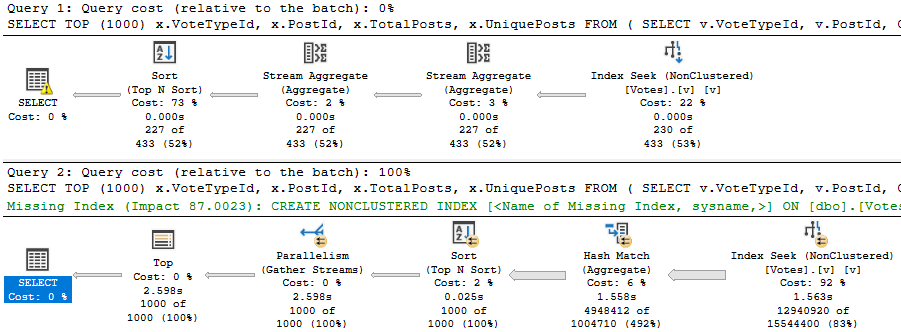
If we follow the general advice here and create this index, we’ll end up in trouble:
CREATE INDEX v
    ON dbo.Votes(VoteTypeId, CreationDate) INCLUDE(PostId)
    WITH (DROP_EXISTING = ON);
growling intensifies
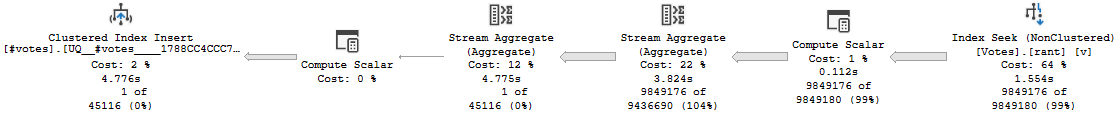
Since the Stream Aggregate expects ordered data, and PostId isn’t in order in the index (because includes aren’t in any particular order), we need to sort it. For a small amount of data, that’s fine. For a large amount of data, it’s not.
There is a second Sort in the plan further down, but it’s on the count expression, which means we can’t index it without adding in additional objects, like an indexed view.
SELECT TOP (1000)
    x.VoteTypeId,
    x.PostId,
    x.TotalPosts,
    x.UniquePosts
FROM
    (
        SELECT v.VoteTypeId,
               v.PostId,
               COUNT_BIG(v.PostId) AS TotalPosts, -- this is the expression
               COUNT_BIG(DISTINCT v.PostId) AS UniquePosts
        FROM dbo.Votes AS v
        WHERE v.CreationDate >= DATEADD(YEAR, (-1 * @YearsBack), '2014-01-01')
        AND   v.VoteTypeId = @VoteTypeId
        GROUP BY v.VoteTypeId,
                 v.PostId
    ) AS x
ORDER BY x.TotalPosts DESC; -- this is the ordering
What’s An Index To A Non-Believer?
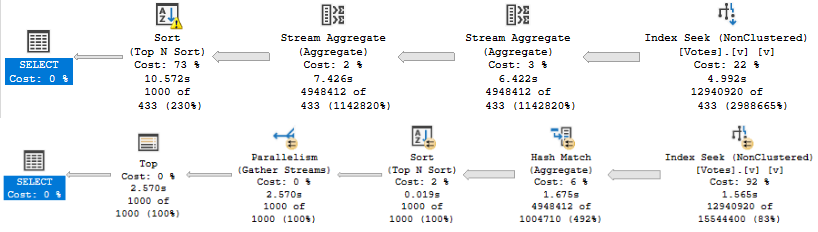
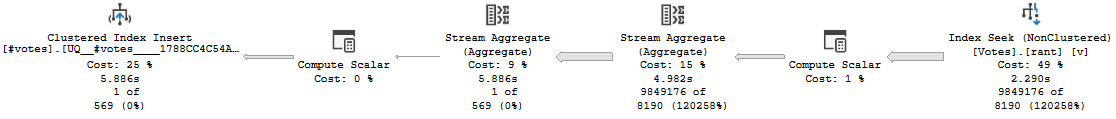
A better index in this case looks like this:
CREATE INDEX v
    ON dbo.Votes(VoteTypeId, PostId, CreationDate)
    WITH (DROP_EXISTING = ON);
It will shave about 6 seconds off the run time, but there’s still a problem when the “big” data doesn’t go parallel:
big data differences
When the plan goes parallel, it’s about 4x faster than the serial version. Now I know what you’re thinking, here. We could use OPTIMIZE FOR to always get the plan for the big value. And that’s not a horrible idea — the small data parameter runs very quickly re-using the parallel plan here — but there’s another way.
Let’s look at our data.
Don’t Just Stare At It
Let’s draw an arbitrary line. I think a million is a popular number. I wish it was a popular number in my bank account, but you know.
unwritten law
I know we’re ignoring the date column data, but this is good enough for now. There’s only so much I can squeeze into one blog post.
The point here is that we’re going to say that anything under a million rows is okay with using the small plan, and anything over a million rows needs the big plan.
Sure, we might need to refine that later if there are outliers within those two groups, but this is a blog post.
How do we do that? We go dynamic.
Behike 54
Plan ol’ IF branches plan ol’ don’t work. We need something to get two distinct plans that are re-usable.
Here’s the full procedure:
CREATE OR ALTER PROCEDURE dbo.VoteCount (@VoteTypeId INT, @YearsBack INT)
AS
BEGIN

DECLARE @sql NVARCHAR(MAX) = N'';

SET @sql += N'
SELECT TOP (1000)
    x.VoteTypeId,
    x.PostId,
    x.TotalPosts,
    x.UniquePosts
/*dbo.VoteCount*/
FROM
    (
        SELECT v.VoteTypeId,
               v.PostId,
               COUNT_BIG(v.PostId) AS TotalPosts,
               COUNT_BIG(DISTINCT v.PostId) AS UniquePosts
        FROM dbo.Votes AS v
        WHERE v.CreationDate >= DATEADD(YEAR, (-1 * @YearsBack), ''2014-01-01'')
        AND   v.VoteTypeId = @VoteTypeId '

IF @VoteTypeId IN (2, 1, 3, 5, 10, 6)
BEGIN
    SET @sql += N'
        AND 1 = (SELECT 1)'
END

IF @VoteTypeId IN (16, 15, 11, 8, 9, 7, 12, 4)
BEGIN
    SET @sql += N'
        AND 2 = (SELECT 2)'
END

SET @sql += N'
        GROUP BY v.VoteTypeId,
                 v.PostId
    ) AS x
ORDER BY x.TotalPosts DESC;
';

RAISERROR('%s', 0, 1, @sql) WITH NOWAIT;

EXEC sys.sp_executesql @sql,
                       N'@VoteTypeId INT, @YearsBack INT',
                       @VoteTypeId, @YearsBack;

END;
There’s a bit going on in there, but the important part is in the middle. This is what will give use different execution plans.
IF @VoteTypeId IN (2, 1, 3, 5, 10, 6)
BEGIN
    SET @sql += N'
        AND 1 = (SELECT 1)'
END

IF @VoteTypeId IN (16, 15, 11, 8, 9, 7, 12, 4)
BEGIN
    SET @sql += N'
        AND 2 = (SELECT 2)'
END
Sure, there are other ways to do this. You could even selectively recompile if you wanted to. But some people complain when you recompile. It’s cheating.
Because the SQL Server Query Optimizer typically selects the best execution plan for a query, we recommend only using hints as a last resort for experienced developers and database administrators.
See? It’s even documented.
Now that we’ve got that all worked out, we can run the proc and get the right plan depending on the amount of data we need to shuffle around.
strangers in the night
Little Star
Now I know what you’re thinking. You wanna know more about that dynamic SQL. You want to solve performance problems and have happy endings.
We’ll do that next week, where I’ll talk about common issues, best practices, and more tricks you can use to get queries to perform better with it.
Thanks for reading!
Going Further
If this is the kind of SQL Server stuff you love learning about, you’ll love my training. I’m offering a 75% discount to my blog readers if you click from here. I’m also available for consulting if you just don’t have time for that and need to solve performance problems quickly.
Alright, maybe not any database. Let’s stick with SQL Server. That’s the devil we know.
At some point in your life, you’re going to construct a query that takes user input, and that input is likely going to come in the form of a parameter.
It could be a stored procedure, dynamic SQL, or something from your application. But there it is.
Waiting. Watching.
Sniffing.
Defining A Problem
When we use parameters, we re-use execution plans, at least until a Qualifying Event™ occurs.
What’s a qualifying event?
Recompile hint
Stats update
Temp table modification threshold
Plan eviction
Server restart
Now, it might be reasonable to think that a mature optimizer — and it is an optimizer, not just a planner — would be able to do something a bit more optimal. After all, why would anyone think it would take the same amount of work to get through 100 rows as it would take to get through 1,000,000 rows? It’s a fundamentally different approach.
Doing a run to the grocery store to replenish a few things requires a far different mindset from going to prepare for a large family meal. You have to choose between a basket or a cart, whether you can jump right to the couple spots you need or you need to walk up and down every aisle, and even if you might need to write down a list because it doesn’t fit into brain memory.
One might also have the expectation that if a significant inaccuracy is detected at runtime, the strategy might change. While that does sort of happen with Adaptive Joins, it’s not a full plan rewrite.
Detecting A Problem
The plan cache usually sucks for this, unless you’re saving the data off to more stable tables. Why? Because most people only figure out they’ve been sniffed after a plan changes, which means it’s not in the cache anymore. You know, when end users start complaining, the app goes unresponsive, you can’t connect to the server, etc.
You could set your watch to it.
But sometimes it’s there. Some funny looking little plan that looks quite innocent, but seems to do a lot of work when you bang it up against other DMVs.
If you have the luxury, Query Store is quite a better tool for detecting plan changes. It’s even got reports built in just for that.
how nice of you.
For the extra fancy amongst you, I pray that your expensive monitoring tool has a way to tell you when query plans change, or when normally fast plans deviate from that.
Deciphering A Problem
This is where things can get difficult, unless you’re monitoring or logging information. You typically need a few different combinations of parameter values to feed in to your query, so you can see what changed and when. Quite often, there’s no going back easily.
Let’s say you had a plan, and it was a good plan. Then one of those pesky qualifying events comes along, and it’s decided that you need a new plan.
And what if… that new plan is worse? No matter how much you recompile or update stats or toggle with cardinality estimation, you just can’t go back to the way things were without lots of hints or changes to the query? Maybe that’s not parameter sniffing. Maybe that’s parameter snuffing. I’m gonna copyright that.
Most parameter sniffing will result in a plan with a set of bad choices for different amounts of data, which will result in something like this:
not crafty
This isn’t a “bad estimate” — it was a pretty good estimate for the first parameter value. It just wasn’t a good estimate for the second parameter value.
And to be honest, quite a bit of parameter sniffing issues come from Nested Loops. Not because it’s bad, but because it’s bad for large amount of data, especially in a serial plan. It’s a pretty easy way to gum up a query, though. Make it get stuck in a loop for 13 million rows. It wasn’t fast? No kidding. Poof, be gone.
But then opposite-land isn’t good, either.
like falling, baby
This plan probably makes plenty of sense for a big chunk of data. One big scan, one big hash, one big sort. Done.
Of course, for a small amount of data, we go from taking 1ms to taking 2s. Small amount of data people will likely not be happy with that. Your server might not be either, what with all the extra CPU resources we’re using in this here parallel plan all the time now.
Tomorrow, we’ll look at how sometimes you can fix parameter sniffing with better indexes.
Thanks for reading!
Going Further
If this is the kind of SQL Server stuff you love learning about, you’ll love my training. I’m offering a 75% discount to my blog readers if you click from here. I’m also available for consulting if you just don’t have time for that and need to solve performance problems quickly.
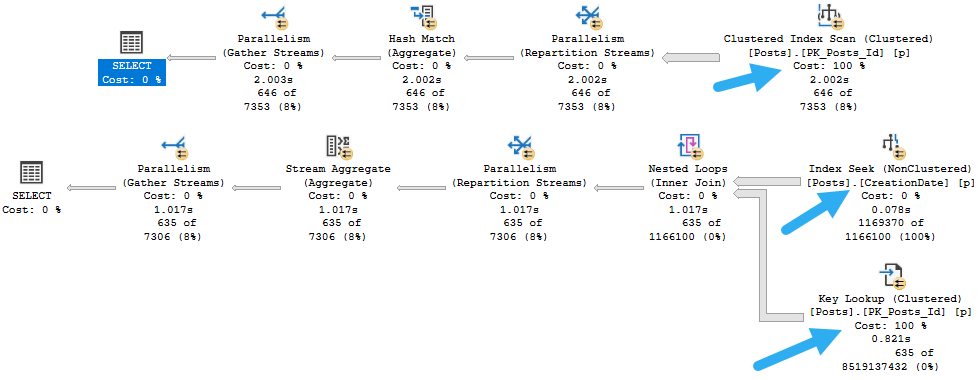
We don’t need to add a ton of columns to our query to have index usage change, but we do need to go back in time a little bit.
Here’s our query now, with just a one day difference in the where clause.
SELECT p.CreationDate,
       COUNT_BIG(*) AS records
FROM dbo.Posts AS p
WHERE p.CreationDate >= '20131015'
AND   p.OwnerUserId = 22656
GROUP BY p.CreationDate;


SELECT p.CreationDate,
       COUNT_BIG(*) AS records
FROM dbo.Posts AS p
WHERE p.CreationDate >= '20131016'
AND   p.OwnerUserId = 22656
GROUP BY p.CreationDate;
Not quite Halloween, but I’ll take the spooky factor.
The other difference is that now we’ve got the OwnerUserId column in there, which isn’t in our nonclustered index.
It’s in the where clause, not the select list, but if we added it there it would have a similar effect on the query. Either way, we have to do something with this new column, and we have to get it from somewhere.
CREATE INDEX CreationDate ON dbo.Posts(CreationDate);
Things Are Looking Up
The query plans for these will look a little bit different.
what’s it for
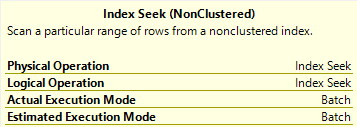
If you’re not familiar with what just happened here, a Key Lookup is a trick the optimizer has up its sleeve. It uses two indexes from the same table to satisfy one query.
We find rows in our nonclustered index that qualify for the filter on CreationDate. That’s a smart start!
Then we join the nonclustered index to the clustered index to find any columns we might need. Remember the clustered index has all the table columns in it.
Stuff like this is made possible by nonclustered indexes inheriting clustered index key columns. Crazy, right?
The Point At This Point
There are many internal details to explore around Key Lookups. There are even some interesting things about how clustered index keys get stored in nonclustered indexes.
What you need to know about Lookups right now is what they are (which we talked about), and that they represent a choice the optimizer has when it comes to index usage.
If you create a narrow index, say one that satisfies some part of the query like the join or where clause, but doesn’t fully contain all of the columns referenced in your query, it may not get used reliably. The usage is decided based on cardinality estimates. The more rows SQL Server expects, the less likely it is that your narrow index will get used.
For example, it may only get used when the value for CreationDate is estimated to return a small-ish number of rows. Parameterization and plan re-use can make this even more confusing.
Next, we’ll look at how we can encourage the optimizer to choose narrow indexes, and the problems we might run into.
Thanks for reading!
Going Further
If this is the kind of SQL Server stuff you love learning about, you’ll love my training. I’m offering a 75% discount to my blog readers if you click from here. I’m also available for consulting if you just don’t have time for that and need to solve performance problems quickly.
I’m going to show you something bizarre. I’m going to show it to you because I care for your well-being and long term mental health.
Someday you’ll run into this and be thoroughly baffled, and I want to be here for you. Waiting, watching, lubricating.
I have a stored procedure. It’s a wonderful stored procedure.
But something funny happens when a parameter gets sniffed.
Wrote A Little Song About It
It’s not the usual parameter sniffing thing, where you get different plans and blah blah blah. That’s dull.
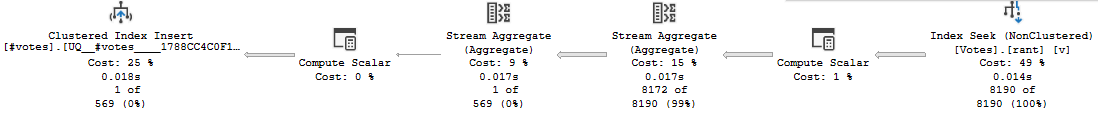
This is even more infuriating. Here’s the part where care about, where we read data to insert into the #temp table.
something new
This is the “small” version of the plan. It only moves about 8200 rows.
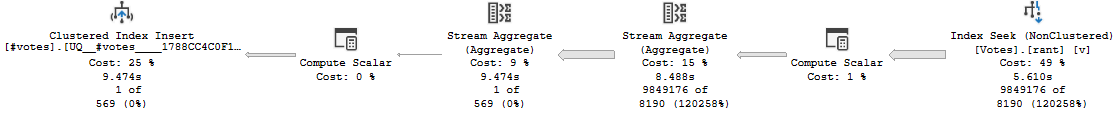
Now here’s the “big” version of the plan.
practice makes
We move way more rows out of the seek (9.8 million), but doesn’t it seem weird that a seek would take 5.6 seconds?
I think so.
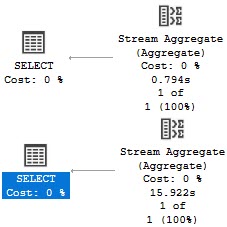
Pay special attention here, because both queries aggregate the result down to one row, and the insert to the #temp table is instant both times.
Wanna Hear It?
Let’s do what most good parameter sniffing problem solvers do, and re-run the procedure after recompiling for the “big” value.
escapism
It’s the exact same darn plan.
Normally, when you’re dealing with parameter sniffing, and you recompile a procedure, you get a different plan for different values.
Not here though. Yes, it’s faster, but it’s the same operators. Seek, Compute, Stream, Stream, Compute, Insert 1 row.
Important to note here is that the two stream aggregates take around the same about of time as before too.
The real speed up was in the Seek.
How do you make a Seek faster?
YOU NEEK UP ON IT.
Three Days Later
I just woke up from beating myself with a hammer. Sorry about what I wrote before. That wasn’t funny.
But okay, really, what happened? Why is one Seek 4 seconds faster than another seek?
Locking.
All queries do it, and we can prove that’s what’s going on here by adding a locking hint to our select query.
Now, I understand why NOLOCK would set your DBA in-crowd friends off, and how TABLOCK would be an affront to all sense and reason for a select.
So how about a PAGLOCK hint? That’s somewhere in the middle.
what we got here
The Seek that took 5.6 seconds is down to 2.2 seconds.
And all this time people told you hints were bad and evil, eh?
YTHO?
It’s pretty simple, once you talk it out.
All queries take locks (even NOLOCK/READ UNCOMMITTED queries).
Lock escalation doesn’t usually happen with them though, because locks don’t accumulate with read queries the way they do with modification queries. They grab on real quick and then let go (except when…).
For the “small” plan, we start taking row locks, and keep taking row locks. The optimizer has informed the storage engine that ain’t much ado about whatnot here, because the estimate (which is correct) is only for 8,190 rows.
That estimate is preserved for the “big” plan that has to go and get a lot more rows. Taking all those additional row locks really slows things down.
No Accumulation, No Escalation.
We stay on taking 9.8 million row locks instead of escalating up to page or object locks.
When we request page locks from the get-go, we incur less overhead.
For the record:
PAGLOCK: 2.4 seconds
TABLOCK: 2.4 seconds
NOLOCK: 2.4 seconds
Nothing seems to go quite as fast as when we start with the “big” parameter, but there’s another reason for that.
When we use the “big” parameter, we get batch mode on the Seek.
A FULL SECOND
Welcome to 2019, pal.
Thanks for reading!
Going Further
If this is the kind of SQL Server stuff you love learning about, you’ll love my training. I’m offering a 75% discount to my blog readers if you click from here. I’m also available for consulting if you just don’t have time for that and need to solve performance problems quickly.
If this is the kind of SQL Server stuff you love learning about, you’ll love my training. I’m offering a 75% discount to my blog readers if you click from here. I’m also available for consulting if you just don’t have time for that and need to solve performance problems quickly.
Normally, I link people to this post by Kendra and this post by Paul when I need to point them to information about what goes wrong with local variables. They’re both quite good, but I wanted something a little more specific to the situation I normally see with people locally, along with some fixes.
First, some background:
In a stored procedure (and even in ad hoc queries or within dynamic SQL, like in the examples linked above), if you declare a variable within that code block and use it as a predicate later, you will get either a fixed guess for cardinality, or a less-confidence-inspiring estimate than when the histogram is used.
The local variable effect discussed in the rest of this post produces the same behavior as the OPTIMIZE FOR UNKNOWN hint, or executing queries with sp_prepare. I have that emphasized here because I don’t want to keep qualifying it throughout the post.
That estimate will be based on the number of rows in the table, and the “All Density” of the column multiplied together, for single equality predicates. The process for multiple predicates depends on which cardinality estimation model you’re using.
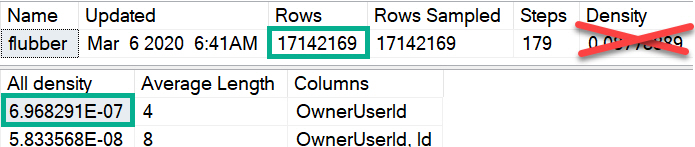
CREATE INDEX flubber
ON dbo.Posts(OwnerUserId);
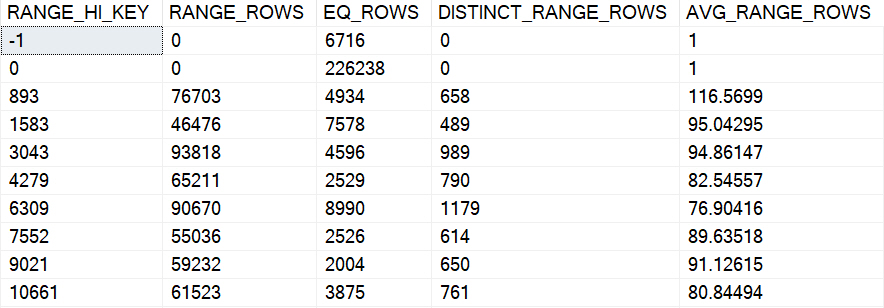
DBCC SHOW_STATISTICS(Posts, flubber);
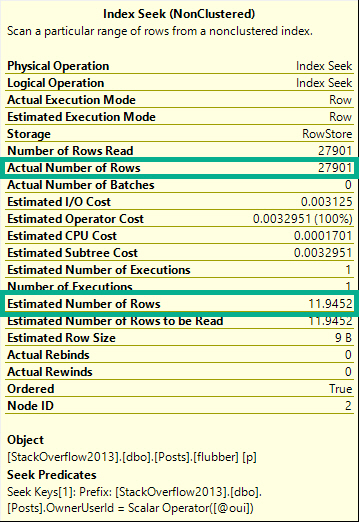
Injury
For example, this query using a single local variable with a single equality:
DECLARE @oui INT = 22656;
SELECT COUNT(*) FROM dbo.Posts AS p WHERE p.OwnerUserId = @oui;
Will get an estimate of 11.9-ish, despite 27,901 rows matching over here in reality.
Poo
Which can be replicated like so, using the numbers from the screenshot up yonder.
SELECT (6.968291E-07 * 17142169) AS [?]
Several Different Levels
You can replicate the “All Density” calculation by doing this:
SELECT (1 /
         CONVERT(FLOAT, COUNT(DISTINCT p.OwnerUserId))
         ) AS [All Density]
FROM Posts AS p
GO
Notice I didn’t call the estimate “bad”. Even though it often is quite bad, there are some columns where the distribution of values will be close enough to this estimate for it not to matter terribly for plan shape, index choice, and overall performance.
Don’t take this as carte blanche to use this technique; quite the opposite. If you’re going to use it, it needs careful testing across a variety of inputs.
Why? Because confidence in estimates decreases as they become based on less precise information.
In these estimates we can see a couple optimizer rules in action:
Inclusion: We assume the value is there — the alternative is ghastly
Uniformity: The data will have an even distribution of unique values
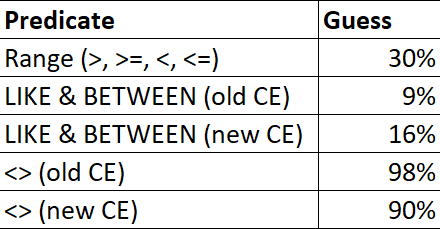
For ranges (>, >=, <, <=), LIKE, BETWEEN, and <>, there are different fixed guesses.
Destined for Lateness
These numbers may change in the future, but up through 2019 this is what my testing resulted in.
Heck, maybe this behavior will be alterable in the future :^)
No Vector, No Estimate
A lot of people (myself included) will freely interchange “estimate” and “guess” when talking about this process. To the optimizer, there’s a big difference.
An estimate represents a process where math formulas with strange fonts that I don’t understand are used to calculate cardinality.
A guess represents a breakdown in that process, where the optimizer gives up, and a fixed number is used.
Say there’s no “density vector” available for the column used in an equality predicate. Maybe you have auto-create stats turned off, or stats created asynchronously is on for the first compilation.
You get a guess, not an estimate.
ALTER DATABASE StackOverflow2013 SET AUTO_CREATE_STATISTICS OFF;
GO

DECLARE @oui INT = 22656;
SELECT COUNT(*) FROM dbo.Posts AS p WHERE p.OwnerUserId = @oui;
SELECT COUNT(*) FROM dbo.Posts AS p WHERE p.OwnerUserId = @oui OPTION(USE HINT('FORCE_LEGACY_CARDINALITY_ESTIMATION'));
GO

ALTER DATABASE StackOverflow2013 SET AUTO_CREATE_STATISTICS ON;
GO
Using the new cardinality estimator (CE), which Microsoft has quite presumptuously started calling the Default CE, I get a guess of 4,140.
Using the legacy CE, which maybe I’ll start referring to as the Best CE, to match the presumptuousness of Microsoft, I get a guess of 266,409.
Though neither one is particularly close to the reality of 27,901 rows, we can’t expect a good guess because we’re effectively poking the optimizer in the eyeball by not allowing it to create statistics, and by using a local variable in our where clause.
These things would be our fault, regardless of the default-ness, or best-ness, of the estimation model.
If you’re keen on calculating these things yourself, you can do the following:
SELECT POWER(CONVERT(FLOAT, 17142169), 0.75) AS BEST_CE;
SELECT SQRT(CONVERT(FLOAT, 17142169)) AS default_ce_blah_whatever;
SELECT COUNT_BIG(*)
FROM dbo.Posts AS p
WHERE p.CreationDate = p.CommunityOwnedDate;

SELECT COUNT_BIG(*)
FROM dbo.Posts AS p
WHERE p.CreationDate = p.CommunityOwnedDate
OPTION(USE HINT('FORCE_LEGACY_CARDINALITY_ESTIMATION'));
The so-called “default” CE thinks 1,714,220 rows will match for a column-equals-column comparison, and the “legacy” CE thinks 6.44248 rows will match, assuming that histograms are available for both of these queries.
How many actually match? 59,216.
I never said this was easy, HOWEVER!
Ahem.
The “legacy” CE estimate comes from advanced maths that only people who vape understand, while the so-called “default” CE just guesses ten percent, in true lazybones fashion. “You treat your stepmother with respect, Pantera!“, as a wise man once said.
Second, what we want to happen:
Code that uses literals, parameters, and other sniff-able forms of predicates use the statistics histogram, which typically has far more valuable information about data distribution for a column. No, they’re not always perfect, and sure, estimates can still be off if we use this, but that’s a chance I’m willing to take.
Even if they’re out of date. Maybe. Maybe not.
Look, just update those statistics.
American Histogram X
Like I mentioned before, these estimates typically have higher confidence levels because they’re often based on more precise details about the data.
If I had to rank them:
Direct histogram step hits for an equality
Intra-step hits for an equality
Direct histogram step hits for a range
Intra-step hits for a range
Inequalities (not equals to)
Joins
1000 other things
All the goofy stuff you people do to make this more difficult, like wrapping columns in functions, mismatching data types, using local variables, etc.
Of course, parameterized code does open us up to parameter sniffing issues, which I’m not addressing in this post. My only goal here is to teach people how to get out of performance jams caused by local variables giving you bad-enough estimates. Ha ha ha.
Plus, there’s a lot of negativity out there already about parameter sniffing. A lot of the time it does pretty well, and we want it to happen.
Over-Under
The main issues with the local variable/density vector estimates is that they most often don’t align well with reality, and they’re almost certainly a knee-jerk reaction to a parameter sniffing problem, or done out of ignorance to the repercussions. It would be tedious to walk through all of the potential plan quality issues that could arise from doing this, though I did record a video about one of them here.
Instead of doing all that stuff, I’d rather walk through what works and what doesn’t when it comes to fixing the problem.
But first, what doesn’t work!
Temporary Objects Don’t Usually Work
If you put the value of the local variable in a #temp table, you can fall victim to statistics caching. If you use a @table variable, you don’t get any column-level statistics on what values go in there (even with a recompile hint or trace flag 2453, you only get table cardinality).
There may be some circumstances where a #temp table can help, or can get you a better plan, but they’re probably not my first stop on the list of fixes.
The #temp table will require a uniqueness constraint to work
This becomes more and more difficult if we have multiple local variables to account for
And if they have different data types, we need multiple #temp tables, or wide tables with a column and constraint per parameter
From there, we end up with difficulties linking those values in our query. Extra joins, subqueries, etc. all have potential consequences.
Inline Table Valued Functions Don’t Work
They’re a little too inline here, and they use the density vector estimate. See this gist for a demo.
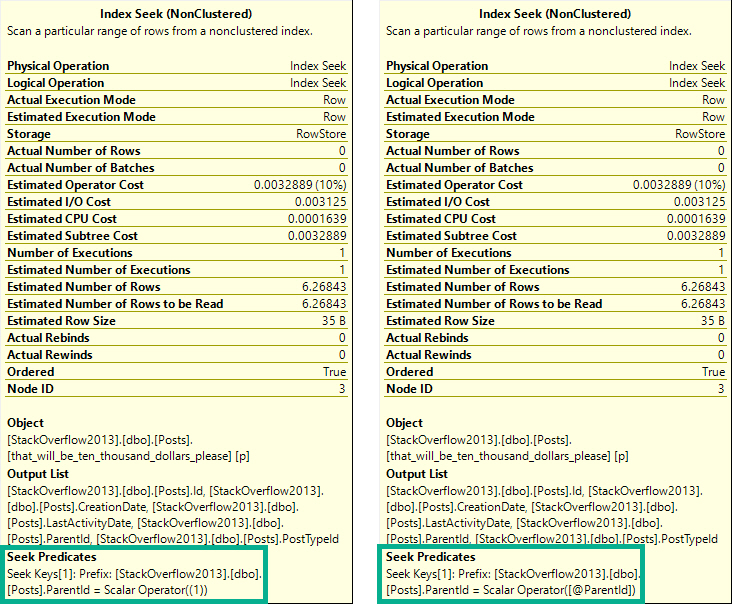
Recompile Can Work, But Only Do It For Problem Statements
It has to be a statement-level recompile, using OPTION(RECOMPILE). Putting recompile as a stored procedure creation option will not allow for parameter embedding optimizations, i.e. WITH RECOMPILE.
One of these things is not like the other.
The tool tip on the left is from a plan with a statement-level recompile. On the right is from a plan with a procedure-level recompile. In the statement-level recompile plan, we can see the scalar operator is a literal value. In the procedure-level recompile, we still see @ParentId passed in.
The difference is subtle, but exists. I prefer statement-level recompiles, because it’s unlikely that every statement in a procedure should or needs to be recompiled, unless it’s a monitoring proc or something else with no value to the plan cache.
Targeting specific statements is smarterer.
Erer.
A more detailed examination of this behavior is at Paul’s post, linked above.
Dynamic SQL Can Work
Depending on complexity, it may be more straight forward to use dynamic SQL as a receptacle for your variables-turned-parameters.
CREATE PROCEDURE dbo.game_time(@id INT)
AS BEGIN
    DECLARE @id_fix INT;
    SET @id_fix = CASE WHEN @id < 0 THEN 1 ELSE @id END;

    DECLARE @sql NVARCHAR(MAX) = N'';
    SET @sql += N'SELECT COUNT(*) FROM dbo.Posts AS p WHERE p.OwnerUserId = @id;';

    EXEC sys.sp_executesql @sql, N'@id INT', @id_fix
END;
Separate Stored Procedures Can Work
If you need to declare variables internally and perform some queries to assign values to them, passing them on to separate stored procedures can avoid the density estimates. The stored procedure occurs in a separate context, so all it sees are the values passed in as parameters, not their origins as variables.
In other words, parameters can be sniffed; variables can’t.
CREATE PROCEDURE dbo.game_time(@id INT)
AS
BEGIN
    DECLARE @id_fix INT;
    SET @id_fix = CASE WHEN @id < 0 THEN 1 ELSE @id END;

    EXEC dbo.some_new_proc @id_fix;
END;
Just pretend the dynamic SQL from above occupies the stored procedure dbo.some_new_proc here.
Optimizing For A Value Can Work
But choosing that value is hard. If one is feeling ambitious, one could take the local parameter value, compare it to the histogram on one’s own, then choose a value on one’s own that, one, on their own, could use to determine if a specific, common, or nearby value would be best to optimize for, using dynamic SQL that one has written on one’s own.
Ahem.
CREATE PROCEDURE dbo.game_time(@id INT)
AS BEGIN
    DECLARE @id_fix INT;
    SET @id_fix = CASE WHEN @id < 0 THEN 1 ELSE @id END;

    DECLARE @a_really_good_choice INT;
    SET @a_really_good_choice = 2147483647; --The result of some v. professional code IRL.

    DECLARE @sql NVARCHAR(MAX) = N'';
    SET @sql += N'SELECT COUNT(*) FROM dbo.Posts AS p WHERE p.OwnerUserId = @id OPTION(OPTIMIZE FOR(@id = [a_really_good_choice]));';
    SET @sql = REPLACE(@sql, N'[a_really_good_choice]', @a_really_good_choice);

    EXEC sys.sp_executesql @sql, N'@id INT', @id_fix;
END;
GO
Wrapping Up
This post aimed to give you some ways to avoid getting bad density vector estimates with local variables. If you’re getting good guesses, well, sorry you had to read all this.
When I see this pattern in client code, it’s often accompanied by comments about fixing parameter sniffing. While technically accurate, it’s more like plugging SQL Server’s nose with cotton balls and Lego heads.
Sometimes there will be several predicate filters that diminish the impact of estimates not using the histogram. Often a fairly selective predicate evaluated first is enough to make this not suck too badly. However, it’s worth learning about, and learning how to fix correctly.
Thanks for reading!
Going Further
If this is the kind of SQL Server stuff you love learning about, you’ll love my training. I’m offering a 75% discount to my blog readers if you click from here. I’m also available for consulting if you just don’t have time for that and need to solve performance problems quickly.
It’s been a while since SQL Server has had a real RECOMPILE problem. And if you put it up against the performance problems that you can hit with parameter sniffing, I’d have a hard time telling someone strapped for time and knowledge that it’s the worst idea for them.
Obviously, you can run into problems if you (“you” includes Entity Framework, AKA the Database Demolisher) author the kind of queries that take a very long time to compile. But as I list them out, I’m kinda shrugging.
Here are some problems you can hit with recompile. Not necessarily caused by recompile, but by not re-using plans.
Long compile times: Admittedly pretty rare, and plan guides or forced plans are likely a better option.
No plan history in the cache (only the most recent plan): Sucks if you’re looking at the plan cache. Sucks less if you have a monitoring tool or Query Store.
CPU spikes for high-frequency execution queries: Maybe time for caching some stuff, or getting away from the kind of code that executes like this (scalar functions, cursors, etc.)
But for everything in the middle: a little RECOMPILE probably won’t hurt that bad.
Thinking of the problems it can solve:
Parameter sniffing
Parameter embedding (lack of)
Local variable estimates
Catch all queries
Those are very real problems that I see on client systems pretty frequently. And yeah, sometimes there’s a good tuning option for these, like changing or adding an index, moving parts of the query around, sticking part of the query in a temp table, etc.
But all that assumes that those options are immediately available. For third party vendors who have somehow developed software that uses SQL Server for decades without running into a single best practice even by accident, it’s often harder to get those changes through.
There’s More Than One Way To Recompile
Sure, you might be able to sneak a recompile hint somewhere in the mix even if it’d make the vendor upset. You can always yoink it out later.
But you have alternatives, too.
DBCC FREEPROCCACHE: No, not the whole cache. You can single out troublesome queries to remove specific plans.
Plan Guides: An often overlooked detail of plan guides is that you can attach hints to them, including recompile.
Using a plan guide doesn’t interfere with that precious vendor IP that makes SQL Server unresponsive every 15 minutes. Or whatever. I’m not mad.
And yeah, there’s advances in SQL Server 2017 and 2019 that start to address some issues here, but they’re still imperfect.
I like’em, but you know. They’re not quite there yet.
Thanks for reading!
Going Further
If this is the kind of SQL Server stuff you love learning about, you’ll love my training. I’m offering a 75% discount to my blog readers if you click from here. I’m also available for consulting if you just don’t have time for that and need to solve performance problems quickly.
Startup Expression Predicates can be helpful. They may also exacerbate parameter sniffing issues in similar ways to IF branches.
Take a simple example:
CREATE INDEX bud_light ON dbo.Posts(OwnerUserId, Score);
CREATE INDEX coors_light ON dbo.Comments(UserId, Score);
GO

CREATE OR ALTER PROCEDURE dbo.sup (@check_posts BIT,  @check_comments BIT, @post_score INT, @comment_score INT)
AS
BEGIN

    SELECT MAX(ISNULL(p.CreationDate, c.CreationDate)) AS max_date,
	       COUNT_BIG(*) AS records
    FROM dbo.Users AS u
    LEFT JOIN dbo.Posts AS p
        ON  @check_posts = 1
        AND p.OwnerUserId = u.Id
    	AND p.Score > @post_score
    LEFT JOIN dbo.Comments AS c
        ON  @check_comments = 1
        AND c.UserId = u.Id
    	AND c.Score > @comment_score;

END
GO
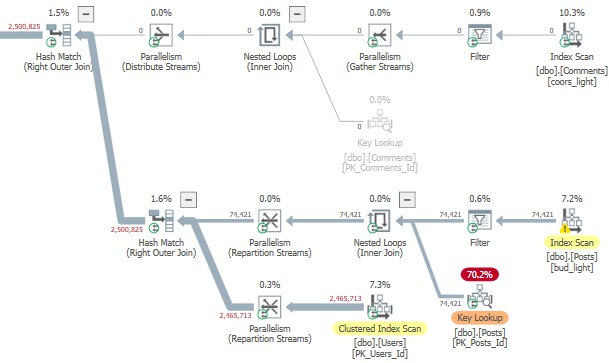
This gives users — and users only — an easy way to get data from certain tables.
This does not give the optimizer a good way of coming up with an execution plan to get or or the other, or both.
The first finishes instantly, the second not so instantly.
The Times
ENHANCE
The problem is a bit easier to visualize in Sentry One Plan Explorer than SSMS, which greys out sections of the query plan that aren’t used.
The cached plan was totally unpreparedIt shows when the second query runs
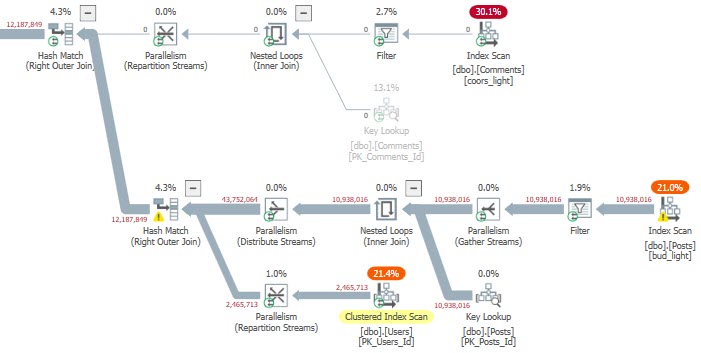
Four million Key Lookups isn’t my idea of a good time.
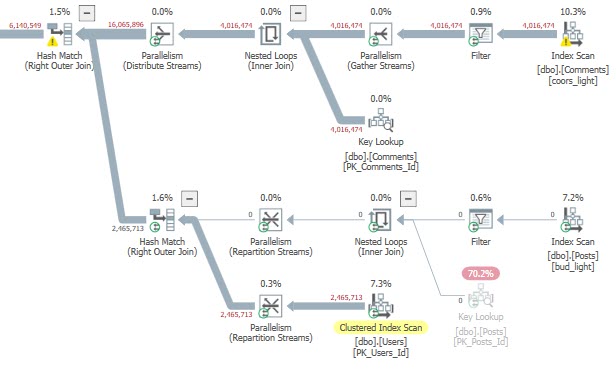
If we switch things up, the results are even worse. The bad plan runs for nearly a full minute.
teeeeeeeeen million
So uh, you know. Be careful out there, when you’re trying to be more cleverer than the optimizerer.
Thanks for reading!
Going Further
If this is the kind of SQL Server stuff you love learning about, you’ll love my training. I’m offering a 75% discount to my blog readers if you click from here. I’m also available for consulting if you just don’t have time for that and need to solve performance problems quickly.