In SQL Server, Blocking Begets Deadlocking

Gateway Drug


Most servers I look at have some level of problems with queries deadlocking with one another. In many cases, they’re read queries deadlocking with write queries, which is easy to resolve using an optimistic isolation level.

My approach to resolving deadlocks is nearly identical to my approach for resolving blocking problems: make the queries go faster to reduce the potential for overlap.

Deadlocks are a result of queries blocking each other, where they’d drag on forever in an unwinnable grudge match. Sometimes this happens just because of bad timing, weird locking hints, using implicit transactions, or application bugs that leave sessions in a sleeping state while holding locks. The fastest queries in the world generally can’t fix those kinds of problems, because they’re going out of their way to do bad things.

But it still comes back to locks being taken and held. Not all blocking leads to deadlocks of course, but the longer you leave locks out there, the higher your chances of running into deadlocks is.

A lot of the time, just figuring out what deadlocks is only half the battle. You’ll also need to diagnose what’s blocking to fully resolve things.

How do you do that?

Blocked Process Report


Turning on the blocked process report is a good starting place. You can do that like so.

EXEC sys.sp_configure
    N'show advanced options',
    1;
RECONFIGURE;
GO
EXEC sys.sp_configure
    N'blocked process threshold',
    5; --Seconds
RECONFIGURE;
GO

The only real downside of the blocked process report is that you can’t go below five seconds for the block duration that you have to hit before things are logged.

We’ll talk about other options next, but first! How do you log to the blocked process report now that it’s enabled?

Extended events, my dear friends.

CREATE EVENT SESSION 
    blocked_process_report
ON SERVER
    ADD EVENT 
        sqlserver.blocked_process_report
    ADD TARGET 
        package0.event_file
    (
        SET filename = N'bpr'
    )
WITH
(
    MAX_MEMORY = 4096KB,
    EVENT_RETENTION_MODE = ALLOW_SINGLE_EVENT_LOSS,
    MAX_DISPATCH_LATENCY = 5 SECONDS,
    MAX_EVENT_SIZE = 0KB,
    MEMORY_PARTITION_MODE = NONE,
    TRACK_CAUSALITY = OFF,
    STARTUP_STATE = ON
);

ALTER EVENT SESSION
    blocked_process_report
ON SERVER 
    STATE = START;
GO

To read data from it, you can use my stored procedure sp_HumanEventsBlockViewer.

EXEC dbo.sp_HumanEventsBlockViewer
    @session_name = N'blocked_process_report';

That should get you most of the way to figuring out where your blocking problems are.

Logging sp_WhoIsActive


If you want try to catch blocking problems shorter than 5 seconds, one popular way to do that is to log sp_WhoIsActive to a table.

I have a whole set of code to help you do that, too. In that repo, you’ll find:

It works pretty well for most use cases, but feel free to tweak it to meet your needs.

Getting To The Deadlocks


The best way known to god, dog, and man to look at deadlocks is to use sp_BlitzLock.

I put a lot of work into a big rewrite of it recently to speed things up and fix a lot of bugs that I noticed over the years.

You can use it to look at the system health extended event session, or to look at a custom extended event session.

CREATE EVENT SESSION 
    deadlock
ON SERVER
    ADD EVENT 
        sqlserver.xml_deadlock_report
    ADD TARGET 
        package0.event_file
    (
        SET filename = N'deadlock'
    )
WITH
(
    MAX_MEMORY = 4096KB,
    EVENT_RETENTION_MODE = ALLOW_SINGLE_EVENT_LOSS,
    MAX_DISPATCH_LATENCY = 5 SECONDS,
    MAX_EVENT_SIZE = 0KB,
    MEMORY_PARTITION_MODE = NONE,
    TRACK_CAUSALITY = OFF,
    STARTUP_STATE = ON
);
GO

ALTER EVENT SESSION
    deadlock
ON SERVER 
    STATE = START;
GO

And then to analyze it:

EXEC dbo.sp_BlitzLock
    @EventSessionName = N'deadlock';

Problem Solving


Once you have queries that are blocking and deadlocking, you get to choose your own adventure when it comes to resolving things.

If you need help with that, click the link below to set up a sales call with me. If you’re gonna go it on your own, here are some basic things to check:

  • Isolation levels: are you using repeatable read or serializable without knowing it?
  • Do you have the right indexes for your queries to find data quickly?
  • Are your queries written in a way to take full advantage of your indexes?
  • Do you have any foreign keys or indexed views that are slowing modifications down?
  • Are you starting transactions and doing a lot of work before committing them?

Thanks for reading!

Going Further


If this is the kind of SQL Server stuff you love learning about, you’ll love my training. I’m offering a 75% discount to my blog readers if you click from here. I’m also available for consulting if you just don’t have time for that, and need to solve database performance problems quickly. You can also get a quick, low cost health check with no phone time required.

Decoding Client Options In SQL Server Deadlocks

Has Been


Recently while working with a client to fix some deadlock issues, they asked about the client options stored in the XML.

I could remember looking at them at one point to see if there was a decoder ring for them, but never found anything definitive.

There’s a similar type of bittish thing in dm_exec_plan_attributes. It gets decoded in sp_BlitzCache like so:

SetOptions = SUBSTRING(
             CASE WHEN (CAST(pa.value AS INT) & 1 = 1) THEN ', ANSI_PADDING' ELSE '' END +
             CASE WHEN (CAST(pa.value AS INT) & 8 = 8) THEN ', CONCAT_NULL_YIELDS_NULL' ELSE '' END +
             CASE WHEN (CAST(pa.value AS INT) & 16 = 16) THEN ', ANSI_WARNINGS' ELSE '' END +
             CASE WHEN (CAST(pa.value AS INT) & 32 = 32) THEN ', ANSI_NULLS' ELSE '' END +
             CASE WHEN (CAST(pa.value AS INT) & 64 = 64) THEN ', QUOTED_IDENTIFIER' ELSE '' END +
             CASE WHEN (CAST(pa.value AS INT) & 4096 = 4096) THEN ', ARITH_ABORT' ELSE '' END +
             CASE WHEN (CAST(pa.value AS INT) & 8192 = 8191) THEN ', NUMERIC_ROUNDABORT' ELSE '' END 
             , 2, 200000)

Based on that, I was hopeful that I could use a combination of SSMS and session settings to figure out where bits flip in client options.

I don’t think I got all of them, but this simple demo shows off the ones that were accessible. Some caveats here:

  • No one at Microsoft has validated these
  • They might change in the future
  • There are probably ones I missed

Ring Toss


Here’s what I came up with, using my own experimenting, and also some test data from deadlock XML files I had sitting around.

CREATE TABLE 
    #temptable 
( 
    clientoption1 bigint, 
    clientoption2 bigint 
);

INSERT INTO 
    #temptable 
(
    clientoption1, 
    clientoption2
)
VALUES
(536870944, 128056), 
(671088672, 128056), 
(671088672, 128058), 
(673185824, 128056), 
(673316896, 128056);


SELECT
    q.clientoption1,
    q.clientoption2,
    clientoption1 = 
        SUBSTRING
        (    
            CASE WHEN q.clientoption1 & 0x20 = 0x20 THEN ', QUOTED IDENTIFIER ON' ELSE '' END +
            CASE WHEN q.clientoption1 & 0x40 = 0x40 THEN ', ARITHABORT' ELSE '' END +
            CASE WHEN q.clientoption1 & 0x800 = 0x800 THEN ', USER SET ARITHABORT' ELSE '' END +
            CASE WHEN q.clientoption1 & 0x8000 = 0x8000 THEN ', NUMERIC ROUNDABORT ON' ELSE '' END +
            CASE WHEN q.clientoption1 & 0x10000 = 0x10000 THEN ', USER SET NUMERIC ROUNDABORT ON' ELSE '' END +
            CASE WHEN q.clientoption1 & 0x20000 = 0x20000 THEN ', SET XACT ABORT ON' ELSE '' END +
            CASE WHEN q.clientoption1 & 0x80000 = 0x80000 THEN ', NOCOUNT OFF' ELSE '' END +
            CASE WHEN q.clientoption1 & 0x200000 = 0x200000 THEN ', NOCOUNT ON' ELSE '' END +
            CASE WHEN q.clientoption1 & 0x8000000 = 8000000 THEN ', USER SET QUOTED IDENTIFIER' ELSE '' END +
            CASE WHEN q.clientoption1 & 0x20000000 = 0x20000000 THEN ', ANSI NULL DEFAULT ON' ELSE '' END +
            CASE WHEN q.clientoption1 & 0x40000000 = 0x40000000 THEN ', ANSI NULL DEFAULT OFF' ELSE '' END,
            3,
            8000
        ),
    clientoption2 = 
        SUBSTRING
        (
            CASE WHEN q.clientoption2 & 2 = 2 THEN ', IMPLICIT TRANSACTION' ELSE '' END +
            CASE WHEN q.clientoption2 & 8 = 8 THEN ', ANSI WARNINGS' ELSE '' END +
            CASE WHEN q.clientoption2 & 0x10 = 0x10 THEN ', ANSI PADDING' ELSE '' END +
            CASE WHEN q.clientoption2 & 0x20 = 0x20 THEN ', ANSI NULLS' ELSE '' END +
            CASE WHEN q.clientoption2 & 0x1000 = 0x1000 THEN ', USER CONCAT NULL YIELDS NULL' ELSE '' END +
            CASE WHEN q.clientoption2 & 0x2000 = 0x2000 THEN ', CONCAT NULL YIELDS NULL' ELSE '' END +
            CASE WHEN q.clientoption2 & 0x4000 = 0x4000 THEN ', USER ANSI NULLS' ELSE '' END +
            CASE WHEN q.clientoption2 & 0x8000 = 0x8000 THEN ', USER ANSI WARNINGS' ELSE '' END,
            3,
            8000
        )
FROM #temptable AS q;

I may work on getting these into some deadlock analysis tooling after I have a little more validation that the results are correct.

Thanks for reading!

Going Further


If this is the kind of SQL Server stuff you love learning about, you’ll love my training. I’m offering a 75% discount to my blog readers if you click from here. I’m also available for consulting if you just don’t have time for that, and need to solve database performance problems quickly. You can also get a quick, low cost health check with no phone time required.
Should Query Store Also Capture Blocking And Deadlocks?

Big Ideas


The more I used third party monitoring tools, the more annoyed I get. So much is missing from the details, configurability, and user experience.

I often find myself insisting on also having Query Store enabled. As much as I’d love other improvements, I think it’s also important to have a centralized experience for SQL Server users to track down tricky issues.

There are so many views and metrics out there, it would be nice to have a one stop shop to see important things.

Among those important things are blocking and deadlocks.

Deadlockness


Deadlocks are perhaps the more obvious choice, since they’re already logged to the system health extended event session.

Rather than leave folks with a bazillion scripts and stored procedures to track them down, Query Store should add a view to pull data from there.

If Microsoft is embarrassed by how slow it is to grab all that session data, and they should be, perhaps that’s a reasonable first step to having Query Store live up to its potential.

Most folks out there have no idea where to look for that stuff, and a lot of scripts that purport to get you detail are either wildly outdated, or are a small detail away from turning no results and leaving them frustrated as hell.

I know because I talk to them.

Blockhead


Blocking, by default, is not logged anywhere at all in SQL Server.

If you wanna get that, you have to be ready for it, and turn on the Blocked Process Report:

sp_configure 
    'show advanced options', 
    1;  
GO  
RECONFIGURE;  
GO  
sp_configure 
    'blocked process threshold', 
    10;  
GO  
RECONFIGURE;  
GO

Of course, from there you have to… do more to get the data.

Michael J Swart has a bunch of neat posts on that. For my part, I wrote sp_HumanEvents to help you spin up an Extended Event session to capture that.

Awful lot of prep work to catch blocking in a database with a pessimistic isolation level on by default, eh?

Left Out


If you want to take this to the next level, it could also grab CPU from the ring buffer, file stats, and a whole lot more. Basically everything other than PLE.

Never look at PLE.

Thanks for reading!

Going Further


If this is the kind of SQL Server stuff you love learning about, you’ll love my training. I’m offering a 75% discount to my blog readers if you click from here. I’m also available for consulting if you just don’t have time for that and need to solve performance problems quickly.

Unkillable Sessions and Undetected Deadlocks

I recently experienced a blocking issue in a production environment which had been going on for hours. As a responsible DBA, I tried to kill the head of the blocking chain. Unexpectedly, killing the session seemed to have no effect. The blocking continued and the session seemed to stick around.

How to Create an Unkillable Session

It’s surprisingly easy to create a session that seemingly can’t be killed. Use good judgment in picking an environment to run this code against. First you’ll need to enable the “Ad Hoc Distributed Queries” configuration option if you haven’t done so already:

sp_configure 'Ad Hoc Distributed Queries', 1;
RECONFIGURE;
GO
sp_configure;

You can then run the following code after replacing the SERVER_NAME and INSTANCE_NAME placeholder values with the server name and instance name that you’re running against. In other words, you want the OPENROWSET call to point at the same server that you’re executing the query against:

BEGIN TRANSACTION;

SELECT TOP (1) [name]
FROM master.dbo.spt_values WITH (TABLOCKX);

SELECT TOP (1) d.[name]
FROM OPENROWSET('SQLNCLI', '{{SERVER_NAME}}\{{INSTANCE_NAME}};Trusted_Connection=yes;', master.dbo.spt_values) AS d;

This code seems to run forever. Trying to kill the session is not effective, even though there’s no error message and a line written to the error log claiming that the session was killed. Running kill with the STATUSONLY option gives us the following:

SPID 56: transaction rollback in progress. Estimated rollback completion: 0%. Estimated time remaining: 0 seconds.

Trying to cancel the query using SSMS also seems to have no effect as well.

The Undetected Deadlock

Running sp_whoisactive reveals a pretty alarming state:

Session 56 (the one that I can see in SSMS) is waiting on an OLEDB wait. Based on the documentation, I assume that you’ll get this wait type while waiting for the OPENROWSET call to complete:

Includes all connection information that is required to access remote data from an OLE DB data source. This method is an alternative to accessing tables in a linked server and is a one-time, ad hoc method of connecting and accessing remote data by using OLE DB.

I did get callstacks for the OLEDB wait using the wait_info_external extended event, but there were two problems. The first problem is that wait_info_external fires after the wait is complete and the OLEDB wait won’t finish. The second problem is that the callstacks that I did get weren’t very interesting.

Getting back on topic, I believe that the OLEDB wait for session 56 can only end once session 66 completes its work. Session 66 is the session that was created by the OPENROWSET call. However, session 66 needs an IS lock on the spt_values table. That is not compatible with the exclusive lock held on that object by session 56. So session 56 is waiting on session 66 but session 66 is waiting on session 56. This is an undetected deadlock. The deadlock can be resolved by killing session 66 (the OPENROWSET query).

Note that if you are crazy enough to try this on your own, you may see a MEMORY_ALLOCATION_EXT wait instead of an OLEDB wait. I don’t believe that there’s any meaningful distinction there, but don’t assume that a long running OLEDB wait is required for this problem to occur.

Final Thoughts

This blocking issue was unusual in that killing the blocking session doesn’t resolve the issue. I had to kill the session getting blocked instead. Thanks for reading!

How To Tell You Need An Optimistic Isolation Level In SQL Server

Into The Yonder


When you create a database in SQL Server (everything except Azure SQL DB), you get this garbage isolation level called Read Committed.

That isolation level, along with others like Repeatable Read and Serializable, are considered pessimistic. Though Repeatable Read and Serializable are less garbage, it comes with a strictness of locking that most applications don’t need across the board. They may need it for certain niche activities, but you know…

Then there are isolation levels that are quite useful for most isolation levels, and they’re called optimistic isolation levels. In SQL Server, they’re Snapshot Isolation (SI), and Read Committed Snapshot Isolation (RCSI).

I think they are very much not-garbage, and so do other major database platforms that use specific implementations of MVCC (Multi Version Concurrency Control) by default. There may be some historical reason for SQL Server not doing it by default, which is also garbage.

Differences


There are some differences between the two optimistic isolation levels, which makes them useful in different situations. Most people don’t need both turned on, which is something I see quite a bit, but there just might be someone out there who turns on and actually uses both.

To generalize a little bit:

  • SI is good when you only want certain queries to read versioned data
  • RCSI is good when you want every query to read versioned data

What’s versioned data? You can think of it like the “last known good” version of a row before a modification started.

When an update or a delete starts to change data, SQL Server will send those last known good versions up to tempdb for read queries to grab what they need rather than getting blocked. Inserts are a little different, because they are the only known good version of a row.

There are some other differences, too.

SI:

  • Can be turned on without exclusive access to the database
  • Queries all read data as it looked at the beginning of a transaction

RCSI:

  • Does need exclusive access to the database, but it’s not as bad as it sounds
  • Reads data as it looked when each query in a transaction starts

Getting exclusive access to the database can be done without the single-user/multi-user dance:

ALTER DATABASE YourDatabase
    SET READ_COMMITTED_SNAPSHOT ON
WITH ROLLBACK IMMEDIATE;

If You Know You Know


The reasons why you might want to turn these on are when your application performance suffers because of locking or deadlocking.

If you want some quick and dirty queries to figure out if you’ve got those happening, you can run these queries.

/*Lock waits?*/
SELECT
    dows.wait_type,
    dows.waiting_tasks_count,
    dows.wait_time_ms,
    dows.max_wait_time_ms,
    dows.signal_wait_time_ms
FROM sys.dm_os_wait_stats AS dows
WHERE dows.wait_type LIKE 'LCK%'
AND   dows.waiting_tasks_count > 0
ORDER BY dows.wait_time_ms DESC;

/*Deadlocks?*/
SELECT 
    p.object_name,
    p.counter_name,
    p.cntr_value
FROM sys.dm_os_performance_counters p
WHERE TRIM(p.counter_name) = 'Number of Deadlocks/sec'
AND   TRIM(p.instance_name) = '_Total';

If you need deeper analysis of waits or deadlocks, I’d suggest you use sp_BlitzFirst or sp_BlitzLock.

What you want to look for in general are when readers and writers are interfering with each other. If your blocking or deadlocking problems are between any kind of exclusive locks, optimistic isolation levels won’t help you.

Wait stats from readers will generally have an “S” in them, like LCK_M_S. The same goes for deadlocks, where the lock mode will have an S in either the owner or the waiter.

Reader Writer Fighter


It’s important to keep in mind that it’s not just writers that block readers, or writers that can deadlock.

This is where the “Shared” lock and lock mode stuff comes into play. Again, if all your locks and deadlocks are between modification queries — locks and lock modes with X (exclusive) or U (update) — they’ll still block each other.

There’s a lot more details at the linked posts above, but that’s the general pattern. Another pattern to look for is if your developers keep adding more and more NOLOCK hints to “fix performance issues”.

A lot of times they’re just covering up other issues with indexing or the way queries are written, or they’re totally misunderstood. I’ve said it before, but it doesn’t mean your query doesn’t take any locks, it means that your query doesn’t respect locks taken by other queries.

That often comes as a surprise to people when I tell them, so I say it whenever I write about it. But that’s where the bad reputation comes from — it can read all sorts of in-flight data that may not reflect reality.

Thanks for reading!

Going Further


If this is the kind of SQL Server stuff you love learning about, you’ll love my training. I’m offering a 75% discount to my blog readers if you click from here. I’m also available for consulting if you just don’t have time for that and need to solve performance problems quickly.

Replication Deadlocks In SQL Server, And How To Fix Them

As If


Replication is one of my least favorite things, and I go out of my way not to deal with it. I have had a few clients now that have run into problems with deadlocks arising from it doing Replication-y things.

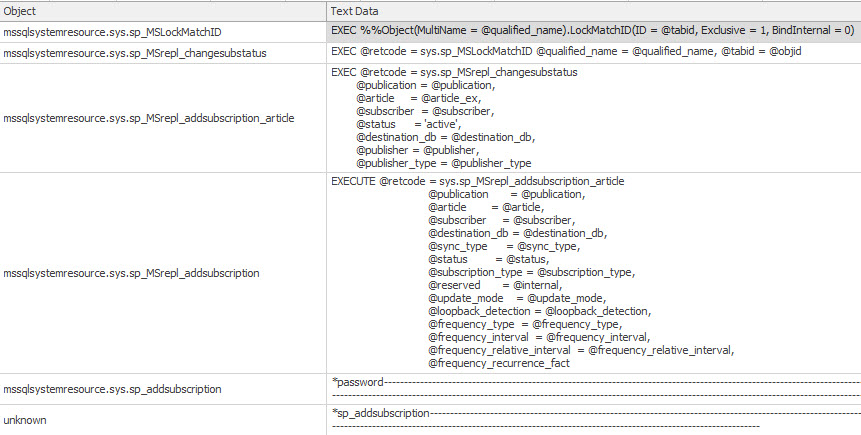
If you use Plan Explorer to look at deadlocks, which you should because SSMS sucks at it, you’ll see stuff that looks like this:

i am deadlock

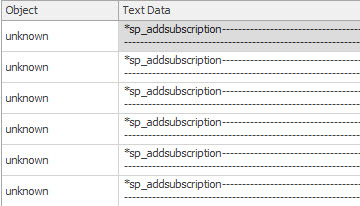
You’ll see deadlocks on things like LockMatchID, sys.sp_MSrepl_changestatus, and sp_MSrepl_addsubscription.

i am deadlock

You may also see weird looking ones like this on sp_addsubscription.

i am also deadlock

If you see deadlocks that involved Database Id 32767, and a negative object ID like -993696157, it’s going to be some weird replication stuff. That’s the Id of the Resource Database, which you can’t really get at without the DAC, or copying and attaching the files for it as a user database.

i too am deadlock

You may also see deadlocks on things like sp_replupdatechema coming from mssqlsystemresource.

Fixing It


The official line from Microsoft Support is that you can usually fix the deadlocks by running these commands:

EXEC sp_changepublication
  @publication = N'yourpublication',
  @property = N'allow_anonymous',
  @value = N'false';
GO

EXEC sp_changepublication
  @publication = N'yourpublication',
  @property = N'immediate_sync',
  @value = N'false';
GO

In practice, the clients I’ve had do this have had their Replication Deadlocks resolved. Hopefully if you’re hitting the same problems, you’ll find them useful.

Thanks for reading!

Going Further


If this is the kind of SQL Server stuff you love learning about, you’ll love my training. I’m offering a 75% discount to my blog readers if you click from here. I’m also available for consulting if you just don’t have time for that and need to solve performance problems quickly.

Locking Hints Make Troubleshooting Blocking And Deadlocks Confusing In SQL Server

King Of The DMV


Many people will go their entire lives without using or seeing a lock hint other than NOLOCK.

Thankfully, NOLOCK only ever leads to weird errors and incorrect results. You’ll probably never have to deal with the stuff I’m about to talk about here.

But that’s okay, you’re probably busy with the weird errors and incorrect results.

Fill The Void


It doesn’t matter who you are, or which Who you use, they all look at the same stuff.

If I run a query with a locking hint to use the serializable isolation level, it won’t be reflected anywhere.

SELECT 
    u.*
FROM dbo.Users AS u WITH(HOLDLOCK)
WHERE u.Reputation = 2;
GO 100

Both WhoIsActive and BlitzWho will show the query as using Read Commited.

EXEC sp_WhoIsActive 
    @get_task_info = 2,
    @get_additional_info = 1;

EXEC sp_BlitzWho 
    @ExpertMode = 1;

This isn’t to say that either of the tools is broken, or wrong necessarily. They just use the information available to them.

sp_WhoIsActive Locks
ah well

Higher Ground


If you set the isolation level at a higher level, they both pick things up correctly.

SET TRANSACTION ISOLATION LEVEL SERIALIZABLE;

SELECT 
    u.*
FROM dbo.Users AS u WITH(HOLDLOCK)
WHERE u.Reputation = 2;
GO 100
sp_WhoIsActive Locks
gratz

Deadlocks, Too


If we set up a deadlock situation — and look, I know, these would deadlock anyway, that’s not the point — we’ll see the same isolation level incorrectness in the deadlock XML.

BEGIN TRAN

UPDATE u
    SET u.Age = 1
FROM dbo.Users AS u WITH(HOLDLOCK)
WHERE u.Reputation = 2;

UPDATE b
    SET b.Name = N'Totally Tot'
FROM dbo.Badges AS b WITH(HOLDLOCK)
WHERE b.Date >= '20140101'

ROLLBACK

Running sp_BlitzLock:

EXEC sp_BlitzLock;
sp_BlitzLock
grousin’


Again, it’s not like the tool is wrong. It’s just parsing out information from the deadlock XML. The deadlock XML isn’t technically wrong either. The isolation level for the transaction is read committed, but the query is asking for more.

The problem is obvious when the query hints are right in front of you, but sometimes people will bury hints down in things like views or functions, and it makes life a little bit more interesting.

Thanks for reading!

Going Further


If this is the kind of SQL Server stuff you love learning about, you’ll love my training. I’m offering a 75% discount to my blog readers if you click from here. I’m also available for consulting if you just don’t have time for that and need to solve performance problems quickly.

Why Read Queries Deadlock With Write Queries In SQL Server

You Come And Go


I go back and forth when it comes to Lookups.

On the one hand, I don’t think the optimizer uses them enough. There are times when hinting a nonclustered index, or re-writing a query to get it to use a nonclustered index can really help performance.

On the other hand, they can really exacerbate parameter sniffing problems, and can even lead to read queries blocking write queries. And quite often, they lead to people creating very wide indexes to make sure particular queries are covered.

It’s quite a tedious dilemma, and in the case of blocking and, as we’ll see, deadlocks, one that can be avoided with an optimistic isolation level Read Committed Snapshot Isolation, or Snapshot Isolation.

Bigger Deal


There are ways to repro this sort of deadlock that rely mostly on luck, but the brute force approach is easiest.

First, create an index that will only partially help out some of our queries:

CREATE INDEX dethklok ON dbo.Votes(VoteTypeId);

Next, get a couple queries that should be able to co-exist ready to run in a loop.

A select:

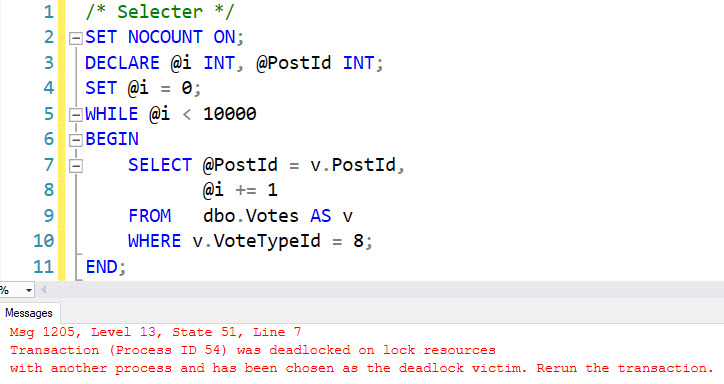
/* Selecter */
SET NOCOUNT ON;
DECLARE @i INT, @PostId INT; 
SET @i = 0;
WHILE @i < 10000
BEGIN
    SELECT 
        @PostId = v.PostId,
        @i += 1
    FROM   dbo.Votes AS v
    WHERE v.VoteTypeId = 8;
END;

An update:

/* Updater */
SET NOCOUNT ON;
DECLARE @i INT = 0;   
WHILE @i < 10000
BEGIN
    UPDATE v
        SET v.VoteTypeId = 8 - v.VoteTypeId,
        @i += 1
    FROM dbo.Votes AS v
    WHERE v.Id = 55537618;
END;

After several seconds, the select query will hit a deadlock.

i see you

But Why?


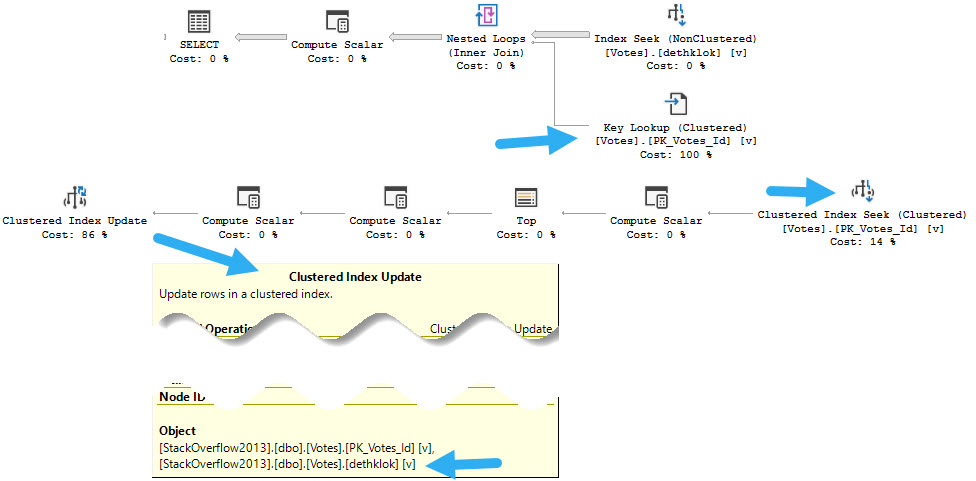
The reason, of course, if that these two queries compete for the same indexes:

SQL Server Query Plan
who’s who

The update query needs to update both indexes on the table, the read query needs to read from both indexes on the table, and they end up blocking each other:

sp_WhoIsActive
kriss kross

We could fix this by expanding the index to also have PostId in it:

CREATE INDEX dethklok ON dbo.Votes(VoteTypeId, PostId);

Using an optimistic isolation level:

ALTER DATABASE StackOverflow2013 
    SET READ_COMMITTED_SNAPSHOT ON WITH ROLLBACK IMMEDIATE;

Or rewriting the select query to use a hash or merge join:

/* Selecter */
SET NOCOUNT ON;
DECLARE @i INT, @PostId INT; 
SET @i = 0;
WHILE @i < 10000
BEGIN

SELECT @PostId = v2.PostId,
       @i += 1
FROM dbo.Votes AS v
INNER /*MERGE OR HASH*/ JOIN dbo.Votes AS v2
    ON v.Id = v2.Id
WHERE v.VoteTypeId = 8

END;

Thanks for reading!

Going Further


If this is the kind of SQL Server stuff you love learning about, you’ll love my training. I’m offering a 75% discount to my blog readers if you click from here. I’m also available for consulting if you just don’t have time for that and need to solve performance problems quickly.

Which Parallel Deadlocks Produce Deadlock Graphs In SQL Server?

Sadness


There are two types of parallel deadlocks. The kind that end in an error message, and the kind that are resolved by exchanges spilling buffers.

It used to be that both kinds would produce deadlock graphs. Microsoft even added some additional troubleshooting information specifically for them.

But apparently that had some overhead, and parallel deadlocks for exchange spills got pulled from the equation.

I checked back to SQL Server 2012 and 2014 on their respective latest service packs, and they both still capture deadlock graphs for exchange spills.

There have been some CUs since Sp3 for SQL Server 2014, but they don’t mention anything about this being backported in them.

Why Is This A Big Deal?


If you were digging into query performance issues, or if you were capturing deadlocks somehow, you used to be able to find queries with these problems pretty easily.

In the article that describes a fix for many deadlock reports, Microsoft offers up an alternative Extended Event session to capture queries that produce error 1205 (a deadlock), but I wasn’t able to get that to capture deadlocks that were resolved by exchange spills.

I don’t think they actually produce that error, which is also why they don’t produce a deadlock graph.

Why they did that when there is, quite not-figuratively, an event dedicated to capturing exchange spills, is beyond me.

i mean really

For me personally, it was a bit of a curveball for sp_BlitzLock. The XML that got produced for exchange spill deadlocks has different characteristics from the ones that produce errors.

There’s a lot of stuff that isn’t documented, too.

Change It Back?


I’m assuming there was some technical challenge to producing a single deadlock graph for exchange spills, which is why it got pulled instead of fixed.

Normally I’d think about opening a UserVoice item, but it doesn’t seem like it’d go anywhere.

There’s enough good ideas on there now that haven’t seen any traction or attention.

Anyway, if you’re on a newer version of SQL Server, take note of the change if you’re troubleshooting this sort of thing.

Thanks for reading!

Going Further


If this is the kind of SQL Server stuff you love learning about, you’ll love my training. I’m offering a 75% discount to my blog readers if you click from here. I’m also available for consulting if you just don’t have time for that and need to solve performance problems quickly.

Options For Fixing Parallel Query Deadlocks In SQL Server

Recreating


If you have a copy of the StackOverflow2013 database, this query should produce a parallel deadlock.

SELECT c.Id, c.UserId, c.CreationDate, c.PostId, c.Score 
INTO #ohno 
FROM dbo.Comments AS c WITH (TABLOCKX);

If you want an easy way to track down deadlocks, I can’t recommend sp_BlitzLock enough.

It doesn’t render the deadlock graph for you, but it does get you the deadlock XML, which you can save as an XDL file.

For viewing them, Sentry One’s Plan Explorer tool is way better than SSMS. It doesn’t just explore plans — it also explores deadlocks.

Graphed Out


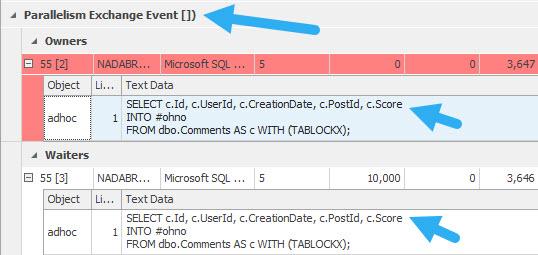
The way it’ll look is something like this:

SQL Server Deadlock
ow my face

You’ll see the exchange event, and you’ll also see the same query deadlocking itself.

This is an admittedly odd situation, but one I’ve had to troubleshoot a bunch of times.

You might see query error messages something like this:

Msg 1205, Level 13, State 18, Line 3
Transaction (Process ID 55) was deadlocked on lock | communication buffer resources with another process and has been chosen as the deadlock victim. Rerun the transaction.

Options For Fixing It


If you start running into these, it can be for a number of reasons, but the root cause is a parallel query. That doesn’t mean you should change MAXDOP to 1, though you should check your parallelism settings to make sure they’re not at the defaults.

You may want to try setting the query you’re having a problem with to DOP 1. Sure, performance might suffer, but at least it won’t error out.

If that’s not possible, you might need to look at other things in the query. For example, you might be missing a helpful index that would make the query fast without needing to go parallel.

Another issue you might spot in query plans is around order preserving operators. I wrote a whole bunch about that with an example here. You might see it around operators like Sorts, Merges, and Stream Aggregates when they’re surrounding parallel exchange operators. In those cases, you might need to hint HASH joins or aggregations.

Thanks for reading!

Going Further


If this is the kind of SQL Server stuff you love learning about, you’ll love my training. I’m offering a 75% discount to my blog readers if you click from here. I’m also available for consulting if you just don’t have time for that and need to solve performance problems quickly.