In the last post, I showed you a query where a bad plan was chosen because of bad guesses.
In this post, I’m going to see if Batch Mode will help anything.
To do that, we’re going to use an empty temp table with a clustered columnstore index on it.
    CREATE TABLE #t (id INT NOT NULL,
	                 INDEX c CLUSTERED COLUMNSTORE);
First Up, No Hints
    SELECT   p.*
    FROM     dbo.Posts AS p
    JOIN     dbo.Votes AS v
        ON p.Id = v.PostId
	LEFT JOIN #t ON 1 = 0
    WHERE    p.PostTypeId = 2
    AND      p.CreationDate >= '20131225'
    ORDER BY p.Id;
Deeply Unsatisfying
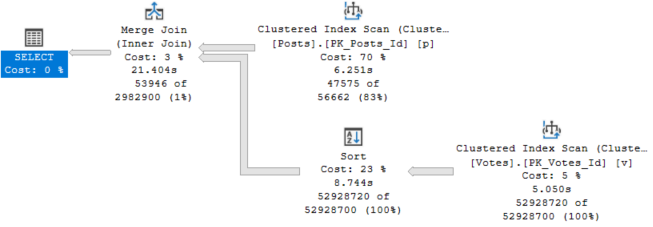
Though this plan is ~6 seconds faster than the Merge Join equivalent in the last post, that’s not the kind of improvement I’m shooting for.
Remember than the Hash Join plan in Row Mode ran in 2.6 seconds.
The only operator to run in Batch Mode here is the Sort. To be fair, it’s really the only one eligible with the trick we used.
Forcing this plan to run in parallel, we go back to a 27 second runtime with no operators in Batch Mode.
Next Up, Hash Hint
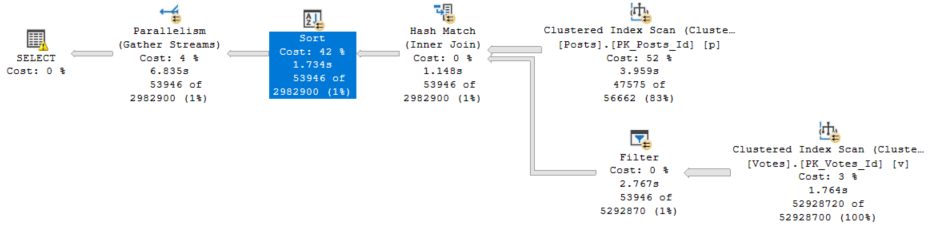
Disappointingly, this gets worse. The Row Mode only plan was 2.6 seconds, and this is 6.8 seconds.
Hush now
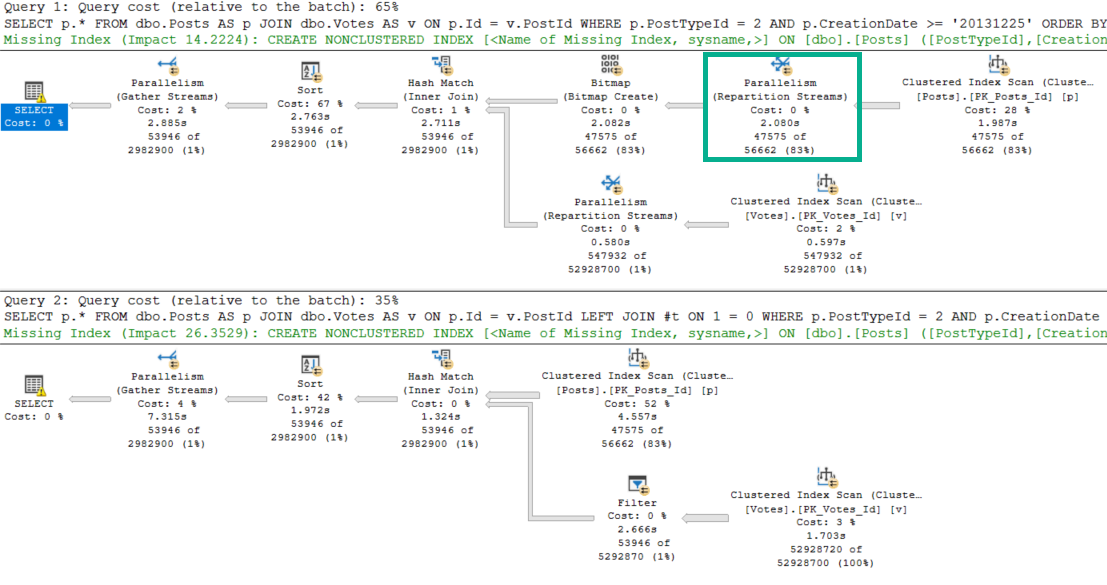
The answer to why the Batch Mode plan is 3x slower lies in our Row Mode plan. Let’s look at them head to head.
Pick me!
See that Repartition Streams operator? It literally saves the entire query.
The Batch Mode plan doesn’t get one. Because of that, Bad Things Happen™
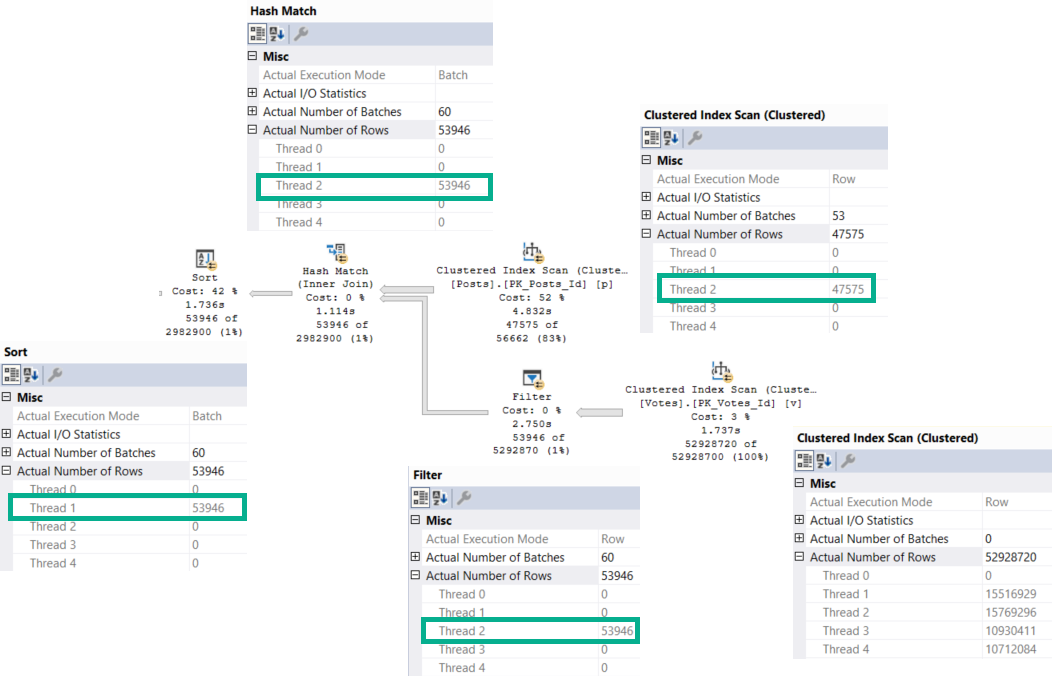
Skew Job
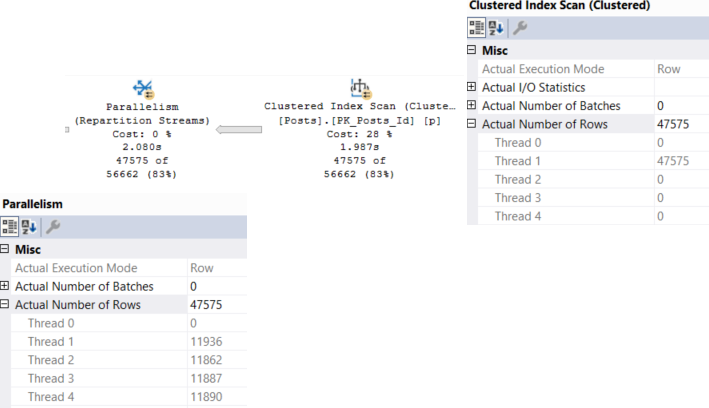
Both plans start out with an unfortunate scan of the Posts table.
Sucktown
But in the Row Mode plan, Repartition Streams does exactly what it sounds like it does, and balances things out. The number of rows on each thread is even because of this. Crazy to think about, but threads dividing work up evenly is, like, a good thing.
In the Batch Mode plan, that… doesn’t happen.
Apology dog
We have the dreaded serial parallel query. Aside from the Scan of the Votes table, only one thread is ever active across the rest of the query.
This isn’t a limitation of Batch Mode generally, though I suspect it has something to do with why we don’t see Repartition Streams show up.
One limitation of Batch Mode is with Sorts — they are single threaded — a point this particular demo obfuscates, unless they’re a child operator of a Window Aggregate.
Well, Darn
I was expecting some fireworks there.
Maybe 2019 will help?
In the next post, we’ll look at that.
Thanks for reading!
Going Further
If this is the kind of SQL Server stuff you love learning about, you’ll love my training. I’m offering a 75% discount to my blog readers if you click from here. I’m also available for consulting if you just don’t have time for that and need to solve performance problems quickly.
This is a short post to “document” something interesting I noticed about… It’s kind of a mouthful.
See, hash joins will bail out when they spill to disk enough. What they bail to is something akin to Nested Loops (the hashing function stops running and partitioning things).
This usually happens when there are lots of duplicates involved in a join that makes continuing to partition values ineffective.
It’s a pretty atypical situation, and I really had to push (read: hint the crap out of) a query in order to get it to happen.
I also had to join on some pretty dumb columns.
Dupe-A-Dupe
Here’s a regular row store query. Bad idea hints and joins galore.
SELECT *
FROM dbo.Posts AS p
LEFT JOIN dbo.Votes AS v
ON  p.PostTypeId = v.VoteTypeId
WHERE ISNULL(v.UserId, v.VoteTypeId) IS NULL
OPTION (
       HASH JOIN, -- If I don't force this, the optimizer chooses Sort Merge. Smart!
       USE HINT('ENABLE_PARALLEL_PLAN_PREFERENCE'),
       MAX_GRANT_PERCENT = 0.0
       );
As it runs, the duplicate-filled columns being forced to hash join with a tiny memory grant cause a bunch of problems.
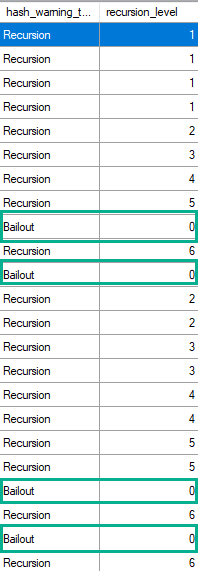
The value is a constant, hard coded in the product, and its value is five (5). This means that before the hash scan operator resorts to a sort based algorithm for any given subpartition that doesn’t fit into the granted memory from the workspace, five previous attempts to subdivide the original partition into smaller partitions must have happened.
At runtime, whenever a hash iterator must recursively subdivide a partition because the original one doesn’t fit into memory the recursion level counter for that partition is incremented by one. If anyone is subscribed to receive the Hash Warning event class, the first partition that has to recursively execute to such level of depth produces a Hash Warning event (with EventSubClass equals 1 = Bailout) indicating in the Integer Data column what is that level that has been reached. But if any other partition later also reaches any level of recursion that has already been reached by other partition, the event is not produced again.
It’s also worth mentioning that given the way the event reporting code is written, when a bail-out occurs, not only the Hash Warning event class with EventSubClass set to 1 (Bailout) is reported but, immediately after that, another Hash Warning event is reported with EventSubClass set to 0 (Recursion) and Integer Data reporting one level deeper (six).
But It’s Different With Batch Mode
If I get batch mode involved, that changes.
CREATE TABLE #hijinks (i INT NOT NULL, INDEX h CLUSTERED COLUMNSTORE);

SELECT *
FROM dbo.Posts AS p
LEFT JOIN dbo.Votes AS v
ON  p.PostTypeId = v.VoteTypeId
LEFT JOIN #hijinks AS h ON 1 = 0
WHERE ISNULL(v.UserId, v.VoteTypeId) IS NULL
OPTION (
       HASH JOIN, -- If I don't force this, the optimizer chooses Sort Merge. Smart!
       USE HINT('ENABLE_PARALLEL_PLAN_PREFERENCE'),
       MAX_GRANT_PERCENT = 0.0
       );
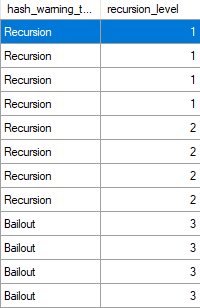
The plan yields several batch mode operations, but now we start bailing out after three recursions.
Creeky
I’m not sure why, and I’ve never seen it mentioned anywhere else.
My only guess is that the threshold is lower because column store and batch mode are a bit more memory hungry than their row store counterparts.
Thanks for reading!
Going Further
If this is the kind of SQL Server stuff you love learning about, you’ll love my training. I’m offering a 75% discount to my blog readers if you click from here. I’m also available for consulting if you just don’t have time for that and need to solve performance problems quickly.
Large servers may experience a scalability bottleneck related to the RESERVED_MEMORY_ALLOCATION_EXT wait event during loading of columnstore tables. This blog post shares a reproduction of the issue and discusses some test results.
The Test Server
Testing was done on a four socket bare metal server with 24 cores per socket. The server had 1 TB of RAM and storage was provided by a SAN. Within SQL Server, we were able to read data at a peak rate of about 5.5 GB/s. Hyperthreading was disabled, but there aren’t any other nonstandard OS configuration settings that I’m aware of.
SQL Server 2016 SP1 CU7 was installed on Windows Server 2016. Most default settings were retained for this testing, including allowing auto soft-NUMA to break up the 96 schedulers into 12 groups of 8, with 3 per memory node. Max server memory was set to around 800000 MB. The user database had 24 data files, indirect checkpoints weren’t used, and the memory model in use was conventional. No interesting trace flags were enabled, except perhaps for TF 4199. I did grow max server memory to close to the maximum before starting any of the tests.
Testing Code and Method
The workload test loaded the same data from a SQL Server table into 576 CCI target tables. For my testing I used a source table of one million rows. Each session grabs a number from a sequence, loads data into the table corresponding to the sequence number, and continues to do that until there are no more tables to process. This may seem like an odd test to run, but think of it as an abstract representation of a columnstore ETL workload which loads data into partitioned CCIs.
The first step is to define the source table. I created a 50 column table that stored only 0s in all of its rows. There’s nothing particularly special about this choice other that it has a very low disk footprint as a CCI because it compresses so well. On a non-busy system it took around 7.3 seconds to insert one million rows into a CCI. Below is the table definition:
Next we need a stored procedure that can save off previous test results (as desired) and reset the server for the next test. If a test name is passed in then results are saved to CCI_TEST_RESULTS and CCI_TEST_WAIT_STATS from the previous run. The procedure always recreates all of the target CCI tables, resets the sequence, clears the buffer pool, and does a few other things.
CREATE OR ALTER PROCEDURE [dbo].[CCI_TEST_RESET] (@PreviousTestName NVARCHAR(100) = NULL, @DebugMe INT = 0)
AS
BEGIN
	DECLARE
	@tablename SYSNAME,
	@table_number INT = 1,
	@SQLToExecute NVARCHAR(4000);

	/*
CREATE TABLE CCI_TEST_WAIT_STATS (
	TEST_NAME NVARCHAR(100),
	WAIT_TYPE NVARCHAR(60),
	WAITING_TASKS_COUNT BIGINT,
	WAIT_TIME_MS BIGINT,
	MAX_WAIT_TIME_MS BIGINT,
	SIGNAL_WAIT_TIME_MS BIGINT
);

CREATE TABLE CCI_TEST_RESULTS (
	TEST_NAME NVARCHAR(100),
	TOTAL_SESSION_COUNT SMALLINT,
	TEST_DURATION INT,
	TOTAL_WORK_TIME INT,
	BEST_TABLE_TIME INT,
	WORST_TABLE_TIME INT,
	TOTAL_TABLES_PROCESSED SMALLINT,
	MIN_TABLES_PROCESSED SMALLINT,
	MAX_TABLES_PROCESSED SMALLINT
);
	*/

	SET NOCOUNT ON;

	IF @DebugMe = 0
	BEGIN
		DROP SEQUENCE IF EXISTS CCI_PARALLEL_TEST_SEQ;
		CREATE SEQUENCE CCI_PARALLEL_TEST_SEQ
			AS SMALLINT
			START WITH 1
			INCREMENT BY 1
			CACHE 600;

		IF @PreviousTestName  N''
		BEGIN
			INSERT INTO CCI_TEST_RESULTS WITH (TABLOCK)
			SELECT @PreviousTestName,
			  COUNT(*) TOTAL_SESSION_COUNT
			, DATEDIFF(MILLISECOND, MIN(MIN_START_TIME), MAX(MAX_END_TIME)) TEST_DURATION
			, SUM(TOTAL_SESSION_TIME) TOTAL_WORK_TIME
			, MIN(MIN_TABLE_TIME) BEST_TABLE_TIME
			, MAX(MAX_TABLE_TABLE) WORST_TABLE_TIME
			, SUM(CNT) TOTAL_TABLES_PROCESSED
			, MIN(CNT) MIN_TABLES_PROCESSED
			, MAX(CNT) MAX_TABLES_PROCESSED
			FROM (
				SELECT
				  SESSION_ID
				, COUNT(*) CNT
				, SUM(DATEDIFF(MILLISECOND, START_TIME, END_TIME)) TOTAL_SESSION_TIME
				, MIN(DATEDIFF(MILLISECOND, START_TIME, END_TIME)) MIN_TABLE_TIME
				, MAX(DATEDIFF(MILLISECOND, START_TIME, END_TIME)) MAX_TABLE_TABLE
				, MIN(START_TIME) MIN_START_TIME
				, MAX(END_TIME) MAX_END_TIME
				FROM CCI_TEST_LOGGING_TABLE
				GROUP BY SESSION_ID
			) t;

			INSERT INTO CCI_TEST_WAIT_STATS WITH (TABLOCK)
			SELECT @PreviousTestName, * FROM sys.dm_os_wait_stats
			WHERE wait_type IN (
				'RESERVED_MEMORY_ALLOCATION_EXT'
				, 'SOS_SCHEDULER_YIELD'
				, 'PAGEIOLATCH_EX'
				, 'MEMORY_ALLOCATION_EXT'
				, 'PAGELATCH_UP'
				, 'PAGEIOLATCH_SH'
				, 'WRITELOG'
				, 'LATCH_EX'
				, 'PAGELATCH_EX'
				, 'PAGELATCH_SH'
				, 'CMEMTHREAD'
				, 'LATCH_SH'
			);

		END;

		DROP TABLE IF EXISTS CCI_TEST_LOGGING_TABLE;
		CREATE TABLE CCI_TEST_LOGGING_TABLE (
			SESSION_ID INT,
			TABLE_NUMBER INT,
			START_TIME DATETIME,
			END_TIME DATETIME
		);

	END;

	WHILE @table_number BETWEEN 0 AND 576
	BEGIN
		SET @tablename = N'CCI_PARALLEL_RPT_TARGET_' + CAST(@table_number AS NVARCHAR(3));
		SET @SQLToExecute= N'DROP TABLE IF EXISTS ' + QUOTENAME(@tablename);
		IF @DebugMe = 1
		BEGIN
			PRINT @SQLToExecute;
		END
		ELSE
		BEGIN
			EXEC (@SQLToExecute);
		END;

		SET @SQLToExecute = N'SELECT * INTO ' + QUOTENAME(@tablename) +
		' FROM CCI_SOURCE WHERE 1 = 0';
		IF @DebugMe = 1
		BEGIN
			PRINT @SQLToExecute;
		END
		ELSE
		BEGIN
			EXEC (@SQLToExecute);
		END;

		SET @SQLToExecute = N'CREATE CLUSTERED COLUMNSTORE INDEX CCI ON ' + QUOTENAME(@tablename);
		IF @DebugMe = 1
		BEGIN
			PRINT @SQLToExecute;
		END
		ELSE
		BEGIN
			EXEC (@SQLToExecute);
		END;

		SET @table_number = @table_number + 1;
	END;

	IF @DebugMe = 0
	BEGIN
		DBCC DROPCLEANBUFFERS WITH NO_INFOMSGS;
		DBCC FREEPROCCACHE WITH NO_INFOMSGS;
		DBCC FREESYSTEMCACHE('ALL');

		SELECT COUNT(*) FROM CCI_SOURCE; -- read into cache

		DBCC SQLPERF ("sys.dm_os_wait_stats", CLEAR) WITH NO_INFOMSGS;
		DBCC SQLPERF ("sys.dm_os_spinlock_stats", CLEAR) WITH NO_INFOMSGS;
	END;
END;
Finally we need a stored procedure that can be called to do as many CCI inserts as it can as quickly as possible. I used the following code:
CREATE OR ALTER PROCEDURE [dbo].[CCI_RUN_INSERTS] (@DebugMe INT = 0)
AS
BEGIN
	DECLARE @table_number INT,
	@tablename SYSNAME,
	@SQLToExecute NVARCHAR(4000),
	@start_loop_time DATETIME;

	SET NOCOUNT ON;

	SELECT @table_number = NEXT VALUE FOR CCI_PARALLEL_TEST_SEQ;

	WHILE @table_number BETWEEN 0 AND 576
	BEGIN
		SET @start_loop_time = GETDATE();

		SET @tablename = N'CCI_PARALLEL_RPT_TARGET_' + CAST(@table_number AS NVARCHAR(3));
		SET @SQLToExecute= N'
		INSERT INTO ' + QUOTENAME(@tablename) + N' WITH (TABLOCK)
		SELECT * FROM CCI_SOURCE WITH (TABLOCK)
		OPTION (MAXDOP 1)';

		IF @DebugMe = 1
		BEGIN
			PRINT @SQLToExecute;
		END
		ELSE
		BEGIN
			EXEC (@SQLToExecute);

			INSERT INTO CCI_TEST_LOGGING_TABLE VALUES (@@SPID, @table_number, @start_loop_time, GETDATE());
		END;

		SELECT @table_number = NEXT VALUE FOR CCI_PARALLEL_TEST_SEQ;
	END;
END;
To vary the number of concurrent queries I used sqlcmd. Each set of 12 sessions had the following format:
My workflow was to perform this test was to add the desired number of calls to the stored procedure in the .bat file, run the test, and to check the results to make sure that the test was a good one. If it was I saved off results using the reset procedure. If not I ran the reset procedure and tried again.
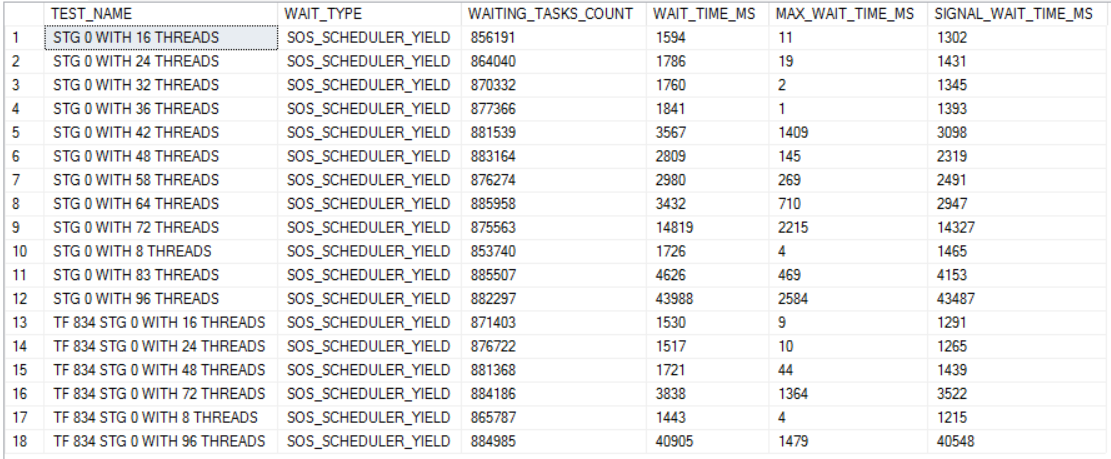
The ping command is there to add a small delay between sets of queries. I found that adding such a delay led to less doubling up on schedulers. I picked 12 because that's the number of soft-NUMA nodes. Sometimes tests would get quite a bit of SOS_SCHEDULER_YIELD waits which would mean that they couldn't be accurately compared to other tests. My fix was to just run the test again. It required a bit of patience but I never had to run a test more than once. SOS waits weren't eliminated but I'd say they fell to acceptable levels:
The right way to avoid SOS waits for testing like this (which might require every user session to go on its own scheduler) would be to set up 96 manual soft-NUMA nodes. But who has time for that?
Test Results
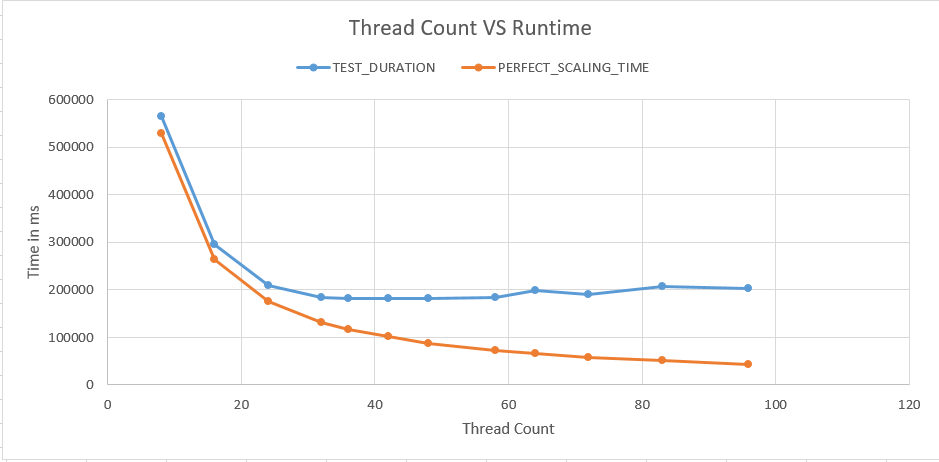
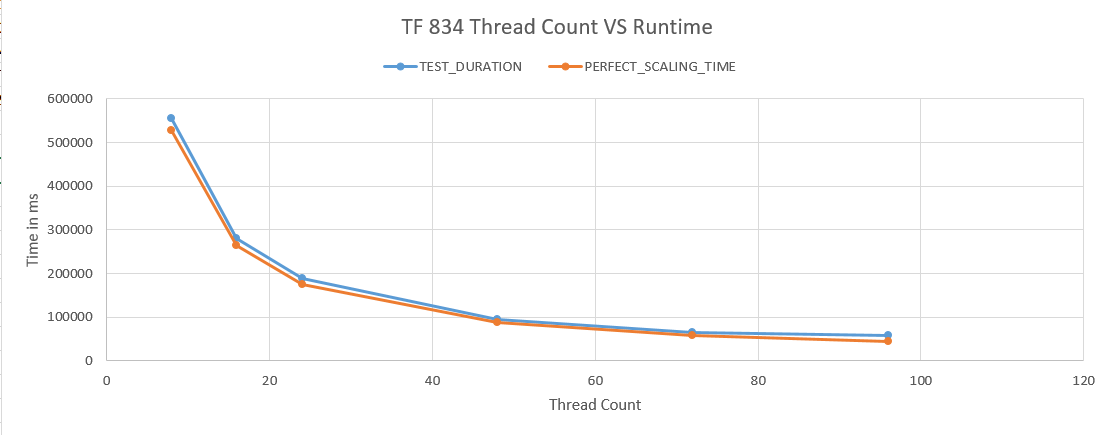
12 tests with different numbers of active queries were run. I picked numbers that somewhat evenly divided into 576 to try to keep work balanced between threads. The blue line in the chart below measures how long each test took from start to finish and the orange line represents how fast the test could have completed if there was no contention on the server whatsoever:
Naturally we can't expect the two lines to match perfectly, but improvements in runtime stop after going past 32 threads. In fact, the workload takes longer with 96 threads compared to 32 threads.
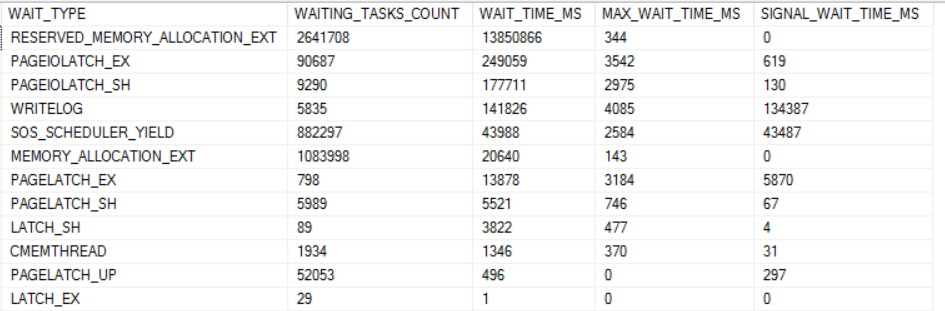
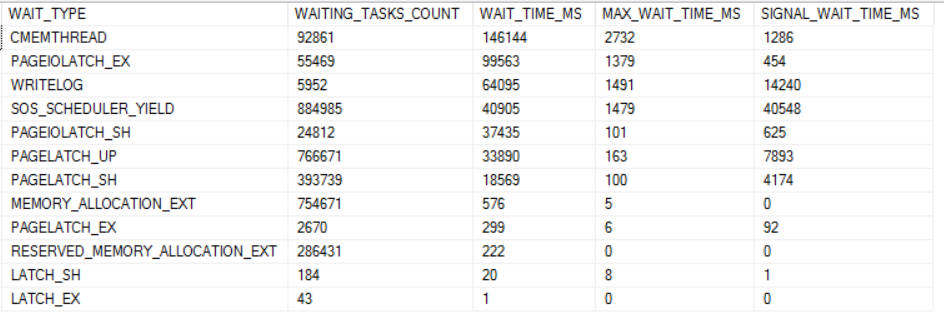
The dominant wait event for the higher thread count runs is RESERVED_MEMORY_ALLOCATION_EXT. Below is a chart of all of the wait events worth mentioning for the 96 thread run:
waiting, waiting
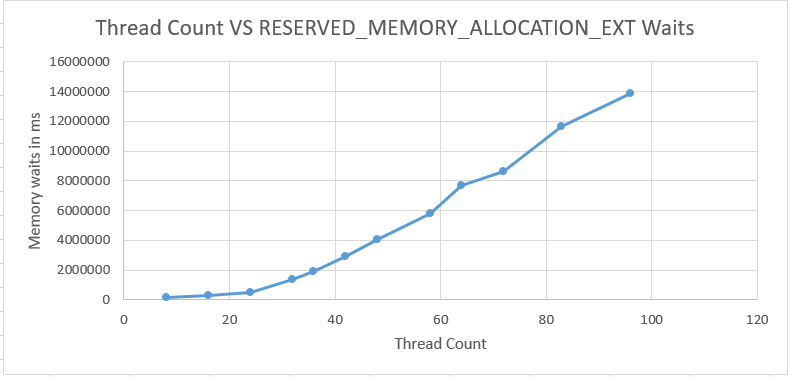
The total number of wait events for RESERVED_MEMORY_ALLOCATION_EXT is very consistent between runs. However, the average wait time significantly increases as the number of concurrent queries increases:
threads going up
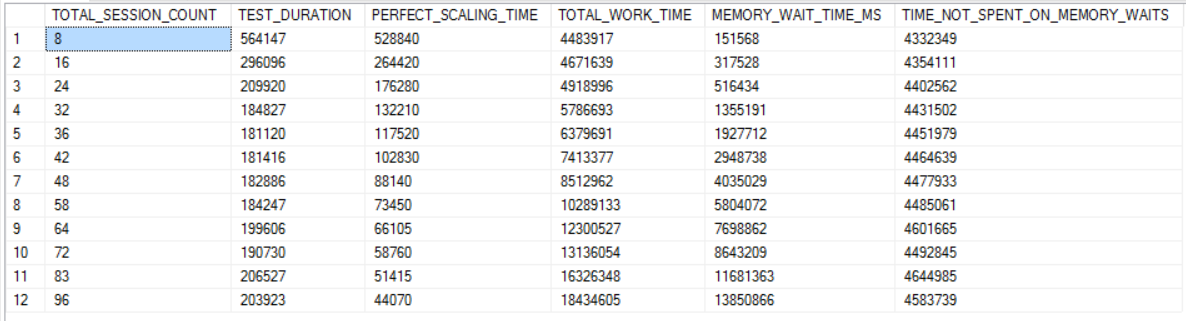
In fact, it could be said that that nearly all worker time past 32 threads is spent waiting on memory. The final column in the chart below is the total time spent in SQL Server minus wait time for RESERVED_MEMORY_ALLOCATION_EXT. The values in that column are remarkably consistent.
running wild
In my experience, when we get into a situation with high memory waits caused by too much concurrent CCI activity all queries on the server that use a memory grant can be affected. For example, I've seen sp_whoisactive run for longer than 90 seconds.
It needs to be stated that not all CCIs will suffer from this scalability problem. I was able to achieve good scalability with some artificial tables, but all of the real target tables that I tested have excessive memory waits at high concurrency. Perhaps tables which require more CPU to compress naturally spread out their memory requests and the underlying OS is better able to keep up.
Test Results With Trace Flag 834
Microsoft strongly recommends against using trace flag 834 with columnstore tables. There's even an article dedicated to that warning. I was desperate so I tried it anyway. The difference was night and day:
trending
Enabling trace flag 834 does at least three things: SQL Server grows to max server memory on startup, AWE memory is used for memory access, and large pages are used for the buffer pool. I didn't see gains when using LPIM (which uses AWE memory) or by growing memory to max before running tests with a conventional memory model, so I suspect that the large pages are making a key difference. Wait time for RESERVED_MEMORY_ALLOCATION_EXT is under a second for all tests.
Scalability is diminished a bit for the 96 thread run. There are some wait events that creep up:
bigwaits4u
All of the wait events can be troubleshooted in conventional ways except possibly for CMEMTHREAD. There's no longer a large amount of time spent outside of SQL Server in the OS.
Other Workarounds
Without trace flag 834 this can be a difficult problem to work around. The two main strategies are to spread out CCI insert activity as much as possible during the ETL and to reduce memory usage of queries which run at the same time as the CCI inserts. For example, consider a query that inserts into a CCI that also performs a large hash join. If that hash join can be moved to somewhere else in the process then you might come out ahead in reducing contention on memory.
Other than that, there's some evidence that virtualized servers are not a good fit for this type of workload. Large virtual guests experience the memory waits at an increased rate, but it isn't yet clear if the problem can be avoided through some change in VM configuration.
Final Thoughts
It's hard not to conclude that TF 834 is necessary to get scalability for columnstore ETLs on very large servers. Hopefully Microsoft will make TF 834 compatible with columnstore one day in the future.
Thanks for reading!
Going Further
If this is the kind of SQL Server stuff you love learning about, you'll love my training. I'm offering a 75% discount to my blog readers if you click from here. I'm also available for consulting if you just don't have time for that and need to solve performance problems quickly.
My least favorite tempdb spills are the ones that happen with a large percentage of the memory grant remaining unused. For example, recently I saw tempdb spills with a memory grant of 35 GB but SQL Server reported that only 10 GB of memory was used. Usually this problem can be traced back to suboptimal memory fractions somewhere in a query plan. I suspect that it can also happen with certain types of queries that load data into columnstore tables but haven’t verified that. In the test environment the issue was caused by memory fractions, but these memory fractions were attached to batch mode operators. The rules for batch mode memory fractions certainly appear to be different than those for rowstore memory fractions. I believe that I was able to work out a few of the details for a few simple cases. In some scenarios, plans with multiple batch mode hash joins can ask for significantly more memory than needed. Reducing the memory grant via Resource Governor or a query hint to something more reasonable can lead to unnecessary (and often frustrating) tempdb spills.
What is a Memory Fraction?
There’s very little information out there about memory fractions. I would define them as information in the query plan that can give you clues about each operator’s share of the total query memory grant. This is naturally more complicated for query plans that insert into tables with columnstore indexes but that won’t be covered here. Most references will tell you not to worry about memory fractions or that they aren’t useful most of the time. Out of thousands of queries that I’ve tuned I can only think of a few for which memory fractions were relevant. Sometimes queries spill to tempdb even though SQL Server reports that a lot of query memory was unused. In these situations I generally hope for a poor cardinality estimate which leads to a memory fraction which is too low for the spilling operator. If fixing the cardinality estimate doesn’t prevent the spill then things can get a lot more complicated, assuming that you don’t just give up.
Types of Query Plans
The demos for this blog post all use tables with identical structures and data. The tables are heaps so the plans will only feature hash joins. The most important plan characteristic is how many of the hash tables need to be kept in memory concurrently while the query processor executes the query. This is where memory fractions come in. The query optimizer tries to reuse parts of memory grants as it can. For example, if the hash build for the first join isn’t needed when the third join executes then it’s possible to use the memory grant from the first hash table for the third hash table. Some of the examples below will make this more clear.
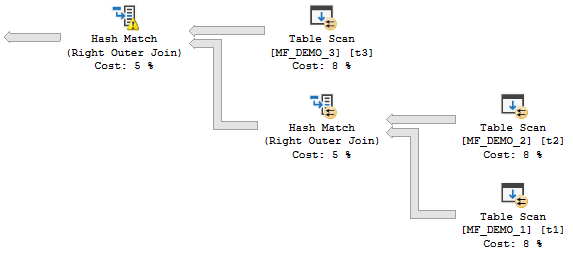
The first type of plan has hash joins which can all run concurrently. Memory for the hash tables cannot be reused between operators.
bushy
For that query, the MF_DEMO_1 table is the probe side for all of the joins. SQL Server builds all of the hash joins and then rows flow from the probe side through the plan (as long as there aren’t tempdb spills). I will refer to this type of plan as a “concurrent join plan” which is a term that I just made up.
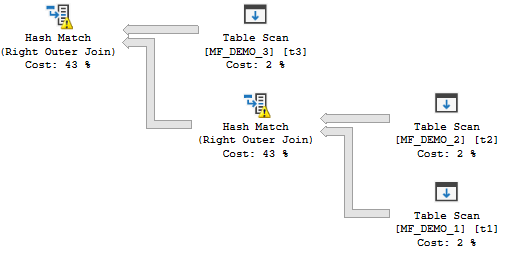
The second type of plan has hash joins which cannot all run concurrently. Pairs of hash tables are active at the same time, but memory grants can be reused between operators.
not bushy
For that query, the MF_DEMO_1 table is the build side for all of the joins. Each hash table blocks the next one from starting. This means that at most two hash tables need to be kept in memory at the same time. Query memory cannot be reused for joins 1 and 2 but join 3 can reuse memory from join 1 and join 4 can reuse memory from join 2. I will refer to this type of plan as a “nonconcurrent join plan” which is another term that I just made up.
If the above wasn’t clear I recommend running through the demos with live query statistics enabled. It can be very useful to understand how rows flow through a plan. As far as I know, all queries of this type can be implemented with the nonconcurrent pattern but not all queries can be implemented with the concurrent pattern .
Create the Tables
The table definitions for our demos are pretty boring. I’m using a VARCHAR(100) as the join column to blow up memory grants and requirements a bit. All of the tables are heaps and have about 6.5 million rows in them. TARGET_TABLE is used as a dumping ground for the inserts and #ADD_BATCH_MODE is used to switch the hash joins to batch mode as desired. All testing was done on SQL Server 2016 SP1 CU7.
DROP TABLE IF EXISTS MF_DEMO_1;
CREATE TABLE MF_DEMO_1 (
       ID VARCHAR(100)
);

INSERT INTO MF_DEMO_1 WITH (TABLOCK)
SELECT 999999999999999 + ROW_NUMBER()
	OVER (ORDER BY (SELECT NULL))
FROM master..spt_values t1
CROSS JOIN master..spt_values t2;

CREATE STATISTICS S1 ON MF_DEMO_1 (ID) WITH FULLSCAN;

DROP TABLE IF EXISTS MF_DEMO_2;
CREATE TABLE MF_DEMO_2 (
       ID VARCHAR(100)
);

INSERT INTO MF_DEMO_2 WITH (TABLOCK)
SELECT 999999999999999 + ROW_NUMBER()
	OVER (ORDER BY (SELECT NULL))
FROM master..spt_values t1
CROSS JOIN master..spt_values t2;

CREATE STATISTICS S2 ON MF_DEMO_2 (ID) WITH FULLSCAN;

DROP TABLE IF EXISTS MF_DEMO_3;
CREATE TABLE MF_DEMO_3 (
       ID VARCHAR(100)
);

INSERT INTO MF_DEMO_3 WITH (TABLOCK)
SELECT 999999999999999 + ROW_NUMBER()
	OVER (ORDER BY (SELECT NULL))
FROM master..spt_values t1
CROSS JOIN master..spt_values t2;

CREATE STATISTICS S3 ON MF_DEMO_3 (ID) WITH FULLSCAN;

DROP TABLE IF EXISTS MF_DEMO_4;
CREATE TABLE MF_DEMO_4 (
       ID VARCHAR(100)
);

INSERT INTO MF_DEMO_4 WITH (TABLOCK)
SELECT 999999999999999 + ROW_NUMBER()
	OVER (ORDER BY (SELECT NULL))
FROM master..spt_values t1
CROSS JOIN master..spt_values t2;

CREATE STATISTICS S4 ON MF_DEMO_4 (ID) WITH FULLSCAN;

DROP TABLE IF EXISTS MF_DEMO_5;
CREATE TABLE MF_DEMO_5 (
	ID VARCHAR(100)
);

INSERT INTO MF_DEMO_5 WITH (TABLOCK)
SELECT 999999999999999 + ROW_NUMBER()
	OVER (ORDER BY (SELECT NULL))
FROM master..spt_values t1
CROSS JOIN master..spt_values t2;

CREATE STATISTICS S5 ON MF_DEMO_5 (ID) WITH FULLSCAN;

CREATE TABLE #ADD_BATCH_MODE (I INT, INDEX CCI CLUSTERED COLUMNSTORE);

DROP TABLE IF EXISTS TARGET_TABLE;

CREATE TABLE TARGET_TABLE (ID VARCHAR(100));
Row Mode Memory Fractions For Concurrent Join Plans
The following query results in a concurrent join plan with row mode hash joins:
INSERT INTO TARGET_TABLE WITH (TABLOCK)
SELECT t1.ID
FROM MF_DEMO_3 t3
RIGHT OUTER JOIN MF_DEMO_2 t2
RIGHT OUTER JOIN MF_DEMO_1 t1
ON t1.ID = t2.ID
ON t1.ID = t3.ID
OPTION (FORCE ORDER, MAXDOP 1);
The desired memory grant is 2860640 KB. The memory fractions for both join operators have an input of 0.5 and an output of 0.5. This is exactly as expected. The hash tables can both start at the same time and cannot reuse memory, so each operator gets 50% of the query memory grant for the plan. Adding a third join to the plan increases the query memory grant to 4290960 KB.
INSERT INTO TARGET_TABLE WITH (TABLOCK)
SELECT t1.ID
FROM MF_DEMO_4 t4
RIGHT OUTER JOIN MF_DEMO_3 t3
RIGHT OUTER JOIN MF_DEMO_2 t2
RIGHT OUTER JOIN MF_DEMO_1 t1
ON t1.ID = t2.ID
ON t1.ID = t3.ID
ON t1.ID = t4.ID
OPTION (FORCE ORDER, MAXDOP 1);
Again, this seems very reasonable. SQL Server now tries to builds three hash tables in memory at the same time. The memory fractions for each operator have fallen to 0.3333333. Each operator gets a third of the query memory grant.
Row Mode Memory Fractions For Nonconcurrent Join Plans
The following query results in a nonconcurrent join plan with row mode hash joins:
INSERT INTO TARGET_TABLE WITH (TABLOCK)
SELECT t1.ID
FROM MF_DEMO_1 t1
INNER JOIN MF_DEMO_2 t2 ON t1.ID = t2.ID
INNER JOIN MF_DEMO_3 t3 ON t2.ID = t3.ID
INNER JOIN MF_DEMO_4 t4 ON t3.ID = t4.ID
OPTION (MAXDOP 1, FORCE ORDER);
The query plan was uploaded here. I recommend downloading the all of the plans referenced in this blost post if you’re interested in them so you can see all of the details.
Here are the memory fractions for the rightmost join (node 3):
What do all of those numbers mean? The rightmost join builds its hash table first and starts with all query memory available to it. However, the output fraction is 0.476174. That means that the hash table can only use up to 47.6% of the query memory granted to the plan. The middle join is able to use up to 50% (the minimum of the input and output fractions for the node) of the memory granted to the plan. Note that 0.476174 + 0.523826 = 1.0. The last join to start executing is also able to use up to 50% of the granted memory. That join is the last operator that uses memory in the plan so the output fraction is 1.0. Memory grant reuse allows the plan to use up to 147.6% of the memory grant over the lifetime of the query execution. Without memory grant reuse each operator wouldn’t be able to use as much memory.
Removing one of the joins results in the desired query memory grant dropping from 3146704 KB to 3003672 KB. This is a significantly less drop than the other query. The smaller decrease is expected because the third join that we added can reuse the memory grant from the first. As more joins are added to a nonconcurrent plan the desired memory grant grows at a much slower rate than the memory grant for the concurrent join plan.
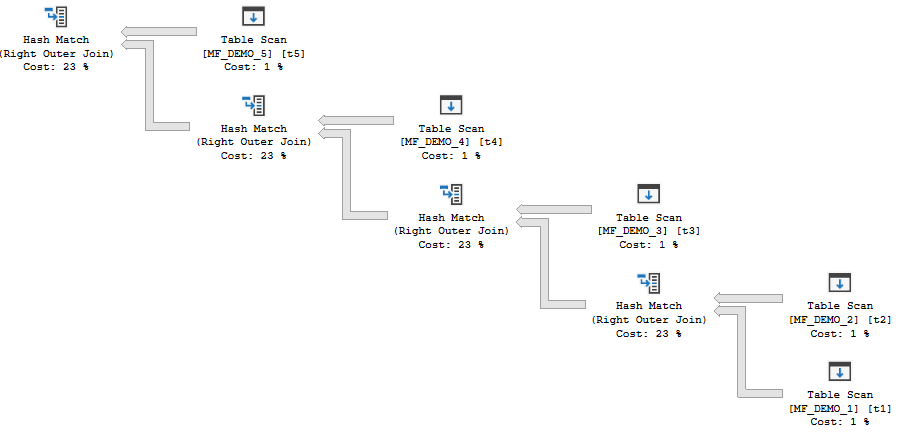
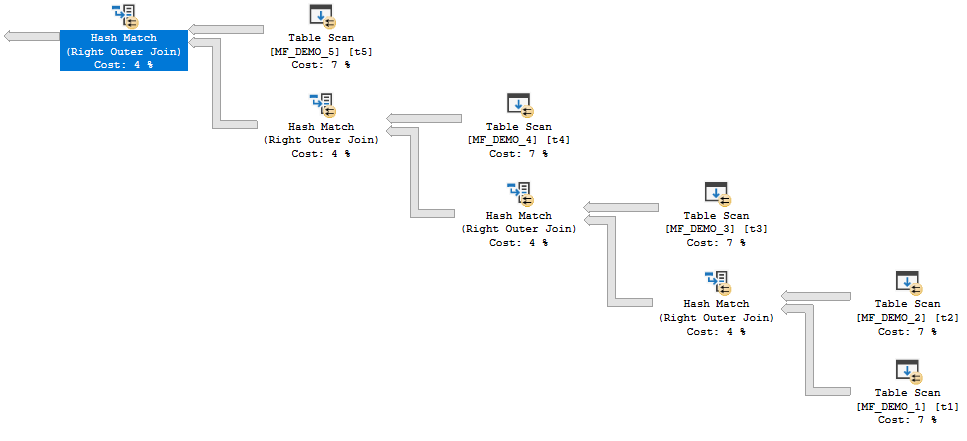
Batch Mode Memory Fractions For Concurrent Join Plans
The query plan for the next query is somewhat dependent on hardware. On my machine I had to let it run in parallel to get batch mode hash joins:
INSERT INTO TARGET_TABLE WITH (TABLOCK)
SELECT t1.ID
FROM MF_DEMO_5 t5
RIGHT OUTER JOIN MF_DEMO_4 t4
RIGHT OUTER JOIN MF_DEMO_3 t3
RIGHT OUTER JOIN MF_DEMO_2 t2
RIGHT OUTER JOIN MF_DEMO_1 t1
LEFT OUTER JOIN #ADD_BATCH_MODE ON 1 = 0
ON t1.ID = t2.ID
ON t1.ID = t3.ID
ON t1.ID = t4.ID
ON t1.ID = t5.ID
OPTION (FORCE ORDER, MAXDOP 4);
The estimated plan is here. It’s easy to tell if the query is using batch mode joins because the joins are run in parallel but there are no repartition stream operators.
parallel and bushy
SQL Server is not able to reuse memory grants for this query. SQL Server tries to build all of the hash tables in memory before probe side is processed. However, the memory fractions are different from before: 0.25, 0.5, 0.75, and 1.0. These memory fractions do not make sense if interpreted in the same way as before. How can the final hash join in the plan have an input memory fraction of 1.0?
It’s unclear what the memory fractions are supposed to mean here, but there is one observable difference compared to the row mode plan. In the row mode equivalent plan SQL Server divides the memory evenly between operators. For our very simple test plan this means that all of the hash joins will spill to tempdb or none of them will spill. Reducing a MAX_GRANT_PERCENT hint from the right value by 1% results in two spills:
spilly
Both operators spilled because memory was divided evenly and there wasn’t enough memory to hold both hash tables in memory. However, with batch mode hash joins we can get plans like the following:
spilly
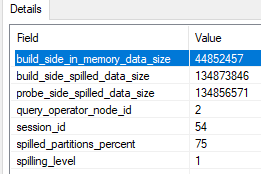
How is it possible that one join spills but the other doesn’t? It is only possible if memory isn’t divided evenly. It appears that memory is used as needed in some situations. Unfortunately, the actual plan for batch mode operators doesn’t give us a lot of spill information like it does for row mode. There’s a debug channel extended event query_execution_batch_hash_join_spilled that can give us some clues. 657920 KB of memory was granted for a two batch mode hash join query. For the operator that spilled, only 44852457 bytes were written to memory on the build side. That’s about 43800 KB, which is significantly less than half of available query memory.
spills!
We can’t conclude that exactly 44852457 bytes of memory were granted to the operator. However, it should be somewhat close. In conclusion, for these types of queries it isn’t clear what the memory grant fractions are supposed to mean. SQL Server is able to exceed them in some cases. It’s possible to see 0 bytes of memory used for the build side in the extended event. I believe that this is the bad type of memory reuse as opposed to the good kind.
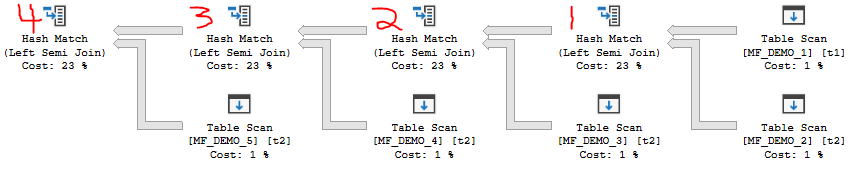
Batch Mode Memory Fractions For Nonconcurrent Join Plans
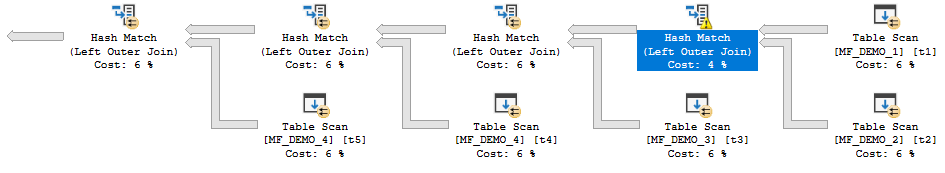
The following query results in a nonconcurrent batch mode hash join plan on my machine:
INSERT INTO TARGET_TABLE WITH (TABLOCK)
SELECT t1.ID
FROM MF_DEMO_1 t1
LEFT OUTER JOIN #ADD_BATCH_MODE On 1 = 0
WHERE EXISTS (
	SELECT 1
	FROM MF_DEMO_2 t2 WHERE t1.ID = t2.ID
) AND EXISTS (
	SELECT 1
	FROM MF_DEMO_3 t3 WHERE t1.ID = t3.ID
) AND EXISTS (
	SELECT 1
	FROM MF_DEMO_4 t4 WHERE t1.ID = t4.ID
) AND EXISTS (
	SELECT 1
	FROM MF_DEMO_5 t5 WHERE t1.ID = t5.ID
) OPTION (MAXDOP 4, FORCE ORDER);
As far as I know there’s nothing special about the semijoins. I used them to keep the estimated row size as consistent as possible. The behavior detailed below can be observed with normal joins as well.
Here is the estimated query plan. The same memory fraction pattern of 0.25, 0.50, 0.75, and 1.00 can be found in this query. Based on the query’s structure, memory grant reuse should be allowed between operators. Alarmingly, this query has the same desired memory grant as one with four concurrent joins. The desired memory grant changes significantly as tables are added or removed. This is a big change in behavior compared to row mode batch joins.
As far as I can tell, memory grant reuse can happen in plans like this with batch mode hash joins. Removing or adding joins results in very small adjustments in maximum memory used during query execution. Still, it seems as if the query optimizer is assuming that memory cannot be reused. With this query pattern, the first operator to run does not have access more memory implied by the memory fraction. In fact, it has access to less memory implied by the memory fraction.
Running the query without any memory grant hints results in no tempdb spills and a maximum memory use of 647168 KB. Restricting the memory grant to 2 GB results in a tempdb spill for the rightmost operator. This is unexpected. 500000 KB of memory should be more than enough memory to avoid a spill. As before, the only way I could find to investigate this further was to use the query_execution_batch_hash_join_spilled extended event and to force tempdb spills using the MAX_GRANT_PERCENT query hint.
A good amount of testing suggested that the available memory per operator is the input memory fraction for that operator divided by the sum of all output memory fractions. The rightmost operator only gets 0.25 / (0.25 + 0.5 + 0.75 + 1.0) = 10% of the memory granted to the query, the next operator gets 20%, the next operator gets 30%, and the final operator gets 40%. The situation gets worse as more joins are added to the query. Keep in mind that we aren’t doing anything tricky with cardinality estimates or data types which would result in skewed estimates. The query optimizer seems to recognize that each join will require the same amount of memory for each hash join, but it doesn’t make the same minimum amount available for each operator. That’s what is so puzzling.
The preceding paragraph seems to contradict the idea that memory grant reuse is possible for these plan shapes. Perhaps for these simple plans memory grant reuse is possible but it cannot go above 100% like we saw in the row mode plan. This could still be helpful in that the query could steal less memory from the buffer pool, but it’s certainly not as helpful in avoiding spills as the behavior we get with the row mode plan. Under the assumption the total memory grants seem a bit more reasonable, although it’s hard not to object as to how SQL Server is distributing the memory to each operator.
We can avoid the spill by giving SQL Server the memory that it required, but this is undesirable if multiple concurrent queries are running. I’ve often observed higher than expected memory grants for queries with batch mode hash joins. An assumption that query memory reuse will not be available for batch mode hash joins can explain part of what I’ve observed. If memory grants are left unchecked, applications may see decreased possible concurrency due to RESOURCE_SEMAPHORE waits. Lowering memory grants through any available method can result in unnecessary (based on total memory granted) tempdb spills. It’s easy to get stuck between a rock and a hard place.
Batch Mode Workarounds
There is some hope for nonconcurrent batch mode hash join plans. SQL Server 2017 introduces adaptive memory feedback for these operators. I imagine that functionality is a poor fit for ETL queries which may process dramatically different amounts of data each day, so I can’t view it as a complete solution. It certainly doesn’t help us on SQL Server 2016. Are there workarounds to prevent spills without requiring excessive memory grants? Yes, but they are very ugly and I can only imagine using them when truly needed during something like an ETL process.
Consider the following query:
INSERT INTO TARGET_TABLE WITH (TABLOCK)
SELECT t1.ID
FROM MF_DEMO_1 t1
LEFT OUTER JOIN MF_DEMO_2 t2 ON t2.ID = t1.ID
LEFT OUTER JOIN MF_DEMO_3 t3 ON t3.ID = t2.ID
LEFT OUTER JOIN MF_DEMO_4 t4 ON t4.ID = t3.ID
LEFT OUTER JOIN MF_DEMO_4 t5 ON t5.ID = t4.ID
LEFT OUTER JOIN #ADD_BATCH_MODE ON 1 = 0
OPTION (FORCE ORDER, MAXDOP 4, MAX_GRANT_PERCENT = 60);
On my machine, the memory hint results in a memory grant of 2193072 KB. The rightmost join spills even when only a maximum of 1232896 KB of memory is used during query execution:
more spills!
One way to avoid the spill is to shift the memory fractions in our favor. Ideally SQL Server would think that the rightmost join would need much more memory for its hash table than the other joins. If we can add an always NULL column with a large data type that is only needed for the first hash table, that might do the trick. The query syntax below isn’t guaranteed to get the plan that we want but it seems to work in this case:
ALTER TABLE MF_DEMO_1 ADD DUMMY_COLUMN_V4000 VARCHAR(4000) NULL;
ALTER TABLE MF_DEMO_2 ADD DUMMY_COLUMN_V10 VARCHAR(10) NULL;

INSERT INTO TARGET_TABLE WITH (TABLOCK)
SELECT t1.ID
FROM MF_DEMO_1 t1
LEFT OUTER JOIN MF_DEMO_2 t2 ON t2.ID = t1.ID
LEFT OUTER JOIN MF_DEMO_3 t3 ON t3.ID = t2.ID
LEFT OUTER JOIN MF_DEMO_4 t4 ON t4.ID = t3.ID
LEFT OUTER JOIN MF_DEMO_4 t5 ON t5.ID = t4.ID
LEFT OUTER JOIN #ADD_BATCH_MODE ON 1 = 0
WHERE (t1.DUMMY_COLUMN_V4000 IS NULL OR t2.DUMMY_COLUMN_V10 IS NULL)
OPTION (FORCE ORDER, MAXDOP 4, MAX_GRANT_PERCENT = 32);
An actual plan was uploaded here. The query no longer spills even though the memory grant was cut to 1225960 KB. The memory fractions are now 0.82053, 0.878593, 0.936655, and 1. The change was caused by the increase in estimated row size for the rightmost join: 2029 bytes. That row size is reduced to 45 bytes after the filter is applied, which won’t filter out any rows because both columns are always NULL. The FORCE ORDER hint is essential to get this plan shape. It’s very unnatural otherwise.
If the same rules are followed as before, the rightmost join should get 22.5% of the available query memory grant now. This is enough to avoid the spill to tempdb.
Final Thoughts
I understand that the formulas for memory fractions need to account for an arbitrary combination of row mode and batch mode operators in a query plan. However, it is disappointing that the available information for memory fractions for batch mode operators is so confusing, some queries with batch mode hash joins ask for way more memory than they need, and some queries needlessly spill to tempdb without using close to their full memory grant. Batch mode adaptive memory grant feedback can offer some relief in SQL Server 2017, but why not expect good plans the first time as long as we’re giving the query optimizer good information?
Thanks for reading!
Going Further
If this is the kind of SQL Server stuff you love learning about, you’ll love my training. I’m offering a 75% discount to my blog readers if you click from here. I’m also available for consulting if you just don’t have time for that and need to solve performance problems quickly.
Columnstore compression is complicated, and in some cases, surprising.
The Setup
The source data for the CCI has enough rows to fit six perfect rowgroups. The ID column is just sequential integers from 1 to 6291456. The ID2 column is the ID column modulo 20001. Code to load the data into a temp table:
DROP TABLE IF EXISTS #STG_DATA;
CREATE TABLE #STG_DATA (
	ID BIGINT NOT NULL,
	ID2 BIGINT NOT NULL,
	PRIMARY KEY (ID)
);

INSERT INTO #STG_DATA WITH (TABLOCK)
SELECT t.RN, t.RN % 20001
FROM
(
	SELECT TOP (6 * 1048576) ROW_NUMBER()
		OVER (ORDER BY (SELECT NULL)) RN
	FROM master..spt_values t1
	CROSS JOIN master..spt_values t2
) t;
Here’s the table definition for the target CCI:
DROP TABLE IF EXISTS dbo.TARGET_CCI;
CREATE TABLE dbo.TARGET_CCI (
	ID2 BIGINT NOT NULL,
	ID BIGINT NOT NULL,
	INDEX CCI CLUSTERED COLUMNSTORE
);
The reversal of column order is important for the demo below.
Changing MAXDOP
First let’s load the ID2 column the temp table into the CCI. The order of data can matter for compression so I have a superfluous TOP expression to force SQL Server to read the data in clustered key order.
INSERT INTO dbo.TARGET_CCI WITH (TABLOCK)
SELECT TOP (9876543210) ID2, 0
FROM #STG_DATA
ORDER BY ID
OPTION (MAXDOP 1);
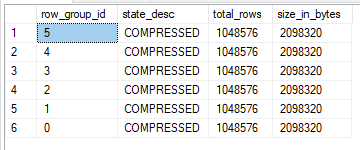
The insert query takes 2765 ms of CPU time and 2771 ms of elapsed time on my machine. According to sys.dm_db_column_store_row_group_physical_stats each rowgroup has a size of 2098320 bytes:
Now let’s move on to a parallel insert query with MAXDOP 2. The purpose of the second column in the CCI is to make the insert go parallel on my machine. It’s possible that you’ll need to use trace flag 8649 or some other trick to get a parallel insert. Here’s the code that I ran:
TRUNCATE TABLE dbo.TARGET_CCI;

INSERT INTO dbo.TARGET_CCI WITH (TABLOCK)
SELECT TOP (9876543210) ID2, 0
FROM #STG_DATA
ORDER BY ID
OPTION (MAXDOP 2);
The insert query now takes 3594 ms of CPU time and 2112 ms of elapsed time on my machine. The size of each rowgroup did not change. It’s still 2098320 bytes. Even though this is a parallel query there’s no element of randomness in this case. In the query plan we can see that the source table was scanned in a serial zone and round robin distribution is to used to distribute exactly half of the rows to each parallel thread.
This seems like a reasonable plan given that TOP forces a serial zone and we need to preserve order. It’s possible to rewrite the query to encourage a parallel scan of the source table, but that would introduce an order-preserving gather streams operator.
I’m not satisfied with the runtime yet, so I’m going to bump up MAXDOP to 3:
TRUNCATE TABLE dbo.TARGET_CCI;

INSERT INTO dbo.TARGET_CCI WITH (TABLOCK)
SELECT TOP (9876543210) ID2, 0
FROM #STG_DATA
ORDER BY ID
OPTION (MAXDOP 3);
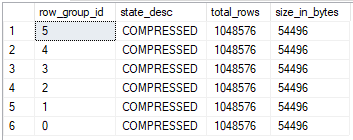
The insert query now takes 114172 ms of CPU time and 39208 ms of elapsed time to execute. However, each rowgroup now is just 54496 bytes.
The INSERT took significantly longer than before, but we have 38X better compression compared to the table after the MAXDOP 2 query. What happened?
Revealing the Magic Trick
An interesting pattern for compressed data sizes appears when working with repeated integers for a single rowgroup. The query that I tested with was roughly of the following format:
INSERT INTO dbo.CCI
SELECT t.RN % @MOD_NUM
FROM
(
	SELECT TOP (@ROWS_INSERTED)
		ROW_NUMBER()
		OVER (ORDER BY (SELECT NULL)) RN
	FROM master..spt_values t1
	CROSS JOIN master..spt_values t2
) t;
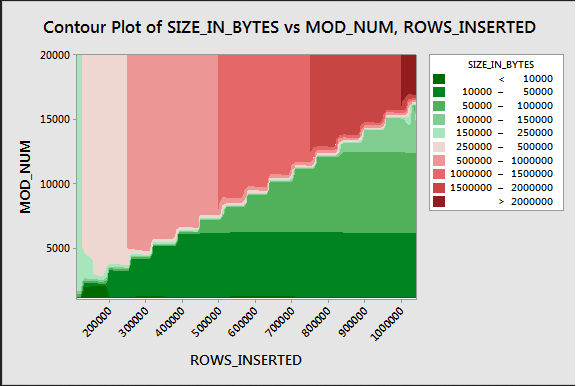
Below is a contour plot that shows how the compressed size for a single rowgroup varies as the number of rows and the modulus value changes:
Values that are repeated 64 or more times seem to be compressed much better than other values. This pattern definitely doesn’t always hold as you add more columns to the table which is why I made the ID2 column the first column in the target CCI. Why is this pattern relevant to the previous example?
Consider the MAXDOP 1 insert query. With a full rowgroup of 1048576 rows a value will be repeated at most 1048576/20001 = 53 times in each rowgroup. It doesn’t cross the threshold of 64 so we end up with a compressed size of 2098320 bytes.
Now consider the MAXDOP 2 insert query. The ordered data from the scan is distributed using round robin distribution on two threads. For the first 20001 rows from the scan, thread 0 gets all even values and thread 1 gets all odd values. For the next 20001 rows, thread 0 gets all odd values and thread 1 gets all even values. This occurs because 20001 isn’t divisible by 2. For all six compressed rowgroups we end up with the same data distribution as we had when doing MAXDOP 1 inserts. It makes sense that the compressed size remained at 2098320 bytes.
Now consider the MAXDOP 3 insert query. The query still uses round robin distribution but there are now three threads. 20001 is divisible by 3 so thread 0 only ends up with 6667 unique values from 0, 3, … to 19999. Thread 1 also ends up with 6667 unique values from 1, 4, … to 20000. Thread 2 follows a similar pattern. Each compressed rowgroup only has 6667 unique values instead of 20001. Each value shows up at least 157 times in the rowgroup, so all of the data qualifies for much better compression.
Final Thoughts
This has absolutely no practical value. Thanks for reading!
Going Further
If this is the kind of SQL Server stuff you love learning about, you’ll love my training. I’m offering a 75% discount to my blog readers if you click from here. I’m also available for consulting if you just don’t have time for that and need to solve performance problems quickly.
We recently observed many ROWGROUP_FLUSH deadlocks while doing concurrent inserts into CCIs. I’m not really a concurrency kind of guy but I figured that I should blog about this just so other people with the same problem can find some information about it.
Deadlock Reproduction
The schedulers of the involved sessions are important in some way, especially when going for a simple reproduction. It’s easiest to just make all new sessions go the same CPU:
ALTER SERVER CONFIGURATION
SET PROCESS AFFINITY CPU = 0;
Obviously you should never do that in production. After affinity has been addressed I recommend creating a nearly empty source table and a new CCI table:
DROP TABLE IF EXISTS dbo.CCI_DEADLOCKED;
CREATE TABLE dbo.CCI_DEADLOCKED (
	COL VARCHAR(1500),
	INDEX CCI CLUSTERED COLUMNSTORE
);

CREATE TABLE ##SOURCE_IDS (ID BIGINT NOT NULL);

INSERT INTO ##SOURCE_IDS WITH (TABLOCK)
SELECT TOP (1048576) ROW_NUMBER()
	OVER (ORDER BY (SELECT NULL))
FROM master..spt_values t1
CROSS JOIN master..spt_values t2
OPTION (MAXDOP 1);
One way to see the deadlock is to quickly kick off two inserts into the CCI_DEADLOCKED table from different sessions. Inserting a larger amount of data means that you’ll have more time to kick off the second session before the first completes, but a longer rollback time on the first session. On my machine inserting 1048576 rows of VARCHAR(1500) data seems like a reasonable compromise:
INSERT INTO dbo.CCI_DEADLOCKED
SELECT REPLICATE('Z', 1500)
FROM ##SOURCE_IDS
OPTION (MAXDOP 1, MAX_GRANT_PERCENT = 0);
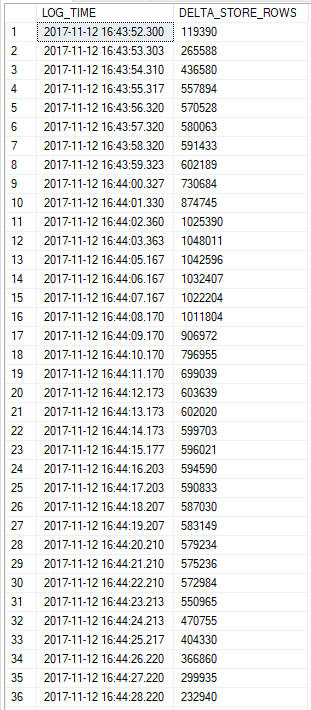
The second session waits on the first with a LCK_M_IX wait event. The first session loads all of its rows into the delta store, then deadlocks and rolls them all back. You can see this happen in near real time by looking at sys.dm_db_column_store_row_group_physical_stats:
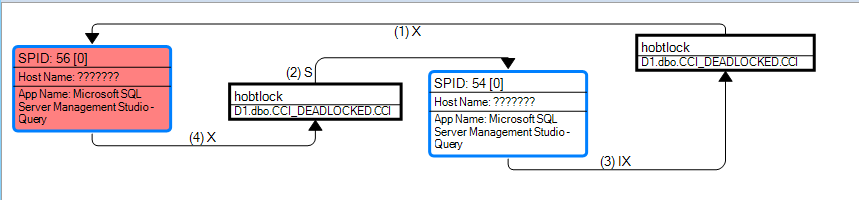
Here’s the deadlock XML for those who are interested in that kind of thing:
unknown
INSERT INTO dbo.CCI_DEADLOCKED SELECT REPLICATE('Z', 1500) FROM ##SOURCE_IDS OPTION (MAXDOP 1, MAX_GRANT_PERCENT = 0);
unknown
INSERT INTO dbo.CCI_DEADLOCKED SELECT REPLICATE('Z', 1500) FROM ##SOURCE_IDS OPTION (MAXDOP 1, MAX_GRANT_PERCENT = 0);
SSMS can't produce a deadlock graph for this type of deadlock. Below is the non-copy-and-pastable error message from it:
Failed to initialize deadlock control.
There is an error in XML document (1, 2497).
Instance validation error: 'ROWGROUP_FLUSH' is not a valid value for hobtlockSubresource.
If you're following along at home don't forget to reset your affinity to whatever you had it before. The most common option:
ALTER SERVER CONFIGURATION
SET PROCESS AFFINITY CPU = AUTO;
The Workarounds
We've only observed this deadlock with multiple concurrent sessions insert to the delta store for the same target CCI due to server memory pressure or very low cardinality estimates (less than 251 rows). The correct mitigation depends on why you're seeing the issue in the first place. If you're seeing it due to low cardinality estimates then fix your estimates, or at the very least get them above 250 rows. If you're seeing them because the memory grant for the CCI build times out after 25 seconds then lower concurrency or increase server memory.
The problem can also be avoided by not doing concurrent inserts in the first place. In some cases a parallel insert may be a reasonable alterative. There's also some evidence that the deadlock is only seen when the number of rows for insert is very close to 1048576, but we weren't able to make any definitive conclusions around that.
Final Thoughts
Don't despair if you run into a ROWGROUP_FLUSH deadlock! There's probably something you can do in the application to avoid it. If you feel that you shouldn't have to take such measures feel free to vote for my connect item here.
Going Further
If this is the kind of SQL Server stuff you love learning about, you'll love my training. I'm offering a 75% discount to my blog readers if you click from here. I'm also available for consulting if you just don't have time for that and need to solve performance problems quickly.
Adaptive joins are a new feature in SQL Server 2017. For adaptive join operators the decision to do a hash or loop join is deferred until enough input rows are counted. You can get an introduction on the topic in this blog post by Joe Sack. Dmitry Pilugin has an excellent post digging into the internals. The rest of this blog post assumes that you know the basics of adaptive joins.
Getting an Adaptive Join
It’s pretty easy to create a query that has an adaptive join in SQL Server 2017. Below I create a CCI with 100k rows and an indexed rowstore table with 400k rows:
DROP TABLE IF EXISTS dbo.MY_FIRST_CCI;

CREATE TABLE dbo.MY_FIRST_CCI (
	FILTER_ID_1 INT NOT NULL,
	FILTER_ID_2 INT NOT NULL,
	FILTER_ID_3 INT NOT NULL,
	JOIN_ID INT NOT NULL,
	INDEX CI CLUSTERED COLUMNSTORE
);

INSERT INTO dbo.MY_FIRST_CCI WITH (TABLOCK)
SELECT TOP (100000)
  t.RN
, t.RN
, t.RN
, t.RN
FROM
(
	SELECT ROW_NUMBER() OVER (ORDER BY (SELECT NULL)) RN
	FROM master..spt_values t1
	CROSS JOIN master..spt_values t2
) t
OPTION (MAXDOP 1);

ALTER TABLE dbo.MY_FIRST_CCI REBUILD WITH (MAXDOP = 1);

CREATE STATISTICS S1 ON dbo.MY_FIRST_CCI (FILTER_ID_1)
WITH FULLSCAN;
CREATE STATISTICS S2 ON dbo.MY_FIRST_CCI (FILTER_ID_2)
WITH FULLSCAN;
CREATE STATISTICS S3 ON dbo.MY_FIRST_CCI (FILTER_ID_3)
WITH FULLSCAN;
CREATE STATISTICS S4 ON dbo.MY_FIRST_CCI (JOIN_ID)
WITH FULLSCAN;

DROP TABLE If exists dbo.SEEK_ME;

CREATE TABLE dbo.SEEK_ME (
	JOIN_ID INT NOT NULL,
	PADDING VARCHAR(2000) NOT NULL,
	PRIMARY KEY (JOIN_ID)
);

INSERT INTO dbo.SEEK_ME WITH (TABLOCK)
SELECT TOP (400000)
  ROW_NUMBER() OVER (ORDER BY (SELECT NULL))
, REPLICATE('Z', 2000)
FROM master..spt_values t1
CROSS JOIN master..spt_values t2

CREATE STATISTICS S1 ON dbo.SEEK_ME (JOIN_ID)
WITH FULLSCAN;
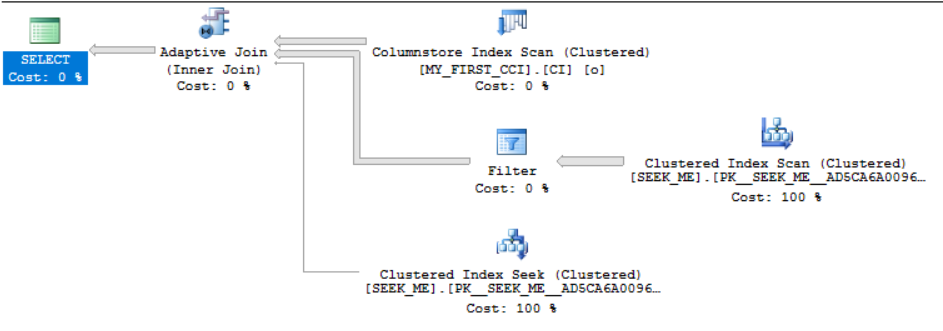
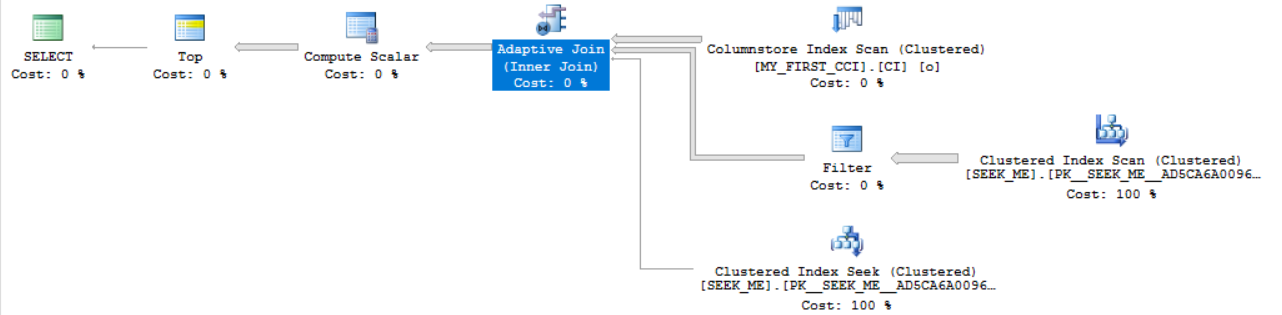
The full scan stats are just there to show that there isn’t any funny business with the stats. The below query gets an adaptive join:
SELECT *
FROM dbo.MY_FIRST_CCI o
INNER JOIN dbo.SEEK_ME i ON o.JOIN_ID = i.JOIN_ID
It’s obvious when it happens in SSMS:
It’s possible to get an adaptive join with even simpler table definitions. I created the tables this way because they’ll be used for the rest of this post.
Adaptive Threshold Rows
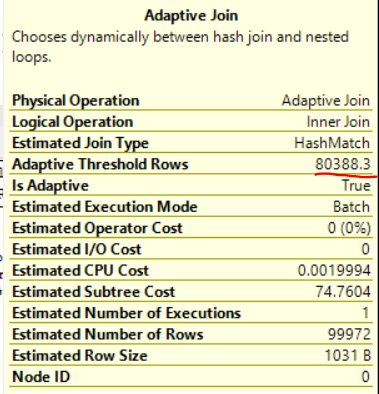
Unlike some other vendors, Microsoft was nice enough to expose the adaptive row threshold in SSMS when looking at estimated or actual plans:
The adaptive join saves input rows to a temporary structure and acts as a blocking operator until it makes a decision about which type of join to use. In this example, if there are less than 80388.3 rows then the adaptive join will execute as a nested loop join. Otherwise it’ll execute as a hash join.
The adaptive threshold row count can change quite a bit based on the input cardinality estimate. It changes to 22680 rows if I add the following filter that results in a single row cardinality estimate:
WHERE o.FILTER_ID_1 = 1
It was surprising to me to see so much variance for this query. There must be some overhead with doing the adaptive join but I wouldn’t expect the tipping point between a loop and hash join to change so dramatically. I would expect it to be close to a traditional tipping point calculated without adaptive joins.
Traditional Tipping Point
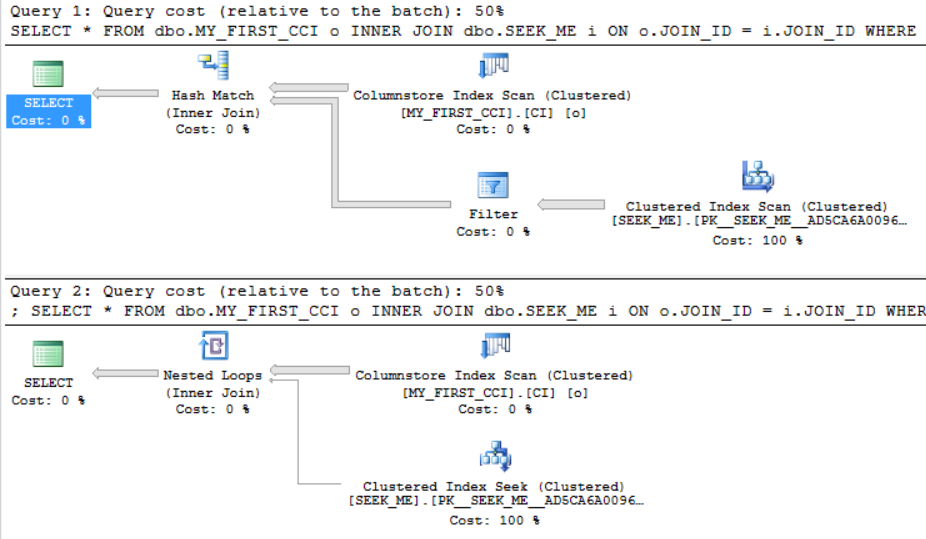
Let’s disable adaptive joins using the 'DISABLE_BATCH_MODE_ADAPTIVE_JOINS' USE HINT and consider how an execution plan would look for this query:
SELECT *
FROM dbo.MY_FIRST_CCI o
INNER JOIN dbo.SEEK_ME i ON o.JOIN_ID = i.JOIN_ID
WHERE o.FILTER_ID_1 BETWEEN @start AND @end
OPTION (
RECOMPILE,
USE HINT('DISABLE_BATCH_MODE_ADAPTIVE_JOINS')
);
We should expect a hash join if the local variables don’t filter out as many rows. Conversely, we should expect a loop join if the local variables on FILTER_ID_1 filter out many rows from the table. There’s a tipping point where the plan will change from a hash join to a loop join if we filter out a single additional row . On my machine, the tipping point is between 48295 and 48296 rows:
The estimated costs for the two queries are very close to each other: 74.6842 and 74.6839 optimizer units. However, we saw earlier that the tipping point for an adaptive join on this query can vary between 22680 and 80388.3 rows. This inconsistency means that we can find a query that performs worse with adaptive joins enabled.
The Regression
After some trial and error I found the following query:
SELECT *
FROM dbo.MY_FIRST_CCI o
INNER JOIN dbo.SEEK_ME i ON o.JOIN_ID = i.JOIN_ID
WHERE o.FILTER_ID_1 BETWEEN 1 AND 28000
AND o.FILTER_ID_2 BETWEEN 1 AND 28000
AND o.FILTER_ID_3 BETWEEN 1 AND 28000
ORDER BY (SELECT NULL)
	OFFSET 100001 ROWS FETCH NEXT 1 ROW ONLY
OPTION (MAXDOP 1);
The ORDER BY stuff isn’t important. It’s there just to not send any rows over the network. Here’s the plan:
The query has a cardinality estimate of 10777.7 rows coming out of the MY_FIRST_CCI table. The adaptive join has a tipping point of 27611.6 rows. However, I’ve constructed the table and the filter such that 28000 rows will be sent to the join. SQL Server expects a loop join, but it will instead do a hash join because 28000 > 27611.6. With a warm cache the query takes almost half a second:
CPU time = 469 ms, elapsed time = 481 ms.
If I disable adaptive joins, the query finishes in less than a fifth of a second:
CPU time = 172 ms, elapsed time = 192 ms.
A loop join is a better choice here, but the adaptive row threshold makes the adaptive join pick a hash join.
Final Thoughts
This post contains only a single test query, so it’s no cause for panic. It’s curious that Microsoft made the adaptive join tipping so dependent on cardinality estimates going into the join. I’m unable to figure out the design motivation for doing that. I would expect the other side of the join to be much more important.
Thanks for reading!
Going Further
If this is the kind of SQL Server stuff you love learning about, you’ll love my training. I’m offering a 75% discount to my blog readers if you click from here. I’m also available for consulting if you just don’t have time for that and need to solve performance problems quickly.