Advanced T-SQL String Searching And Parsing Techniques In SQL Server

IndexOf


First, I want to advise you to avoid doing things as much as possible like this in T-SQL. Use CLR, if you can. Or do it outside of your really expensive database server.

You know, rational choices.

Recently, I had an interesting client problem where they had a variety of string formats, and different potential start and end points to get a substring from.

Normally, I love computed columns for this, but there was no way to get exactly what they wanted without using a whole bunch of them. It was sort of annoying.

Because it was easier to get across in T-SQL, we ended up using a trigger.

Don’t look at me like that.

CharindexOf


First, let’s load up a small temp table with some different string values.

CREATE TABLE
    #strings
(
    string varchar(4)
);

INSERT
    #strings
(
    string
)
SELECT '1234' 
  UNION ALL
SELECT '2341' 
  UNION ALL
SELECT '3412'    
  UNION ALL
SELECT '4123';

Now, let’s say that there was a need to figure out which number came first in the string. You can use the CHARINDEX function to do that, but it’s a little difficult to make it “dynamic”.

To make things easy, let’s create a helper table of search patterns.

CREATE TABLE
    #searches
(
    search varchar(1)
);

INSERT
    #searches
(
    search
)
SELECT '1' 
  UNION ALL
SELECT '2' 
  UNION ALL
SELECT '3'    
  UNION ALL
SELECT '4';

ApplyOf


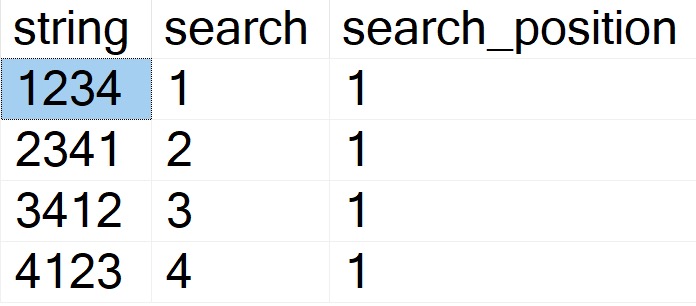
Now we can use a little bit of apply and derived table magic to figure out which of our search values appear first in our strings.

SELECT 
    s.string, 
    x1.search,
    x1.search_position
FROM #strings AS s
CROSS APPLY 
(
    SELECT TOP (1) 
        x0.search,
        x0.search_position
    FROM 
    (
        SELECT
            s2.search,
            search_position = 
                CHARINDEX(s2.search, s.string)
        FROM #searches AS s2
     ) AS x0 
     ORDER BY x0.search_position
) AS x1;

The results look like this:

SQL Server Query Results
medium

SubstringOf


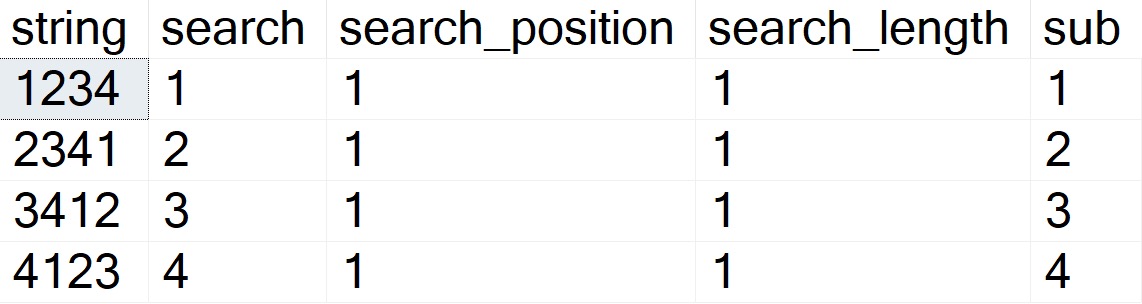
Now we can add in the LEN and SUBSTRING functions in order to parse out the part of the column we’re interested in.

SELECT 
    s.string, 
    x1.search, 
    x1.search_position, 
    x1.search_length,
    sub = 
        SUBSTRING
        (
            x1.search,
            x1.search_position,
            x1.search_length
        )
FROM #strings AS s
CROSS APPLY 
(
    SELECT TOP (1) 
        x0.search,
        x0.search_position,
        x0.search_length
    FROM 
    (
        SELECT
            s2.search,
            search_position = 
                CHARINDEX(s2.search, s.string),
            search_length = 
                LEN(s2.search)
        FROM #searches AS s2
     ) AS x0 
     ORDER BY x0.search_position
) AS x1;

Now the results look like this:

SQL Server Query Results
Smart E. Pants

This is an admittedly pretty rudimentary example, but it’s tough to make this complicated without making it overly so.

From here, you can use a second APPLY with CHARINDEX ordered descending to find an end position, and use more advanced SUBSTRING techniques to locate the text between two positions.

Thanks for reading!

Going Further


If this is the kind of SQL Server stuff you love learning about, you’ll love my training. I’m offering a 75% discount to my blog readers if you click from here. I’m also available for consulting if you just don’t have time for that and need to solve performance problems quickly.

What’s The Point Of DOP Feedback In SQL Server 2022?

Loud Engine


If you’re ever on a long flight and want something to fall asleep to, ask a DBA how to set MAXDOP.

Sometimes I even ask myself that question when I’m tossing and turning at night.

There are a lot of things to consider when fixing settings globally across a workload. For parallelism, it’s less about individual query performance, and more about overall server/workload performance

After all, letting every query go as absolutely parallel as possible is only good up to a point; that point is usually when you start regularly running out of worker threads, or your CPUs could double as crematoriums.

Setting MAXDOP is about limiting the damage that a parallel workload can do to a server. The expectation is that a query running at DOP 8 will run 8x faster than a query running at DOP 1.

But setting MAXDOP for every query isn’t something you catch even the most persnickety performance tuners doing. Perhaps some of the more critical ones, but you know…

Let Me Rust


I’m not going to demo DOP feedback in this post, I’m just going to show you the situation that it hopes to improve upon.

To do that, I’m going to run a simple aggregation query at different degrees of parallelism, and show you the changes in query timing.

At DOP 1:

The query runs for 1.1 seconds, with 886ms consumed while scanning the Posts table.

SQL Server Query Plan
DOPPER DON

At DOP 2:

The query runs just about twice as fast, starting with the scan of the Posts table taking about half as long. This is good scaling. Add one CPU, go twice as fast as you did with one CPU.

SQL Server Query Plan
Rip Van Winkle

At DOP 4:

The gets about twice as fast again! The scan of the Posts table is now down to 263ms, and the query in total is at 330ms. Adding in two more cores seems a good choice, here.

SQL Server Query Plan
Bed Rock

At DOP 8:

The query no longer continues to get 2x faster. This isn’t a knock against DOP 8 in general; my query just happens to hit a wall around DOP 4. With 4 additional CPUs, we only save ~130ms at the end of the day.

SQL Server Query Plan
Anubis

Why This Is Cool


This new feature will help DBAs have to worry less about getting MAXDOP absolutely right across the board. Who knows, we may even see a day where MAXDOP is left at zero.

But you’d never skip that installer step, would you?

Anyway, for anyone out there who is paranoid about setting DOP too high, this should help your queries find a more approximately-good middle ground.

Hopefully it works as advertised.

Thanks for reading!

Going Further


If this is the kind of SQL Server stuff you love learning about, you’ll love my training. I’m offering a 75% discount to my blog readers if you click from here. I’m also available for consulting if you just don’t have time for that and need to solve performance problems quickly.

Catch Me At Techorama Netherlands For A Precon And More!

Star Trecht


This October 10-12, I’ll be in Utrecht for the wonderful and fabulous Techorama conference!

Get your tickets here.

You can catch me putting on my Professional Performance Tuning Blueprint full day training session.

Searching the internet for every problem isn’t cutting it. You need to be more proactive and efficient when it comes to finding and solving database performance fires.

I work with consulting customers around the world to put out SQL Server performance fires. In this day of learning, I will teach you how to find and fix your worst SQL Server problems using the same modern tools and techniques which I use every week.

You’ll learn tons of new and effective approaches to common performance problems, how to figure out what’s going on in your query plans, and how indexes really work to make your queries faster. Together, we’ll tackle query rewrites, batch mode, how to design indexes, and how to gather all the information you need to analyze performance.

This day of learning will teach you cutting edge techniques which you can’t find in training by folks who don’t spend time in the real world tuning performance. Performance tuning mysteries can easily leave you stumbling through your work week, unsure if you’re focusing on the right things. You’ll walk out of this class confident in your abilities to fix performance issues once and for all.

If you want to put out SQL Server performance fires, this is the precon you need to attend. Anyone can have a plan, it takes a professional to have a blueprint.

I’ve also got a couple regular sessions that’ll get announced later on.

Get your tickets here.

See you there!

Going Further


If this is the kind of SQL Server stuff you love learning about, you’ll love my training. I’m offering a 75% discount to my blog readers if you click from here. I’m also available for consulting if you just don’t have time for that and need to solve performance problems quickly.

SQL Server 2022 Finally Adds Actual Non Parallel Plan Reasons To Query Plans

Wayback Machine


SQL Server query plans have had, forever, pretty generic reasons embedded in the XML for why your query was prevented from going parallel.

Not for things like it not breaking the Cost Threshold For Parallelism barrier, which should be obvious to the end user, but certainly for things like scalar UDFs, etc.

The thing is, the reason always seemed to be “Could Not Generate Valid Parallel Plan” for most of them, even though more explicit reasons were available.

They started cropping up, as things do, in Azure SQL DB, and have finally made it to the box product that we all know and mostly love.

Let’s explore some of them! Because that’s what we do.

Generate Valid Blog Post


First, some intrinsic functions prevent a parallel plan. You can always see the reason (if one exists) if you look in the properties of the root operator in the query plan.

SQL Server Query Plan Properties
not for you!

Some Intrinsic Functions

An easy one to validate this with is OBJECT_NAME

SELECT
    c = OBJECT_NAME(COUNT_BIG(*))
FROM dbo.Posts AS p;

For this, we’ll see this show up:

NonParallelPlanReason="NonParallelizableIntrinsicFunction"

Setting MAXDOP To One

This was one of the few reasons that was generally available going back to SQL Server 2012:

SELECT
    c = COUNT_BIG(*)
FROM dbo.Posts AS p
OPTION(MAXDOP 1);

And obviously:

NonParallelPlanReason="MaxDOPSetToOne"

Table Variable Modifications

Here’s a sneaky one that I’ve been trying to warn folks about forever:

DECLARE
    @c table 
(
    c bigint
);

INSERT
    @c
(
    c
)
SELECT
    c = COUNT_BIG(*)
FROM dbo.Posts AS p;

Bit of a mouthful, but hopefully this makes things quite perfectly clear:

NonParallelPlanReason="TableVariableTransactionsDoNotSupportParallelNestedTransaction"

Fast Forward Cursors

There’s always some hijinks about with cursors, but here you go:

DECLARE 
    @c bigint;

DECLARE 
    c CURSOR 
    FAST_FORWARD 
FOR 
SELECT
    c = COUNT_BIG(*)
FROM dbo.Posts AS p;

OPEN c;

FETCH NEXT 
FROM 
    c
INTO 
    @c;

CLOSE c;
DEALLOCATE c;
GO

This is another reason that I have seen around for a while too, but we may as well be thorough:

NonParallelPlanReason="NoParallelFastForwardCursor"

Scalar Functions That Can’t Be Inlined

Shocking, I know! I know.

CREATE OR ALTER FUNCTION
    dbo.c
(
    @c bigint
)
RETURNS bigint
WITH SCHEMABINDING, RETURNS NULL ON NULL INPUT
AS  
BEGIN
    DECLARE /*Ruin UDF inlining with one weird trick*/
        @gd datetime = GETDATE();    
    RETURN @c;
END;
GO 

SELECT
    c = dbo.c(COUNT_BIG(*))
FROM dbo.Posts AS p;

And from the XML:

NonParallelPlanReason="TSQLUserDefinedFunctionsNotParallelizable"

Groovy


Fun stuff is always in XML. Just think about all the best times in your life. I bet XML was involved.

Now when you look at it, it will tell you what’s screwing up parallel plan generation in your SQL Server queries.

J’accuse, as they say.

Thanks for reading!

Going Further


If this is the kind of SQL Server stuff you love learning about, you’ll love my training. I’m offering a 75% discount to my blog readers if you click from here. I’m also available for consulting if you just don’t have time for that and need to solve performance problems quickly.

What Do Optimizer Timeouts Really Mean In SQL Server Query Plans?

Time Is On My Side


Whenever I’m looking over query plans with clients, their eyes get drawn towards many things that I’ve learned to ignore over the years.

It’s not that they’re never important, it’s just that, you know… There’s usually more important stuff.

One of those things is compilation timeouts. Most people think that it’s time-based, and it means that their query timed out or took a long time to compile.

Not so! It’s purely a set number of steps the optimizer will take to figure out things like:

  • Join order
  • Join/Aggregate type
  • Index usage
  • Seeks vs Scans
  • Parallelism

And probably some other stuff that I just don’t have the Friday afternoon energy to think about any more.

But anyway, the point is that it’s not a sign that your query timed out, or even that plan compilation took a long time.

The initial number of steps allowed is based on the optimizer’s assessment of statement complexity, which includes the number of joins (of course), in case you were wondering.

From there each additional stage gets a set number of steps based on the number of steps that the previous stage took.

Plan Cache Script


You can use this script to look in your plan cache for plans that the optimizer has marked as having a timeout.

WITH 
    XMLNAMESPACES
(
    DEFAULT 'http://schemas.microsoft.com/sqlserver/2004/07/showplan'
)
SELECT
    query_text = 
        SUBSTRING
        (
            st.text,
            qs.statement_start_offset / 2 + 1,
            CASE qs.statement_start_offset
                 WHEN -1 
                 THEN DATALENGTH(st.text)
                 ELSE qs.statement_end_offset
            END - qs.statement_start_offset / 2 + 1
        ),
    compile_time_ms = 
        qs.query_plan.value('(//StmtSimple/QueryPlan/@CompileTime)[1]', 'bigint'),
    compile_cpu_ms = 
        qs.query_plan.value('(//StmtSimple/QueryPlan/@CompileCPU)[1]', 'bigint'),
    compile_memory_mb = 
        qs.query_plan.value('(//StmtSimple/QueryPlan/@CompileMemory)[1]', 'bigint') / 1024.,
    qs.query_plan,
    qs.execution_count,
    qs.total_worker_time,
    qs.last_execution_time
FROM
(
    SELECT TOP (10)
        qs.plan_handle,
        qs.sql_handle,
        qs.statement_start_offset,
        qs.statement_end_offset,
        qs.last_execution_time,
        qs.execution_count,
        qs.total_worker_time,
        qp.query_plan
    FROM sys.dm_exec_query_stats AS qs
    CROSS APPLY sys.dm_exec_query_plan(qs.plan_handle) AS qp
    WHERE qp.query_plan.exist('//StmtSimple/@StatementOptmEarlyAbortReason[.="TimeOut"]') = 1
    ORDER BY
        total_worker_time / qs.execution_count DESC
) AS qs
CROSS APPLY sys.dm_exec_sql_text(qs.sql_handle) AS st;

There’s not a whole lot of sense to this query other than to prove a point. Here are some abridged results from a client system:

SQL Server Query Results
amanaplanacanalpanama

Despite all of these queries “timing out” during optimization phases, the longest compile time is 61 milliseconds.

Query Store Script


Like above, there’s not a lot of sense to this one. It is nice to be able to skip some of the additional XML shredding and go to some of the plan metadata stored in Query Store:

WITH 
    XMLNAMESPACES
(
    DEFAULT 'http://schemas.microsoft.com/sqlserver/2004/07/showplan'
),
    queries
AS
    (
        SELECT TOP (101)
            parent_object_name = 
                ISNULL
                (
                    OBJECT_NAME(qsq.object_id), 
                    'No Parent Object'
                ),
            qsqt.query_sql_text,
            query_plan = 
                TRY_CAST(qsp.query_plan AS xml),
            qsrs.last_execution_time,
            qsrs.count_executions,
            qsrs.avg_duration,
            qsrs.avg_cpu_time,
            avg_compile_duration_ms = 
                qsq.avg_compile_duration / 1000.,
            avg_compile_memory_mb = 
                qsq.avg_compile_memory_kb / 1024.,
            avg_optimize_cpu_time_ms = 
                qsq.avg_optimize_cpu_time / 1024.
        FROM sys.query_store_runtime_stats AS qsrs
        JOIN sys.query_store_plan AS qsp
            ON qsp.plan_id = qsrs.plan_id
        JOIN sys.query_store_query AS qsq
            ON qsq.query_id = qsp.query_id
        JOIN sys.query_store_query_text AS qsqt
            ON qsqt.query_text_id = qsq.query_text_id
        WHERE qsrs.last_execution_time >= DATEADD(DAY, -7, SYSDATETIME())
        AND   qsrs.avg_cpu_time >= (10 * 1000)
        AND   qsq.is_internal_query = 0
        AND   qsp.is_online_index_plan = 0
        AND   TRY_CAST(qsp.query_plan AS xml).exist('//StmtSimple/@StatementOptmEarlyAbortReason[.="TimeOut"]') = 1
        ORDER BY
            qsrs.avg_cpu_time DESC
    )
SELECT
    qs.query_sql_text,
    qs.parent_object_name,    
    qs.query_plan,
    qs.avg_compile_duration_ms,
    qs.avg_optimize_cpu_time_ms,
    qs.avg_compile_memory_mb,
    qs.count_executions,
    qs.avg_duration,
    qs.avg_cpu_time,
    qs.last_execution_time
FROM
    queries AS qs
ORDER BY
    qs.avg_cpu_time DESC
OPTION (RECOMPILE);

Also like above, the results bring back very short compile times.

So There


The point of this post was that you don’t need to worry about these timeouts from a plan compilation time perspective.

Of course, it may represent a plan quality issue, but that’s much harder to prove from first glances. You’d need to dig into that on your own Friday afternoon.

If you find user queries experiencing optimizer timeouts, it may solve the problem to simplify them as much as possible. Breaking long queries up into #temp tables is a popular solution for this.

Thanks for reading!

Going Further


If this is the kind of SQL Server stuff you love learning about, you’ll love my training. I’m offering a 75% discount to my blog readers if you click from here. I’m also available for consulting if you just don’t have time for that and need to solve performance problems quickly.

Some Thoughts On Query Store Hints In SQL Server 2022

Young And Old


Query hints seem to get treated like prescription drugs. You hear all the problems they can solve, but then you get a long list of problems they can cause.

“Your cholesterol will be lower, but you might bleed to death from your eyes.”

I use query hints all the time to show people what different (and often better) query plans would look like, and why they weren’t chosen.

Sometimes it’s cardinality estimation, sometimes it’s costing, sometimes there was an optimization timeout, and other times…

Msg 8622, Level 16, State 1, Line 20
Query processor could not produce a query plan because of the hints defined in this query. Resubmit the query without specifying any hints and without using SET FORCEPLAN.

Because, you know, you can’t always get what you want.

Problem Statement


When you’re dealing with untouchable vendor code full of mistakes, ORM queries that God has turned away from, and other queries that for some reason can’t be tinkered with, we used to not have a lot of options.

In SQL Server 2022, Query Store gains a new super power: you can add hints to queries without intercepting the code in some other manner.

This is going to be a game changer in a lot of cases, because you can hint all sorts of useful changes to queries that would otherwise be stuck forever in their current hell.

Of course, not everything is supported. How could it all be? That would be insane.

According to the docs, here’s what’s supported currently:

These query hints are supported as Query Store hints:

{ HASH | ORDER } GROUP   
  | { CONCAT | HASH | MERGE } UNION   
  | { LOOP | MERGE | HASH } JOIN   
  | EXPAND VIEWS   
  | FAST number_rows   
  | FORCE ORDER   
  | IGNORE_NONCLUSTERED_COLUMNSTORE_INDEX  
  | KEEP PLAN   
  | KEEPFIXED PLAN  
  | MAX_GRANT_PERCENT = percent  
  | MIN_GRANT_PERCENT = percent  
  | MAXDOP number_of_processors   
  | NO_PERFORMANCE_SPOOL   
  | OPTIMIZE FOR UNKNOWN  
  | PARAMETERIZATION { SIMPLE | FORCED }   
  | RECOMPILE  
  | ROBUST PLAN   
  | USE HINT   ( '<hint_name>' [ , ...n ] )

And here’s what’s not supported:

The following query hints are currently unsupported:

This is where things get… tough. There aren’t any super-important query hints missing, but not being able to use ANY table hints is bad news for a number of reasons.

Duck Hint


Included in the potential table hints are all these delights:

WITH ( <table_hint> [ [, ]…n ] )
<table_hint> ::=
{ NOEXPAND [ , INDEX ( <index_value> [ ,…n ] ) | INDEX = ( <index_value> ) ]
| INDEX ( <index_value> [ ,…n ] ) | INDEX = ( <index_value> )
| FORCESEEK [ ( <index_value> ( <index_column_name> [,… ] ) ) ]
| FORCESCAN
| FORCESEEK
| HOLDLOCK
| NOLOCK
| NOWAIT
| PAGLOCK
| READCOMMITTED
| READCOMMITTEDLOCK
| READPAST
| READUNCOMMITTED
| REPEATABLEREAD
| ROWLOCK
| SERIALIZABLE
| SNAPSHOT
| SPATIAL_WINDOW_MAX_CELLS = <integer_value>
| TABLOCK
| TABLOCKX
| UPDLOCK
| XLOCK
}
No index hints, no locking hints, no isolation level hints, no access method hints, and… no NOEXPAND hint 😭
The prior being made even more aggravating because EXPAND VIEWS is a query hint.
No one ever expands indexed views.

Gridlock


This feature has me pretty excited for SQL Server 2022. In particular for Entity Framework queries, I can see myself using:

  • FORCE ORDER
  • NO_PERFORMANCE_SPOOL
  • RECOMPILE

Maybe even all together. The more the merrier! Like beans.

I do hope that at some point there is a workaround for some of the table hints getting used, but in 4 years when folks finally start adopting this newfangled version, I’ll have a grand time fixing problems that used to be out of my reach.

Thanks for reading!

Going Further


If this is the kind of SQL Server stuff you love learning about, you’ll love my training. I’m offering a 75% discount to my blog readers if you click from here. I’m also available for consulting if you just don’t have time for that and need to solve performance problems quickly.

SQL Server 2022 Is Going To Mess Up Your Query Monitoring Scripts

At Least For Now


SQL Server 2022 has a new feature in it to help with parameter sensitive query plans.

That is great. Parameter sensitivity, sometimes just called parameter sniffing, can be a real bear to track down, reproduce, and fix.

In a lot of the client work I do, I end up using dynamic SQL like this to get things to behave:

But with this new feature, you get some of the same fixes without having to interfere with the query at all.

How It Works


You can read the full documentation here. But you don’t read the documentation, and the docs are missing some details at the moment anyway.

  • It only works on equality predicates right now
  • It only works on one predicate per query
  • It only gives you three query plan choices, based on stats buckets

There’s also some additional notes in the docs that I’m going to reproduce here, because this is where you’re gonna get tripped up, if your scripts associate statements in the case with calling stored procedures, or using object identifiers from Query Store.

For each query variant mapping to a given dispatcher:

  • The query_plan_hash is unique. This column is available in sys.dm_exec_query_stats, and other Dynamic Management Views and catalog tables.

  • The plan_handle is unique. This column is available in sys.dm_exec_query_statssys.dm_exec_sql_textsys.dm_exec_cached_plans, and in other Dynamic Management Views and Functions, and catalog tables.

  • The query_hash is common to other variants mapping to the same dispatcher, so it’s possible to determine aggregate resource usage for queries that differ only by input parameter values. This column is available in sys.dm_exec_query_statssys.query_store_query, and other Dynamic Management Views and catalog tables.

  • The sql_handle is unique due to special PSP optimization identifiers being added to the query text during compilation. This column is available in sys.dm_exec_query_statssys.dm_exec_sql_textsys.dm_exec_cached_plans, and in other Dynamic Management Views and Functions, and catalog tables. The same handle information is available in the Query Store as the last_compile_batch_sql_handle column in the sys.query_store_query catalog table.

  • The query_id is unique in the Query Store. This column is available in sys.query_store_query, and other Query Store catalog tables.

The problem is that, sort of like dynamic SQL, this makes each different plan/statement impossible to tie back to the procedure.

What I’ve Tried


Here’s a procedure that is eligible for parameter sensitivity training:

CREATE OR ALTER PROCEDURE 
    dbo.SQL2022
(
    @ParentId int
)
AS
BEGIN
SET NOCOUNT, XACT_ABORT ON;

    SELECT TOP (10) 
        u.DisplayName, 
        p.*
    FROM dbo.Posts AS p
    JOIN dbo.Users AS u
        ON p.OwnerUserId = u.Id
    WHERE p.ParentId = @ParentId
    ORDER BY u.Reputation DESC;

END;
GO

Here’s the cool part! If I run this stored procedure back to back like so, I’ll get two different query plans without recompiling or writing dynamic SQL, or anything else:

EXEC dbo.SQL2022
    @ParentId = 184618;
GO 

EXEC dbo.SQL2022 
    @ParentId = 0;
GO
SQL Server Query Plan
amazing!

It happens because the queries look like this under the covers:

SELECT TOP (10) 
    u.DisplayName, 
    p.*
FROM dbo.Posts AS p
JOIN dbo.Users AS u
    ON p.OwnerUserId = u.Id
WHERE p.ParentId = @ParentId
ORDER BY u.Reputation DESC 
OPTION (PLAN PER VALUE(QueryVariantID = 1, predicate_range([StackOverflow2010].[dbo].[Posts].[ParentId] = @ParentId, 100.0, 1000000.0)))

SELECT TOP (10) 
    u.DisplayName, 
    p.*
FROM dbo.Posts AS p
JOIN dbo.Users AS u
    ON p.OwnerUserId = u.Id
WHERE p.ParentId = @ParentId
ORDER BY u.Reputation DESC 
OPTION (PLAN PER VALUE(QueryVariantID = 3, predicate_range([StackOverflow2010].[dbo].[Posts].[ParentId] = @ParentId, 100.0, 1000000.0)))

Where Things Break Down


Normally, sp_BlitzCache will go through whatever statements it picks up and associate them with the parent object:

EXEC sp_BlitzCache
    @DatabaseName = 'StackOverflow2010';

But it doesn’t do that here, it just says that they’re regular ol’ statements:

SQL Server Query Results
do i know you?

The way that it attempts to identify queries belonging to objects is like so:

RAISERROR(N'Attempting to get stored procedure name for individual statements', 0, 1) WITH NOWAIT;
UPDATE  p
SET     QueryType = QueryType + ' (parent ' +
                    + QUOTENAME(OBJECT_SCHEMA_NAME(s.object_id, s.database_id))
                    + '.'
                    + QUOTENAME(OBJECT_NAME(s.object_id, s.database_id)) + ')'
FROM    ##BlitzCacheProcs p
        JOIN sys.dm_exec_procedure_stats s ON p.SqlHandle = s.sql_handle
WHERE   QueryType = 'Statement'
AND SPID = @@SPID
OPTION (RECOMPILE);

Since SQL handles no longer match, we’re screwed. I also looked into doing something like this, but there’s nothing here!

SELECT 
    p.plan_handle, 
    pa.attribute, 
    object_name = 
        OBJECT_NAME(CONVERT(int, pa.value)),
    pa.value
FROM
(
    SELECT 0x05000600B7F6C349E0824C498D02000001000000000000000000000000000000000000000000000000000000 --Proc plan handle
    UNION ALL 
    SELECT 0x060006005859A71BB0304D498D02000001000000000000000000000000000000000000000000000000000000 --Query plan handle
    UNION ALL
    SELECT 0x06000600DCB1FC11A0224D498D02000001000000000000000000000000000000000000000000000000000000 --Query plan handle
) AS p (plan_handle)
CROSS APPLY sys.dm_exec_plan_attributes (p.plan_handle) AS pa
WHERE pa.attribute = 'objectid';

The object identifiers are all amok:

SQL Server Query Results
oops i didn’t do it again

Only the stored procedure has the correct one.

The same thing happens in Query Store, too:

EXEC sp_QuickieStore
    @debug = 1;
SQL Server Query Result
lost in translation

The object identifiers are 0 for these two queries.

One Giant Leap


This isn’t a complaint as much as it is a warning. If you’re a monitoring tool vendor, script writer, or script relier, this is gonna make things harder for you.

Perhaps it’s something that can or will be fixed in a future build, but I have no idea at all what’s going to happen with it.

Maybe we’ll have to figure out a different way to do the association, but stored procedures don’t get query hashes or query plan hashes, only the queries inside it do.

This is gonna be a tough one!

Thanks for reading!

Going Further


If this is the kind of SQL Server stuff you love learning about, you’ll love my training. I’m offering a 75% discount to my blog readers if you click from here. I’m also available for consulting if you just don’t have time for that and need to solve performance problems quickly.

SQL Server 2022: What The Heck Is sp_copy_data_in_batches?

Make It Or Not


I’m gonna be honest with you, dear reader, because without honesty we’ve got nothing.

Except lies — which you know — those can be comforting sometimes. Hm. I’ll have to think about that one for a bit.

While digging through to find new stuff in SQL Server 2022, this stored procedure caught my eye.

If you try to get the text of it, you get told off. It’s All Internal© as they say on the tubes.

EXEC sp_helptext 
    'sp_copy_data_in_batches';

Well, okay. But we can try to get it working on our own. Usually I use this method to figure out what parameters a new thing requires to run.

Not this time!

Trial And Error


What I usually do is stick NULL or DEFAULT after the EXEC to to see what comes back. Sometimes using a number or something makes sense too, but whatever.

This at least helps you figure out:

  • Number of parameters
  • Expected data types
  • Parameter NULLability
  • Etc. and whenceforth

Eventually, I figured out that sp_copy_data_in_batches requires two strings, and that it expects those strings to exist as tables.

The final command that ended up working was this. Note that there is no third parameter at present to specify a batch size.

sp_copy_data_in_batches 
    N'dbo.art', 
    N'dbo.fart';

Path To Existence


This, of course, depends on two tables existing that match those names.

CREATE TABLE dbo.art(id int NOT NULL PRIMARY KEY);
CREATE TABLE dbo.fart(id int NOT NULL PRIMARY KEY);

One thing to note here is that you don’t need a primary key to do this, but the table definitions do need to match exactly or else you’ll get this error:

Msg 37486, Level 16, State 2, Procedure sp_copy_data_in_batches, Line 1 [Batch Start Line 63]
'sp_copy_data_in_batches' failed because column 'id' does not have the same collation, 
nullability, sparse, ANSI_PADDING, vardecimal, identity or generated always attribute, CLR type 
or schema collection in tables '[dbo].[art]' and '[dbo].[fart]'.

Because GENERATE_SERIES is still a bit rough around the edges, I’m gonna do this the old fashioned way, which turns out a bit faster.

INSERT 
    dbo.art WITH(TABLOCK)
(
    id
)
SELECT TOP (10000000)
    id = 
        ROW_NUMBER() OVER 
        (
            ORDER BY 1/0
        )
FROM sys.messages AS m
CROSS JOIN sys.messages AS m2;

Behind The Scenes


I sort of expected to run some before and after stuff, and see the count slowly increment, but the query plan for sp_copy_data_in_batches just showed this:

SQL Server Query Plan
wink wink

I’m not really sure what the batching is here.

Also, this is an online index operation, so perhaps it won’t work in Standard Edition. If there even is a Standard Edition anymore?

Has anyone heard from Standard Edition lately?

Thanks for reading!

Going Further


If this is the kind of SQL Server stuff you love learning about, you’ll love my training. I’m offering a 75% discount to my blog readers if you click from here. I’m also available for consulting if you just don’t have time for that and need to solve performance problems quickly.

SQL Server 2022: GENERATE_SERIES Causes Parallel Deadlocks In A Transaction

Many Times!


These table valued functions of the built-in variety have this problem.

This one is no exception. Well, it does throw an exception. But you know.

That’s not exceptional.

DROP TABLE IF EXISTS
    dbo.select_into;

BEGIN TRAN

SELECT
    id = 
        gs.value
INTO dbo.select_into
FROM GENERATE_SERIES
     (
         START = 1, 
         STOP = 10000000
     ) AS gs
OPTION(MAXDOP 8);

COMMIT;

If you run the above code, you’ll get this error:

Msg 1205, Level 13, State 78, Line 105
Transaction (Process ID 70) was deadlocked on lock | communication buffer resources with another process and has been chosen as the deadlock victim. Rerun the transaction.
SQL Server Error
pilot program

Like the issues I outlined in yesterday’s post, I do hope these get fixed before go-live.

Thanks for reading!

Going Further


If this is the kind of SQL Server stuff you love learning about, you’ll love my training. I’m offering a 75% discount to my blog readers if you click from here. I’m also available for consulting if you just don’t have time for that and need to solve performance problems quickly.

SQL Server 2022 GENERATE_SERIES: Some Notes At Release Time

Yep, I know

a great post
great post, psychic

It’s the first public CTP. Things will change. Things will get better. Think about the rich history of Microsoft fixing stuff immediately, like with adding an ordinal position to STRING_SPLIT.

That came out in SQL Server 2016, and uh… Wait, they just added the ordinal position in SQL Server 2022. There were two major versions in between that function getting released and any improvements.

With that in mind, I’m extending as much generosity of spirit to improvements to the function at hand: GENERATE_SERIES.

Quite a while back, I blogged about how much I’d love to have this as a function. We… sort of got it. It doesn’t do dates natively, but you can work around some of that with date functions.

In this post, I want to go over some of the disappointing performance issues I found when testing this function out.

Single Threaded In A Parallel Plan


First up, reading streaming results from the function is single threaded. That isn’t necessarily bad on its own, but can result in annoying performance issues when you have to distribute a large number of rows.

If you have to ask what the purpose or use case for 10 million rows is, it’s your fault that SQL Server doesn’t scale.

Got it? Yours, and yours alone.

DROP TABLE IF EXISTS
    dbo.art_aux;

CREATE TABLE 
    dbo.art_aux
(
    id int NOT NULL PRIMARY KEY CLUSTERED
);

The first way we’re going to try this is with a simple one column table that has a primary key/clustered index on it.

Of course, we won’t expect a parallel insert into the table itself because of that index, but that’s okay. For now.

INSERT INTO
    dbo.art_aux WITH(TABLOCK)
(
    id
)
SELECT
    gs.value
FROM GENERATE_SERIES
     (
         START = 1, 
         STOP = 10000000
     ) AS gs
OPTION(MAXDOP 8);

The query plan for this insert looks about like so:

SQL Server Query Plan
sup with that

I’m only including the plan cost here to compare it to the serial plan later, and to understand the per-operator cost percentage breakdown.

It’s worth noting that the Distribute Streams operator uses Round Robin partitioning to put rows onto threads. That seems an odd choice here, since Round Robin partitioning pushes packets across exchanges.

For a function that produces streaming integers, it would make more sense to use Demand partitioning which only pulls single rows across exchanges. Waiting for Round Robin to fill up packets with integers seems a poor choice, here.

Then we get to the Sort, which Microsoft has promised to fix in a future CTP. Hopefully that happens! But it may not help with the order preserving Gather Streams leading up to the Insert.

SQL Server Query Plan
preservatives

It seems a bit odd ordered data from the Sort would hamstring the Gather Streams operator’s ability to do its thing, but what do I know?

I’m just a bouncer, after all.

But The Serial Plan


Using the same setup, let’s make that plan run at MAXDOP 1.

INSERT INTO
    dbo.art_aux WITH(TABLOCK)
(
    id
)
SELECT
    gs.value
FROM GENERATE_SERIES
     (
         START = 1, 
         STOP = 10000000
     ) AS gs
OPTION(MAXDOP 1);

You might expect this to run substantially slower to generate and insert 10,000,000 rows, but it ends up being nearly three full seconds faster.

Comparing the query cost here (1048.11) vs. the cost of the parallel plan above (418.551), it’s easy to understand why a parallel plan was chosen.

It didn’t work out so well, though, in this case.

SQL Server Query Plan
cereal

With no need to distribute 10,000,000 rows out to 8 threads, sort the data, and then gather the 8 threads back to one while preserving that sorted order, we can rely on the serial sort operator to produce and feed rows in index-order to the table.

Hopefully that will continue to be the case once Microsoft addresses the Sort being present there in the first place. That would knock a second or so off the the overall runtime.

Into A Heap


Taking the index out of the picture and inserting into a heap does two things:

But it also… Well, let’s just see what happens. And talk about it. Query plans need talk therapy, too. I’m their therapist.

DROP TABLE IF EXISTS
    dbo.art_aux;

CREATE TABLE 
    dbo.art_aux
(
    id int NOT NULL
);
SQL Server Query Plan
hmmmmm

The Eager Table Spool here is for halloween protection, I’d wager. Why we need it is a bit of a mystery, since we’re guaranteed to get a unique, ever-increasing series of numbers from the function. On a single thread.

Performance is terrible here because spooling ten million rows is an absolute disaster under any circumstance.

With this challenge in mind, I tried to get a plan here that would go parallel and avoid the spool.

Well, mission accomplished. Sort of.

Crash And Burn


One thing we can do is use SELECT INTO rather than relying on INSERT SELECT WITH (TABLOCK) to do try to get it. There are many restrictions on the latter method.

SELECT
    id = 
        gs.value
INTO dbo.select_into
FROM GENERATE_SERIES
     (
         START = 1, 
         STOP = 10000000
     ) AS gs
OPTION(MAXDOP 8);

This doesn’t make things better:

SQL Server Query Plan
four minutes!

This strategy clearly didn’t work out.

Bummer.

Again, I’d say most of the issue is from Round Robin partitioning on the Distribute Streams.

Finish Him


The initial version of GENERATE_SERIES is a bit rough around the edges, and I hope some of these issues get fixed.

And, like, faster than issues with STRING_SPLIT did, because it took a really long time to get that worked on.

And that was with a dozen or so MVPs griping about it the whole time.

But there’s an even bigger problem with it that we’ll look at tomorrow, where it won’t get lost in all this stuff.

Thanks for reading!

Going Further


If this is the kind of SQL Server stuff you love learning about, you’ll love my training. I’m offering a 75% discount to my blog readers if you click from here. I’m also available for consulting if you just don’t have time for that and need to solve performance problems quickly.