Does SQL Server 2019 Help With Multiple Scalar Function Calls?

Waybad Machine


In yesterday’s post, we looked at a clever way to reduce calls to a scalar UDF using APPLY.

Today, we’re going to see if 2019 changes anything, and if our old trick still tricks.

Because, you know, what else do you do when you need to write 5 blog posts a week?

LOVE YOU!

Don’t Be A Donkey


I’m going to abridge this a little bit, since all the code is referenced at the link up there.

I’m also going to show you some stuff using Plan Explorer.

Why?

Because SSMS kept opening the plan XML as XML, and that makes for crap screenshots.

Here’s the results for the plan with two function references. It runs for ~2.2 seconds.

SQL Server Query Plan
Honesty, at last.

If you remember yesterday’s post (and why wouldn’t you, hm?) the query plans didn’t show us touching other tables at all.

Just seeking into the Users table and then magically computing scalars and filtering.

One of the nice things about scalar UDF inlining: honesty.

But, you know, the two where clause references end up expanding. We’re hitting pretty big tables, here, too.

Apply-ish-ness


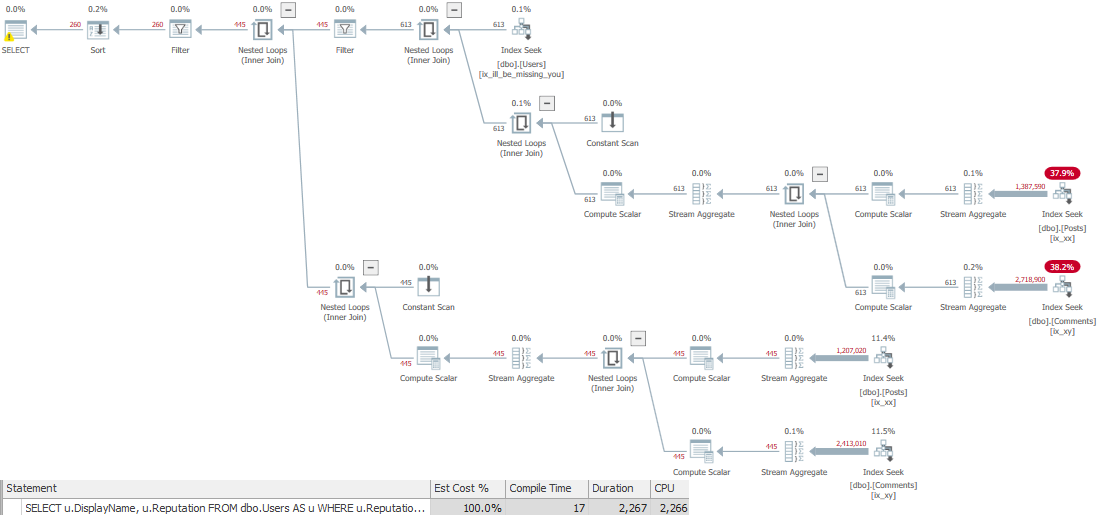
Using APPLY has a similar *ffect here. The function is only referenced and filtered once, and the duration is cut roughly in half.

Now, I know you’re probably thinking, because YOU REMEMBER YESTERDAY’S POST!

SQL Server Query Plan
Ming the Merciless

How come these queries are so much slower with the functions inlined?

Well, they’re not. With query plans turned off, the first one runs in ~900ms, and the second one runs in ~500ms.

Yesterday’s plans run for 1.6s and 600ms respectively with plans turns off.

Apparently observation has overhead. If only there were a clever phrase for that.

Not All Functions


The idea behind FROID is that it removes some restrictions around scalar valued functions.

  1. They can be inlined into the query, not run per-row returned
  2. They don’t force serial execution, so you can get a parallel plan

If your functions already run pretty quickly over a small  number of rows, and the calling query doesn’t qualify for parallelism, you may not see a remarkable speedup.

That’s fine, though, because inlining has other benefits:

  • Query plans are honest about the work they do
  • Measuring the query will show you work that used to be hidden behind the function call(s)

Even if every query doesn’t magically finish before you run it, you’ll see pretty good gains.

Thanks for reading!

Going Further


If this is the kind of SQL Server stuff you love learning about, you’ll love my training. I’m offering a 75% discount to my blog readers if you click from here. I’m also available for consulting if you just don’t have time for that and need to solve performance problems quickly.

A Hidden Value Of Apply With SQL Server Scalar UDFs

Look, Functions Suck


That’s why smart people have been working on making them suck less.

The things I see people doing with them range from “you know there’s a system function that does that” to “oh wow, you wrote an entire program in here”.

I’m not kidding. I once saw a function that was a wrapper for ISNULL that returned the results of ISNULL. I have no idea why.

If I had to think of a DBA prank, writing scalar UDFs that are just wrappers for system functions would be pretty high up there.

Especially if they had the same names as the system functions.

Turning Down The Suck


A while back, Jonathan Kehayias blogged about a way to speed up UDFs that might see NULL input.

Which is great, if your functions see NULL inputs.

But what if… What if they don’t?

And what if they’re in your WHERE clause?

And what if they’re in your WHERE clause multiple times?

Oh my.

Tick, Tick, Tick


Here’s our function.

CREATE FUNCTION dbo.TotalScore(@UserId INT)  
RETURNS BIGINT  
WITH RETURNS NULL ON NULL INPUT, SCHEMABINDING  
AS   
BEGIN    
    DECLARE @TotalScore BIGINT;        
    SELECT @TotalScore =   
    (  
        SELECT ISNULL(SUM(p.Score), 0)  
        FROM dbo.Posts AS p  
        WHERE p.OwnerUserId = @UserId  
    ) +  
    (  
        SELECT ISNULL(SUM(c.Score), 0)  
        FROM dbo.Comments AS c  
        WHERE c.UserId = @UserId  
    )        
    RETURN @TotalScore;    
END
GO

What it does is go out to the Posts and Comments tables and sums up the Score columns for a user.

We’ll use it in our query like this:

SELECT u.DisplayName, 
       u.Reputation
FROM dbo.Users AS u
WHERE u.Reputation >= 100000
AND dbo.TotalScore(u.Id) >= 10000
AND dbo.TotalScore(u.Id) < 20000
ORDER BY u.Id;

We want to find people with a total score between 10 and 20 thousand.

Right on.

When we run the query, the plan looks like this, showing 2 seconds of runtime.

SQL Server Query Plan
Two seconds for 260 rows is kinda wack tho

Tock, Tock, Tock


I know, I know. Get to the point. Make it faster, bouncer-man.

Our goal is to get the function to run fewer times, so we’ll replace multiple calls to it with one call.

SELECT u.DisplayName,
       u.Reputation
FROM dbo.Users AS u
CROSS APPLY
    (
        VALUES (dbo.TotalScore(u.Id))
    ) AS t (Score)
WHERE u.Reputation >= 100000
AND   t.Score >= 10000
AND   t.Score < 20000
ORDER BY u.Id;

Using this technique, the query runs for about 780ms.

SQL Server Query Plan
Check you out.

Tale of the XE


What happens that makes this faster is more evident if we use the XE session from Jonathan’s post for similar reasons, and look at how many times the function was called.

If we look at the activity sequence, it goes up to 1060 for the first query:

SQL Server Extended Events
Moved Out The Hood

And only 615 for the second query:

SQL Server Extended Events
Thinner~

Exeunt


Right now, if we want scalar UDFs to run faster, we can:

  • Tune the underlying query (if there is one)
  • Have them run fewer times
  • Wait for SQL Server 2019

In tomorrow’s post, I’ll look at the same scenario using CTP 3 of SQL Server 2019.

Thanks for reading!

Going Further


If this is the kind of SQL Server stuff you love learning about, you’ll love my training. I’m offering a 75% discount to my blog readers if you click from here. I’m also available for consulting if you just don’t have time for that and need to solve performance problems quickly.

Eager Index Spool Suggestions For SQL Server

Funtime


I’ve added a couple ideas to User Voice.

The ideas are pretty simple:

Eager Index Spools Should Generate Missing Index Requests


In query plans where an Eager Index Spool is directly after a data access operator, a missing index should be generated in the query plan, and/or missing index DMVs that describes the definition of the index needed to make the spool unnecessary.

I would not expect this to happen when a Lazy Index Spool occurs above a subtree.

I’d appreciate it if you’d consider voting for it. It’s something that I was able to implement pretty easily in sp_BlitzCache.

Eager Index Spools Should Generate Wait Stats


In query plans where an Eager Index Spool is directly after a data access operator, wait stats should be generated while the Spool is built. In a parallel plan, EXECSYNC waits are generated, but in a serial plan, you don’t see anything. Problem scenarios will become more common when FROID is released and adopted.

I would not expect this to happen when a Lazy Index Spool occurs above a subtree.

Thanks for reading!

And voting as many times as possible ?

Going Further


If this is the kind of SQL Server stuff you love learning about, you’ll love my training. I’m offering a 75% discount to my blog readers if you click from here. I’m also available for consulting if you just don’t have time for that and need to solve performance problems quickly.

The Coming Froidpocalypse In SQL Server 2019

Legal Notice


I’ve trademarked: Froidrage, Froidulent, and Froidpocalypse.

If you want to use them, you have to pay me $10,000.

Alright, I’m being told by my lawyer that writing them on cocktail napkins and showing them to confused bartenders doesn’t actually register a trademark.

Nevermind.

Here’s What’s Gonna Happen


And it’s not a problem that you need SQL Server 2019 to see. All you have to do is try to rewrite a function.

Here’s our Villain, a scalar UDF.

CREATE FUNCTION dbo.Villain (@UserId INT)
RETURNS INT
WITH SCHEMABINDING, RETURNS NULL ON NULL INPUT
AS	
BEGIN

    DECLARE @Score INT
	SELECT TOP (1)
	         @Score = p.Score
	FROM dbo.Posts AS p
	WHERE p.OwnerUserId = @UserId
	AND   p.PostTypeId = 1
	ORDER BY p.Score DESC;
    
	RETURN @Score;

END
GO

Here’s the query that’s gonna call it:

SELECT      TOP ( 10 )
              u.DisplayName, 
			  u.Reputation, 
			  dbo.Villain(u.Id)
FROM        dbo.Users AS u
ORDER BY    u.Reputation DESC;
GO

I’m Going To Show You Two Things


The estimated plan, and the actual plan.

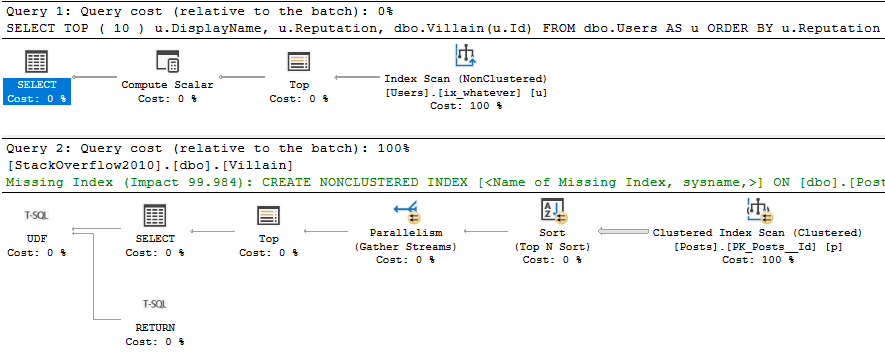
I need to show you the estimated plan so you can see what the function does, because that’s not included in the actual plan.

Yes, the estimated plan is more accurate than the actual plan.

Marinate on that.

SQL Server Query Plan
On The Dancefloor

The important thing is the second plan, which is the function’s execution plan. Notice that it generated a missing index request, and doesn’t spool anything at all.

It handles the query logic with a Top N Sort.

Here’s the actual plan:

SQL Server Query Plan
A NONCLUSTERED INDEX SCAN!!!

Let’s talk about a couple things:

  • A nonclustered index scan that costs 100% and runs for 0.000s
  • A compute scalar that costs 0% and runs for ~3s

The compute scalar thing is well documented by… Well, not by official Microsoft documentation.

But they’ve been blogged about by Cookies Cunningham, and Paul White.

Thanks, you two.

Any Reasonable Person


Would say “I can rewrite that function and make things better”.

Because of course an inline function is always better than a scalar function.

Enter our Hero.

CREATE FUNCTION dbo.Hero (@UserId INT)
RETURNS TABLE
WITH SCHEMABINDING
AS	
RETURN

	SELECT TOP (1)
	         p.Score
	FROM dbo.Posts AS p
	WHERE p.OwnerUserId = @UserId
	AND   p.PostTypeId = 1
	ORDER BY p.Score DESC;

GO

Here’s the query that’s gonna call it:

SELECT      TOP ( 10 )
              u.DisplayName, 
			  u.Reputation, 
			  h.*
FROM        dbo.Users AS u
CROSS APPLY dbo.Hero(u.Id) AS h
ORDER BY    u.Reputation DESC;

I Only Need To Show You One Thing


Since the function is an inline type, the query processor is honest with us about the full query plan.

SQL Server Query Plan
Spiced Ham

Two things happened here:

  • The “function body” no longer goes parallel
  • The TOP (1) is run against an eager index spool rather than the clustered index

What’s The Point?


This is what FROID does for you without a rewrite. It’ll inline the scalar UDF.

The plan may be better, or it may be worse.

The scalar UDF plan ran for 3 seconds, and the inline version ran for almost 13 seconds.

Stay tuned for tomorrow’s post. I have a couple suggestions for how The SQL Server team can help end users stay on top of these problems in SQL Server 2019.

Thanks for reading!

Going Further


If this is the kind of SQL Server stuff you love learning about, you’ll love my training. I’m offering a 75% discount to my blog readers if you click from here. I’m also available for consulting if you just don’t have time for that and need to solve performance problems quickly.

Hey SQL Server Query, What Were You Waiting On?

Surreal Plans


In a parallel plan with an eager index spool, we can observe EXECSYNC waits for the duration of the spool being built.

In a serial plan, we’re not so lucky. There’s no obvious wait that indicates we built an index.

Let’s run a familiar query:

SELECT      TOP ( 10 )
            u.DisplayName, 
			u.Reputation, 
			ca.*
FROM        dbo.Users AS u
CROSS APPLY 
(   
    SELECT   TOP ( 1 )
			   p.Score
    FROM     dbo.Posts AS p
    WHERE    p.OwnerUserId = u.Id
    AND      p.PostTypeId = 1
    ORDER BY p.Score DESC 
) AS ca
ORDER BY    u.Reputation DESC;

The plan is fully serial:

SQL Server Query Plan
Meat Lovers

It’s obvious looking at the actual plan in SSMS 18 what took a long time.

If we’re not so lucky, and we have a cached plan, it would be less obvious:

SQL Server Query Plan
Back Like That

Look how bad scans are! Ha ha ha!

?

What’s A Wait?


If you wanna figure out the runtime, you have to do some math.

SQL Server Wait Stats
What times what?

If you take the SOS_SCHEDULER_YIELD waits and multiply them by 4ms, you can get about accurate runtime (12,444).

We’re lucky on my laptop that our query isn’t competing with other queries for processor time, so there’s not a long queue to get back on a CPU on each yield.

It’s nice to be able to see this while we’re watching a query, but if we come across it in the plan cache, or if we were looking at wait stats, what would we make of the problem?

Surely an operator that’s only 13% of the plan cost couldn’t be responsible for all that.

??

But There We Have It


A query that runs for a non-trivial amount of time, emits common wait stats, and doesn’t ask for an index when it’s creating one.

And that index creation is what makes up for 99% of the execution time.

Thanks for reading!

Going Further


If this is the kind of SQL Server stuff you love learning about, you’ll love my training. I’m offering a 75% discount to my blog readers if you click from here. I’m also available for consulting if you just don’t have time for that and need to solve performance problems quickly.

How Select List Column Sizes Change How Big Spool Operators Are In SQL Server Query Plans

I’ll Use Those Columns Later, Maybe


This is a short post, since we’re on the subject of index spools this week, to show you that the columns that go into the spool will impact spool size and build time.

I know, that sounds obvious, but once in a while I care about “completeness”.

We’re going to look at two queries that build eager index spools, along with the time the spool takes to build and how many writes we do.

Query 1


On the side of the query where a spool gets built (inside the apply), we’re only selecting one column.

SELECT      TOP ( 10 )
            u.DisplayName, 
			u.Reputation, 
			ca.*
FROM        dbo.Users AS u
CROSS APPLY 
(   
    SELECT   TOP ( 1 )
			   p.Score
    FROM     dbo.Posts AS p
    WHERE    p.OwnerUserId = u.Id
    AND      p.PostTypeId = 1
    ORDER BY p.Score DESC 
) AS ca
ORDER BY    u.Reputation DESC;

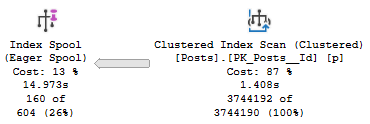
In the query plan, we spend 1.4 seconds reading from the Posts table, and 13.5 seconds building the index spool.

SQL Server Query Plan
Work it

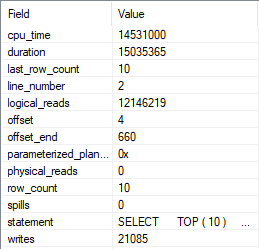
We also do 21,085 writes while building it.

SQL Server Extended Events
Insert comma

Query 2


Now we’re going to select every column in the Posts table, except Body.

If I select Body, SQL Server outsmarts me and doesn’t use a spool. Apparently even spools have morals.

SELECT      TOP ( 10 )
              u.DisplayName, 
			  u.Reputation, 
			ca.*
FROM        dbo.Users AS u
CROSS APPLY 
(   
    SELECT   TOP ( 1 )
               p.Id, p.AcceptedAnswerId, p.AnswerCount, p.ClosedDate, 
               p.CommentCount, p.CommunityOwnedDate, p.CreationDate,
               p.FavoriteCount, p.LastActivityDate, p.LastEditDate,
               p.LastEditorDisplayName, p.LastEditorUserId, p.OwnerUserId, 
               p.ParentId, p.PostTypeId, p.Score, p.Tags, p.Title, p.ViewCount
    FROM     dbo.Posts AS p
    WHERE    p.OwnerUserId = u.Id
    AND      p.PostTypeId = 1
    ORDER BY p.Score DESC 
) AS ca
ORDER BY    u.Reputation DESC;
GO

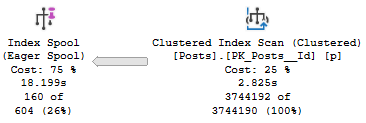
In the query plan, we spend 2.8 seconds reading from the Posts table, and 15.3 seconds building the index spool.

SQL Server Query Plan
Longer

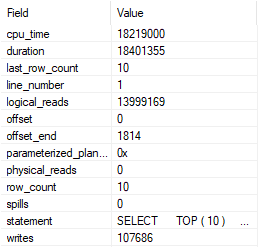
We also do more writes, at 107,686.

SQL Server Extended Events
And more!

This Is Not A Complaint


I just wanted to write this down, because I haven’t seen it written down anywhere else.

Thanks for reading!

Going Further


If this is the kind of SQL Server stuff you love learning about, you’ll love my training. I’m offering a 75% discount to my blog readers if you click from here. I’m also available for consulting if you just don’t have time for that and need to solve performance problems quickly.

Thoughts On Setting MAXDOP Correctly In SQL Server

Microsoft recently published new guidance on setting server level MAXDOP. I hope to help the community by analyzing the new guidance and offering some of my own thoughts on query parallelism.

Line by line


Documentation is meant to be shared after all, so hopefully no one minds if I quote most of it:

Starting with SQL Server 2016 (13.x), during service startup if the Database Engine detects more than eight physical cores per NUMA node or socket at startup, soft-NUMA nodes are created automatically by default. The Database Engine places logical processors from the same physical core into different soft-NUMA nodes.

This is true and one of the bigger benefits of auto soft-NUMA as far as I’ve been able to tell.

The recommendations in the table below are aimed at keeping all the worker threads of a parallel query within the same soft-NUMA node.

SQL Server is not designed to keep all worker threads in a single soft-NUMA node. That might have been true in SQL Server 2008, but it changed in 2012. The only semi-official documentation that I know of is here and I looked into the behavior here. Read through both if you’re interested in how scheduling of parallel worker threads is performed by SQL Server, but I’ll provide a quick summary via example here.

Suppose you have two soft-NUMA nodes of 6 schedulers each and the server just restarted.NUMA node 0 has positions 0-5 and NUMA node 1 has positions 6-11. The global enumerator starts at position 0. If I run a MAXDOP 4 query then the enumerator advances by 4. The parallel workers are allowed in positions 0-3 which means that any four out of six schedulers can be chosen from NUMA node 0. All parallel worker threads are in NUMA node 0 for the first query. Suppose I run another MAXDOP 4 query. The enumerator advances by 4 and the allowed positions are 4-7. That means that any two schedulers can be chosen from NUMA node 0 and any two schedulers can be chosen from NUMA node 1. The worker threads are split over two soft-NUMA nodes even though query MAXDOP is less than the size of the soft-NUMA nodes.

Unless you’re on a server with a single soft-NUMA node it is difficult to guarantee that all worker threads end up on the same soft-NUMA node. I strongly recommend against aiming for that as a goal. There are more details in the “Preventing hard NUMA worker splits” section of this blog post.

This will improve the performance of the queries and distribution of worker threads across the NUMA nodes for the workload. For more information, see Soft-NUMA.

I’ve heard some folks claim that keeping all parallel workers on a single hard NUMA nodes can be important for query performance. I’ve even seen some queries experience reduced performance when thread 0 is on a different hard NUMA node than parallel worker threads. I haven’t heard of anything about the importance of keeping all of a query’s worker threads on a single soft-NUMA node. It doesn’t really make sense to say that query performance will be improved if all worker threads are on the same soft-NUMA node. Soft-NUMA is a configuration setting. Suppose I have a 24 core hard NUMA node and my goal is to get all of a parallel query’s worker threads on a single soft-NUMA node. To accomplish that goal the best strategy is to disable auto soft-NUMA because that will give me a NUMA node size of 24 as opposed to 8. So disabling auto soft-NUMA will increase query performance?

Starting with SQL Server 2016 (13.x), use the following guidelines when you configure the max degree of parallelism server configuration value:

Server with single NUMA node [and] Less than or equal to 8 logical processors: Keep MAXDOP at or below # of logical processors

I don’t understand this guidance at all. If MAXDOP is set to above the number of logical processors then the total number of logical processors is used. This is even mentioned earlier on the same page of documentation. This line is functionally equivalent to “Set MAXDOP to whatever you want”.

Server with single NUMA node [and] Greater than 8 logical processors: Keep MAXDOP at 8

This configuration is only possible with a physical core count between 5 and 8 and with hyperthreading enabled. Setting MAXDOP above the physical core count isn’t recommended by some folks, but I suppose there could be some scenarios where it makes sense. Keeping MAXDOP at 8 isn’t bad advice for many queries on a large enough server, but the documentation is only talking about small servers here.

Server with multiple NUMA nodes [and] Less than or equal to 16 logical processors per NUMA node: Keep MAXDOP at or below # of logical processors per NUMA node

I have never seen an automatic soft-NUMA configuration result in more than 16 schedulers per soft-NUMA node, so this covers all server configurations with more than 8 physical cores. Soft-NUMA scheduler counts per node can range from 4 to 16. If you accept this advice then in some scenarios you’ll need to lower MAXDOP as you increase the number of physical cores per socket. For example, if I have 24 schedulers per socket without hyperthreading then auto soft-NUMA gives me three NUMA nodes of 8 schedulers, so I might set MAXDOP to 8. But if the scheduler count is increased to 25, 26, or 27 then I’ll have at least one soft-NUMA node of 6 schedulers. So I should lower MAXDOP from 8 to 6 because the physical core count of the socket increased?

Server with multiple NUMA nodes [and] Greater than 16 logical processors per NUMA node: Keep MAXDOP at half the number of logical processors per NUMA node with a MAX value of 16

I have never seen an automatic soft-NUMA configuration result in more than 16 schedulers per soft-NUMA node. I believe that this is impossible. At the very least, if it possible I can tell you that it’s rare. This feels like an error in the documentation. Perhaps they were going for some kind of hyperthreading adjustment?

NUMA node in the above table refers to soft-NUMA nodes automatically created by SQL Server 2016 (13.x) and higher versions.

I suspect that this is a mistake and that some “NUMA node” references are supposed to refer to hard NUMA. It’s difficult to tell.

Use these same guidelines when you set the max degree of parallelism option for Resource Governor workload groups.

There are two benefits to using MAXDOP at the Resource Governor workload group level. The first benefit is that it allows different workloads to have different MAXDOP without changing lots of application code. The guidance here doesn’t allow for that benefit. The second benefit is that it acts as a hard limit on query MAXDOP as opposed to the soft limit provided with server level MAXDOP. It may also be useful to know that the query optimizer takes server level MAXDOP into account when creating a plan. It does not do so for MAXDOP set via Resource Governor.

I haven’t seen enough different types of workloads in action to provide generic MAXDOP guidance, but I can share some of the issues that can occur with query parallelism being too low or too high.

What are some of the problems with setting MAXDOP too low?


  1. Better query performance may be achieved with a higher MAXDOP. For example, a well-written MAXDOP 8 query on a quiet server may simply run eight times as quickly as the MAXDOP 1 version. In some scenarios this is highly desired behavior.
  2. There may not be enough concurrent queries to get full value out of the server’s hardware without increasing query MAXDOP. Unused schedulers can be a problem for batch workloads that aim to get a large, fixed amount of work done as quickly as possible.
  3. Row mode bitmap operators associated with hash joins and merge joins only execute in parallel plans. MAXDOP 1 query plans lose out on this optimization.

What are some of the problems with setting MAXDOP too high?


  1. At some point, throwing more and more parallel queries at a server will only slow things down. Imagine adding more and more cars to an already gridlocked traffic situation. Depending on the workload you may not want to have many active workers per scheduler.
  2. It is possible to run out of worker threads with many concurrent parallel queries that have many parallel branches each. For example, a MAXDOP 8 query with 20 branches will ask for 160 parallel workers. When this happens parallel queries can get downgraded all the way to MAXDOP 1.
  3. Row mode exchange operators need to move rows between threads and do not scale well with increased query MAXDOP.
  4. Some types of row mode exchange operators evenly divide work among all parallel worker threads. This can degrade query performance if even one worker thread is on a busy scheduler. Consider a server with 8 schedulers. Scheduler 0 has two active workers and all other schedulers have no workers. Suppose there is 40 seconds of CPU work to do, the query scales with MAXDOP perfectly, and work is evenly distributed to worker threads. A MAXDOP 4 query can be expected to run in 40/4 = 10 seconds since SQL Server is likely to pick four of the seven less busy schedulers. However, a MAXDOP 8 query must put one of the worker threads on scheduler 0. The work on schedulers 1 – 7 will finish in 40/8 = 5 seconds but the worker thread on scheduler 0 has to yield to the other worker threads. It may take 5 * 3 = 15 seconds if CPU is shared evenly, so in this example increasing MAXDOP from 4 to 8 increases query run time from 10 seconds to 15 seconds.
  5. The query memory grant for parallel inserts into columnstore indexes increases with MAXDOP. If MAXDOP is too high then memory pressure can occur during compression and the SELECT part of the query may be starved for memory.
  6. The query memory grant for memory-consuming operators on the inner side of a nested loop is often not increased with MAXDOP even though the operator may execute concurrently once on each worker thread. In some uncommon query patterns, increasing MAXDOP will increase the amount of data spilled to tempdb.
  7. Increasing MAXDOP increases the number of queries that will have parallel workers spread across multiple hard NUMA nodes. If MAXDOP is greater than the number of schedulers in a hard NUMA node then the query is guaranteed to have split workers. This can degrade query performance for some types of queries.
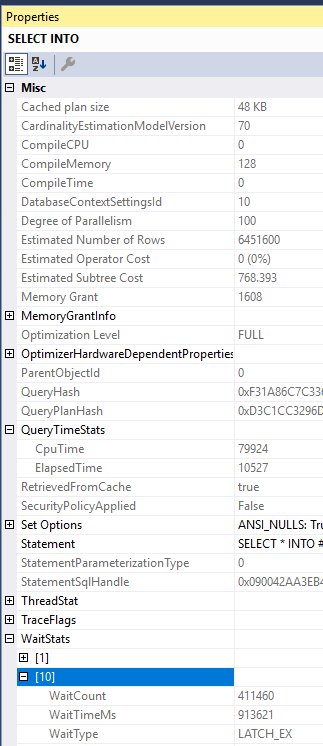
  8. Worker threads may need to wait on some type of shared resource. Increasing MAXDOP can increase contention without improving query performance. For example, there’s nothing stopping me from running a MAXDOP 100 SELECT INTO, but I certainly do not get 100X of the performance of a MAXDOP 1 query. The problem with the below query is the NESTING_TRANSACTION_FULL latch:
SQL Server Query Plan Properties

Preventing hard NUMA worker splits


It generally isn’t possible to prevent worker splits over hard NUMA nodes without changing more than server level and query level MAXDOP. Consider a server with 2 hard NUMA nodes of 10 schedulers for each. To avoid a worker split, an administrator might try setting server level MAXDOP to 10, with the idea being that each parallel query spreads its workers over NUMA node 0 or NUMA node 1. This plan won’t work if any of the following occur:

  • Any query runs with a query level MAXDOP hint other than 0, 1, 10, or 20.
  • Any query is downgraded in MAXDOP but still runs in parallel.
  • A parallel stats update happens. The last time I checked these run with a query level MAXDOP hint of 16.
  • Something else unexpected happens.

In all cases the enumerator will be shifted and any MAXDOP 10 queries that run after will split their workers. TF 2467 can help, but it needs to be carefully tested with the workload. With the trace flag, as long as MAXDOP <= 10 and automatic soft-NUMA is disabled then the parallel workers will be sent to a single NUMA node based on load. Note that execution context 0 thread can still be on a different hard NUMA node. If you want to prevent that then you can try Resource Governor CPU affinity at the Resource Pool level. Create one pool for NUMA node 0 and one pool for NUMA node 1. You may experience interesting consequences when doing that.

The most reliable method by far is to have a single hard NUMA node, so if you have a VM that fits into a single socket of a VM host and you care about performance then ask your friendly VM administrator for some special treatment.

Final thoughts


I acknowledge that it’s difficult to create MAXDOP guidance that works for all scenarios and I hope that Microsoft continues to try to improve their documentation on the subject. Thanks for reading!
Eager Index Spool Annoyances In SQL Server

Don’t Mask Spools


Certain spools in SQL Server can be counterproductive, though well intentioned.

In this case, I don’t mean that “if the spool weren’t there, the query would be faster”.

I mean that… Well, let’s just go look.

Bad Enough Plan Found


Let’s take this query.

SELECT TOP (50) 
    u.DisplayName, 
    u.Reputation, 
    ca.*
FROM dbo.Users AS u
CROSS APPLY 
(
    SELECT TOP (10) 
        p.Id, 
        p.Score, 
        p.Title
    FROM dbo.Posts AS p
    WHERE p.OwnerUserId = u.Id
    AND   p.PostTypeId = 1
    ORDER BY 
        p.Score DESC
) AS ca
ORDER BY 
    u.Reputation DESC;

Top N per group is a common enough need.

If it’s not, don’t tell Itzik. He’ll be heartbroken.

The query plan looks like this:

SQL Server Query Plan
Wig Billy

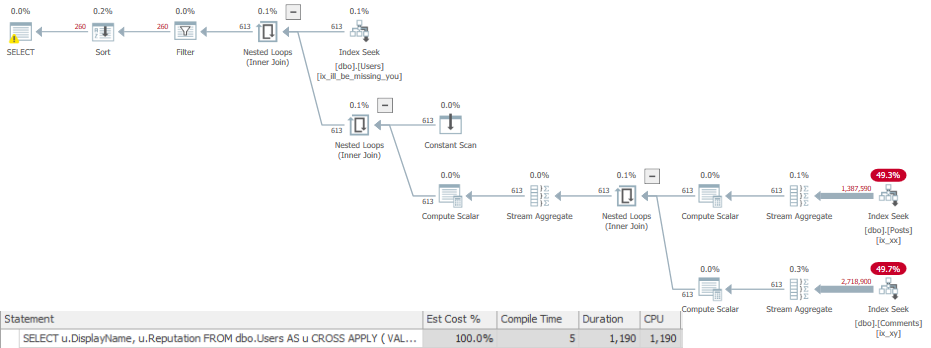
Thanks to the new operator times in SSMS 18, we can see exactly where the chokepoint in this query is.

Building and reading from the eager index spool takes 70 wall clock seconds. Remember that in row mode plans, operator times aggregate across branches, so the 10 seconds on the clustered index scan is included in the index spool time.

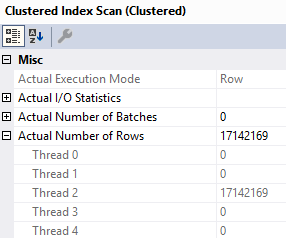
One thing I want to point out is that even though the plan says it’s parallel, the spool is built single threaded.

SQL Server Query Plan Properties
One Sided

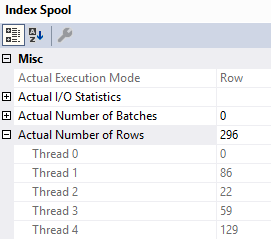
Reading data from the clustered index on the Posts table and putting it into the index is all run on Thread 2.

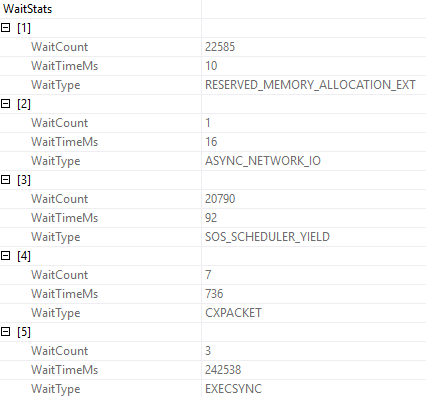
If we look at the wait stats generated by this query, a full 242 seconds are spent on EXECSYNC.

SQL Server Wait Stats In Query Plans
Armless

The math mostly works out, because four threads are waiting on the spool to be built.

Even though the scan of the clustered index is serial, reading from the spool occurs in parallel.

SQL Server Query Plan Properties
Spange

Connected


Eager index spools are built per-query, and discarded afterwards. When built for large tables, they can represent quite a bit of work.

In this example query, a 17 million row index is built, and that’ll happen every single time the query executes.

While I’m all on board with the intent behind the index spool, the execution is pretty brutal. Much of query tuning is situational, but I’ll always pay attention to an index spool (especially because you won’t get a missing index request for them anywhere). You’ll wanna look at the spool definition, and potentially create a permanent index to address the issue.

As for EXECSYNC waits, they can be generated by other things, too. If you’re seeing a lot of them, I’m willing to bet you’ll also find parallel queries with spools in them.

Thanks for reading!
Going Further


If this is the kind of SQL Server stuff you love learning about, you’ll love my training. I’m offering a 75% discount to my blog readers if you click from here. I’m also available for consulting if you just don’t have time for that and need to solve performance problems quickly.

SQL Server 2019: Compatability Level’s Day Of Reckoning

Skin Tags


Stop me if you’ve heard this one:

“We recently upgraded to SQL Server 201(4, 6, 7), and performance is AWFUL…”

And the problem was pretty easily solved by flipping the compatibility level back to 110, which fixed (most) of the issues?

(Or just went back to having the issues they knew that they had before, which is often far less scary.)

In those versions, flipping compatibility level uses the new Cardinality Estimator (CE). That new Cardinality Estimator is real hit or miss.

The worst part is that there’s practically no gain to be realized for using higher compatibility levels — that changes with SQL Server 2019.

Feature Creature


There are two things that are pretty cool in SQL Server 2019: Scalar UDF Inlining (FROID), and Batch Mode for Row Store (BMFRS?).

FROID potentially solves a big problem that’s been plaguing SQL Server users for decades. Scalar UDFs are just straight up performance poison.

This fixes the problems with them (I mean, sure, not every UDF is eligible, and you can run into other problems, but still…).

BMFRS does a bunch of stuff: It makes Batch Mode processing available for Row Store indexes (duh), it also makes Adaptive Joins and Memory Grant Feedback available for them.

Those two things were introduced in 2017, but only available if you used column store (which is what Batch Mode was originally created for).

These things have the potential to fix some very big workload problems for people.

But there’s a thing.

Monkey Paw


In order to use them, you gotta be in compatibility level 150. That also brings along the new CE.

You could be trading one set of problems for another, here. That makes flipping the switch a hard sell.

It all depends on where your biggest problems are, and the time and resources you have to fix regressions.

For most people, it’s not realistic to test their entire workload. You can test your most important queries, as long as they’re reliable.

This is a good place to plug Workload Tools by Gianluca Sartori, which can make this easier.

You can also flip the switch during a low usage time and see if monitoring freaks out.

If it doesn’t, great. If it does, you have a lot of work to do.

Of course, if you’re on SQL Server Standard Edition, this might not matter. As of this writing, I have no idea if these two features will be available there.

Whack-A-Query


The addition of these two features is pretty neat. I’m excited for them.

I’m also very interested to see how customers react, both from the point of view of adopting SQL Server 2019, and adopting compatibility level 150.

I bet a lot of people are gonna want UDF inlining without having to buy the cow.

Thanks for reading!
Going Further


If this is the kind of SQL Server stuff you love learning about, you’ll love my training. I’m offering a 75% discount to my blog readers if you click from here. I’m also available for consulting if you just don’t have time for that and need to solve performance problems quickly.

Live SQL Server Q&A!

ICYMI


Last week’s thrilling, stunning, flawless episode of whatever-you-wanna-call-it.

Thanks for watching!

Going Further


If this is the kind of SQL Server stuff you love learning about, you’ll love my training. I’m offering a 75% discount to my blog readers if you click from here. I’m also available for consulting if you just don’t have time for that and need to solve performance problems quickly.