Make sure you’re looking at the latest and greatest.
Cloudness
The Cloud is basically an AirBnB for your server. Again, that’s cool.
They’re still VMs.
But the point is: pay close attention to how cloud VMs are set up for SQL server.
They’re not doing any of the stuff I listed up there.
Sure, storage and networking still kinda sucks, even if you pay for the good stuff.
But no one puts out the nice linens for strangers.
The point here is that they want you to complain as little as possible for the price.
Part of that is not goofing up the obvious stuff.
Thanks for reading!
Going Further
If this is the kind of SQL Server stuff you love learning about, you’ll love my training. I’m offering a 75% discount to my blog readers if you click from here. I’m also available for consulting if you just don’t have time for that and need to solve performance problems quickly.
After a while tuning a query, sometimes it’s fun to mess with the DOP it’s run at to see how things change.
I wouldn’t consider this a query tuning technique, more like a point of interest.
For a long time, when I’d look at a serial plan, and then a parallel plan for a query, the shape would be the same.
But that’s not always true.
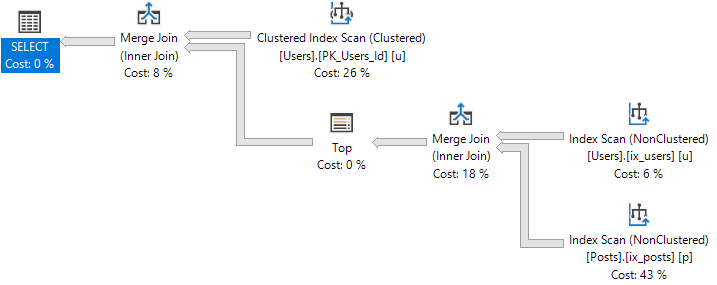
DOP 1
At DOP 1, the plan looks like this:
Mergey-Toppy
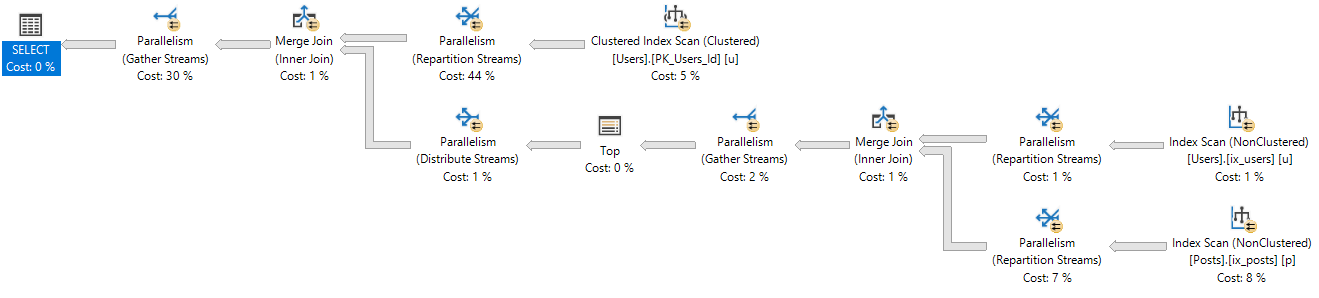
DOP 2
At DOP 2, the plan looks like this:
Tutu
Mo’ DOP
At DOP 3-8, the plan looks like this:
Shapewear
No DOP
The DOP 2 plan has a significantly different shape than the serial, or more parallel plans.
It also chooses different types of joins.
Of course, we can use a merge join hint to have it pick the same plan as higher DOPs, but where’s the fun in that?
Anyway, the reason I found this interesting is because I always thought the general optimization process was:
Come up with a serial plan
If the plan cost is > CTFP, look at the parallel version of the serial plan
If the parallel version is cheaper, go with it
Though it appears like there’s an extra step where the optimizer considers multiple parallel alternatives to the serial plan, and not just the parallel version of the serial plan.
The process is closer to:
Come up with a serial plan
If the plan cost is > CTFP, create a *NEW* plan using parallelism
If the parallel version is cheaper, go with it
In many cases, the *NEW* plan will be the “same” as the serial plan, just using parallelism. The optimizer is a creature of habit, and applies the same rules and transformations.
Thanks for reading!
Going Further
If this is the kind of SQL Server stuff you love learning about, you’ll love my training. I’m offering a 75% discount to my blog readers if you click from here. I’m also available for consulting if you just don’t have time for that and need to solve performance problems quickly.
Parameter sniffing gets blamed for a lot of things, and, well, sometimes it is parameter sniffing.
It’s probably not parameter sniffing if:
You use local variables
You use optimize for unknown
You’re recompiling anyway
ButWhatAbout
While working with a client recently, they were absolutely sure they had a parameter sniffing issue.
The general proof given was that as the day went on, queries got slower and slower.
The next day, they’d magically be fast again, and then the same slowdown would happen.
When we looked at the stored procedures in question, it looked like they might be right.
So I set up a test.
Pile and Recompile
We stuck a recompile hint on a stored procedure that people are always complaining about, and watched the runtime throughout the day.
Sure enough, it got slower and slower, but not because it got a bad plan. The server just got busier and busier.
6am: 2 seconds
7am: 6 seconds
8am: 15 seconds
9am: 20 seconds
10am: 30 seconds
I left out some details, and I’m sorry about that. You probably want the last 2 minutes of your life back.
Get in line.
Missing Persons
This poor server had hundreds of database totaling almost 4TB.
With 96 GB of RAM, and 4 cores, there was no good way for it to support many user requests.
When things got slow, two wait stats would tick up: PAGEIOLATCH_SH, and SOS_SCHEDULER_YIELD.
SQL Server had a hard time keeping the data people needed in memory, and it got really busy trying to make sure every query got a fair amount of CPU time.
In this case, it wasn’t parameter sniffing, it was server exhaustion.
Last Farewell
Wait stats aren’t always helpful, but they can help you with investigations.
This kind of resource contention won’t always be the issue, of course.
But when you’re investigating performance issues, it’s important to know what things look like when the server is running well, and what things look like when the’re not.
That includes
Wait stats
Query plans
Overall workload
Blocking
Thanks for reading!
Going Further
If this is the kind of SQL Server stuff you love learning about, you’ll love my training. I’m offering a 75% discount to my blog readers if you click from here. I’m also available for consulting if you just don’t have time for that and need to solve performance problems quickly.
Back when I first wrote sp_BlitzQueryStore, I was totally enamored with Query Store.
Like the plan cache, but better. History. Different plans for the same query. Not disturbed by memory pressure or restarts.
Then I waited patiently to find a client on 2016 using it.
And waited, and waited, and waited.
And finally, some came along.
Slow Pokes And No Pokes
When I ran it, it took forever. Not even the XML part. The XML part was fast.
Gathering the initial set of data was slow.
With some time to experiment and dig in, I found that the IN_MEM tables cause significant performance issues when:
Query Store is actively logging data
Query Store is > 25 MB or so
Yes, children, in memory tables can be slow, too.
The Problem
Let’s take a couple simple queries against Query Store tables:
SELECT TOP 10 *
FROM sys.query_store_runtime_stats AS qsrs
WHERE qsrs.avg_cpu_time >= 500000
AND   qsrs.last_execution_time >= DATEADD(DAY, -1, GETDATE())
ORDER BY qsrs.avg_cpu_time DESC;

SELECT TOP 10 *
FROM sys.query_store_plan AS qsp
WHERE qsp.query_plan IS NOT NULL
AND   qsp.last_execution_time >= DATEADD(DAY, -1, GETDATE())
ORDER BY qsp.last_execution_time DESC;
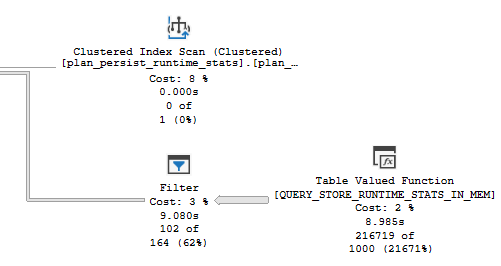
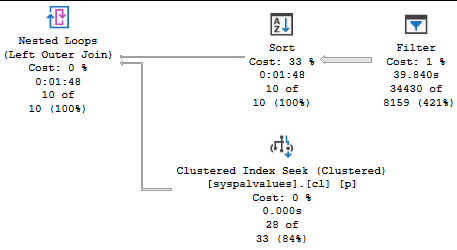
The first query runs for 10 seconds, with the entirety of the time spent filtering data out of the IN_MEM table:
Ho hum.
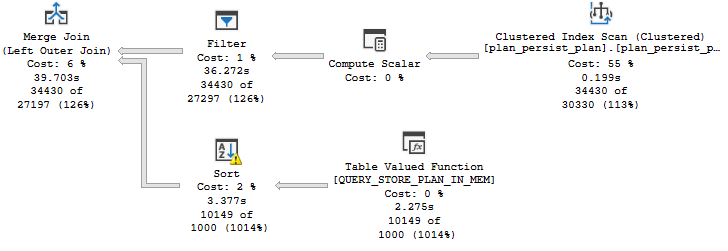
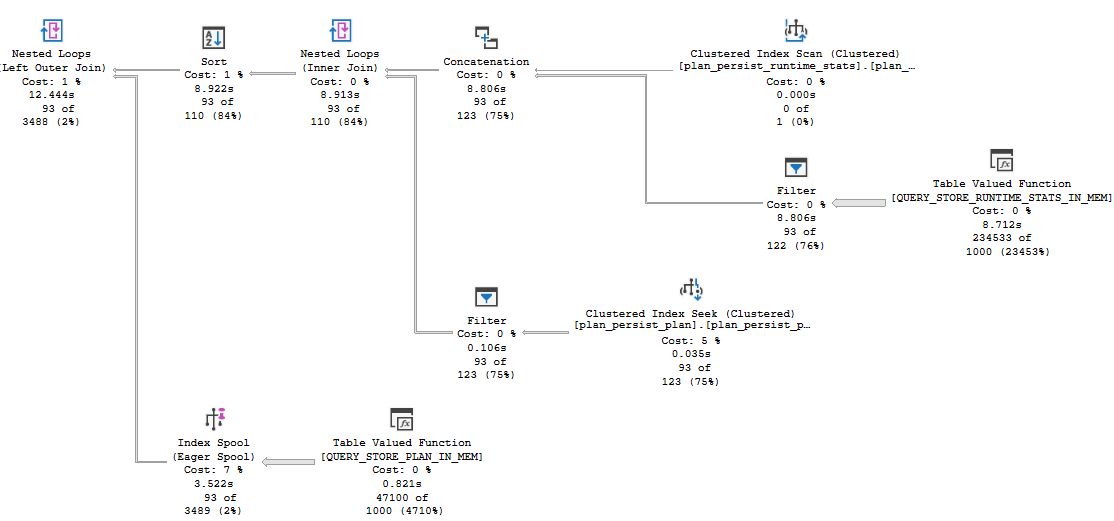
The second query is even worse, at nearly 2 minutes:
Filtering on the 1Fingerling on the floor
“Unrealistic”
I know, this configuration is probably unsupported because I used SELECT * or something.
I wrote this query hoping to quickly get the worst plans by a specific metric.
WITH the_pits
    AS
     (
         SELECT   TOP ( 101 )
                  qsrs.plan_id,
                  qsp.query_id,
                  qsrs.avg_duration / 100000. AS avg_duration_s,
                  qsrs.avg_cpu_time / 100000. AS avg_cpu_time_s,
                  qsrs.avg_query_max_used_memory,
                  qsrs.avg_logical_io_reads,
                  qsrs.avg_logical_io_writes,
                  qsrs.avg_tempdb_space_used,
                  qsrs.last_execution_time,
                  /*
                  You can stick any of the above metrics in here to
                  find offenders by different resource abuse
                  */
                  MAX(qsrs.avg_cpu_time) OVER
                  (
                      PARTITION BY
                          qsp.query_id
                      ORDER BY
                          qsp.query_id
                      ROWS UNBOUNDED PRECEDING
                  ) AS n
         FROM     sys.query_store_runtime_stats AS qsrs
         JOIN     sys.query_store_plan AS qsp
             ON qsp.plan_id = qsrs.plan_id
         WHERE    qsrs.avg_duration >= ( 5000. * 1000. )
         AND      qsrs.avg_cpu_time >= ( 1000. * 1000. )
         AND      qsrs.last_execution_time >= DATEADD(DAY, -7, GETDATE())
         AND      qsp.query_plan IS NOT NULL
         /*
         Don't forget to change this to same thing!
         */
         ORDER BY qsrs.avg_cpu_time DESC
     )
SELECT   p.plan_id,
         p.query_id,
         p.avg_duration_s,
         p.avg_cpu_time_s,
         p.avg_query_max_used_memory,
         p.avg_logical_io_reads,
         p.avg_logical_io_writes,
         p.avg_tempdb_space_used,
         p.last_execution_time,
         qsqt.query_sql_text,
         TRY_CONVERT(XML, qsp.query_plan) AS query_plan
FROM     sys.query_store_plan AS qsp
JOIN     the_pits AS p
    ON p.plan_id = qsp.plan_id
JOIN     sys.query_store_query AS qsq
    ON qsq.query_id = qsp.query_id
JOIN     sys.query_store_query_text AS qsqt
    ON qsq.query_text_id = qsqt.query_text_id
ORDER BY p.n DESC;
It works pretty well. Sometimes.
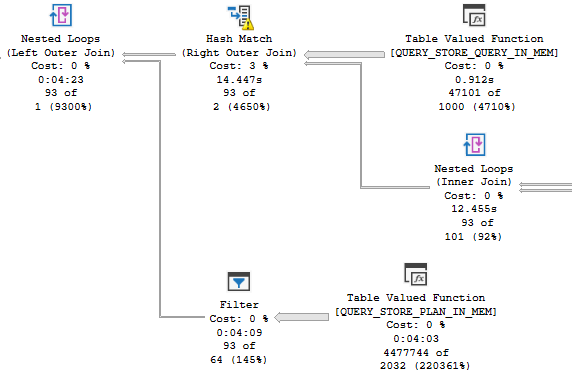
Other times, it runs for 4.5 minutes.
I know what you’re thinking: “Erik, you’re doing all sorts of crazy stuff in there. You’re making it slow.”
But none of the crazy stuff I’m doing is where the slowdown is.
It’s all in the same stuff I pointed out in the simpler queries.
12.5 seconds…FOUR MINUTES
Testing, testing
I can’t stress how much I want Query Store to be successful. I absolutely love the idea.
But it just wasn’t implemented very well. Simple filtering against the data takes forever.
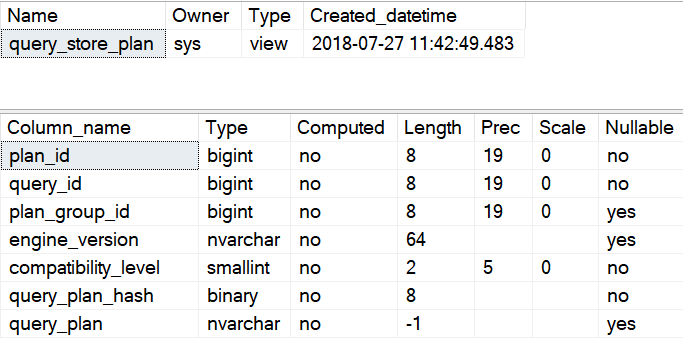
And yes, you can have NULL query plans for some reason. That’s rich.
The irony of needing to tune queries so you can find queries to tune is ironic.
I’m nearly sure of it.
Thanks for reading!
Going Further
If this is the kind of SQL Server stuff you love learning about, you’ll love my training. I’m offering a 75% discount to my blog readers if you click from here. I’m also available for consulting if you just don’t have time for that and need to solve performance problems quickly.
I mean ever really wondered just how long a query of yours waited on stats to automatically update before running?
Have you ever been absolutely, positively sure that those gosh dang darn stats updates were putting your query on the trolley to Slowsville?
Your wishes will be 100% granted in SQL Server 2019.
Now, this wait doesn’t show up when stats are created the first time.
So if you run a query with a where clause on a column that doesn’t already have stats, the initial gather won’t show.
This is only for updates. Not creates.
Got it?
In Action
The following script will take the Votes table, and make a copy of it called Vetos.
Then it’ll create a PK/CX (for some reason?), and run a query against a couple columns that are mostly NULL.
Voting data gets cleaned out of the SO data dump.
SELECT ISNULL(Id, 0) AS Id,
       PostId,
       UserId,
       BountyAmount,
       VoteTypeId,
       CreationDate
INTO dbo.Vetos
FROM dbo.Votes;

ALTER TABLE dbo.Vetos
 ADD CONSTRAINT PK_Vetos_Id
    PRIMARY KEY CLUSTERED(Id);

SELECT TOP 10 *
FROM dbo.Vetos
WHERE UserId > 0
AND BountyAmount > 0;
The last query is important because it generates the initial stats on both of those columns.
Now let’s put some work into it!
UPDATE v
SET v.BountyAmount = 50000
FROM dbo.Vetos AS v
WHERE v.BountyAmount IS NULL;

UPDATE v
SET v.UserId = v.VoteTypeId
FROM dbo.Vetos AS v
WHERE v.UserId IS NULL;
This table has 52,928,720 rows in it. Not the biggest, but a decent size to maybe have to wait on stats to update.
Ready Steady
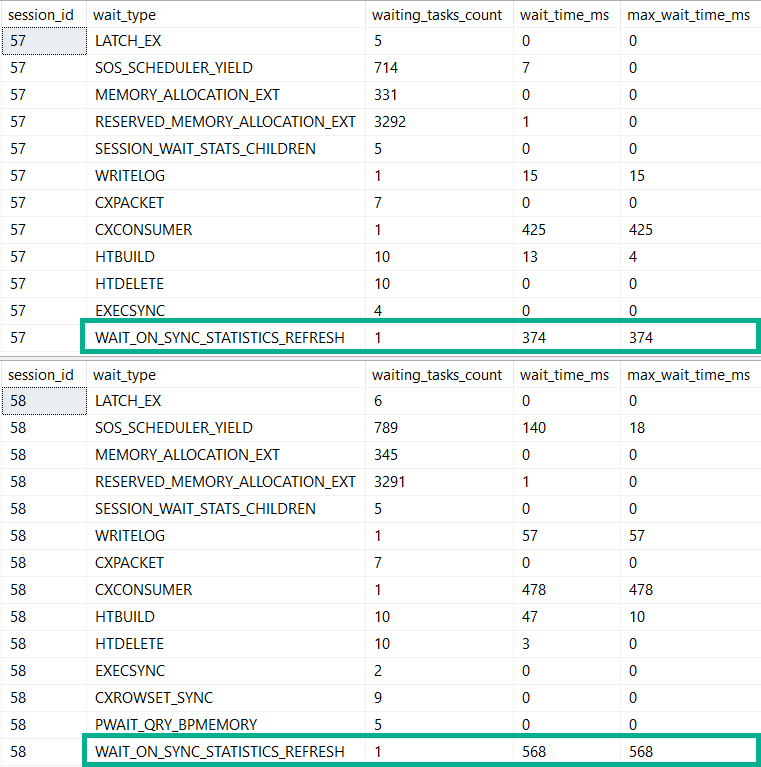
In separate windows, I’ll run these:
SELECT COUNT(*) AS records
FROM dbo.Vetos AS v
WHERE v.BountyAmount > 500;

SELECT COUNT(*) AS records
FROM dbo.Vetos AS v
WHERE v.UserId < 16;
So there you have it. 52 million row stats refreshes take about half a second.
That wasn’t very exciting. Let’s try something else.
Tricks, Kids
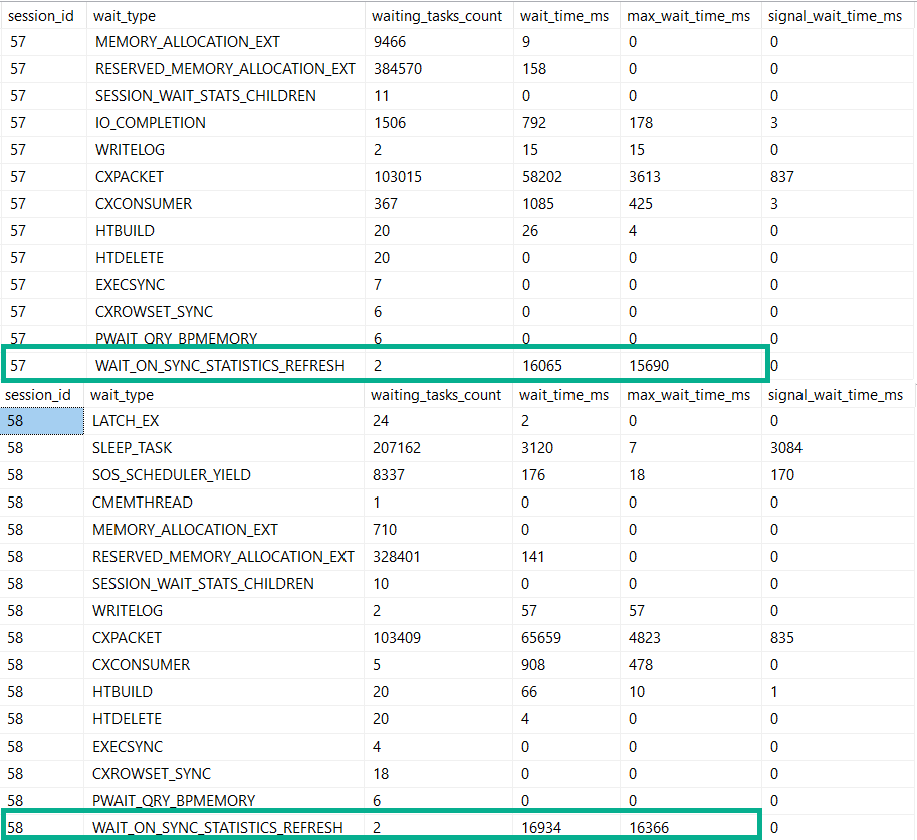
If we start from scratch, but instead of letting SQL Server create stats automatically by running a query, let’s create statistics with some funny options, and then update the columns.
CREATE STATISTICS s_b ON dbo.Vetos(BountyAmount)
WITH FULLSCAN, PERSIST_SAMPLE_PERCENT = ON;

CREATE STATISTICS s_u ON dbo.Vetos(UserId)
WITH FULLSCAN, PERSIST_SAMPLE_PERCENT = ON;
Now, when we run our select queries, things really slow down.
Sunny
Quite a bit longer on those.
Actionable?
What would one do if they encountered 15-16 waits on this in real life?
Well, you have some options.
Update stats asynchronously
Create stats with no recompute and handle stats updates yourself
Update statistics more often than you currently do, trying to stay ahead of automatic updates
It’s hard to see this being a really big issue outside of very large tables, and perhaps only on under-powered servers.
Or if someone created statistics with some rather impolite settings.
Thanks for reading!
Going Further
If this is the kind of SQL Server stuff you love learning about, you’ll love my training. I’m offering a 75% discount to my blog readers if you click from here. I’m also available for consulting if you just don’t have time for that and need to solve performance problems quickly.
It’s a matter of how and what, and when data gets logged for them, not a matter of tool quality.
I’d love to see a more complete picture of these things when trying to diagnose or troubleshoot issues.
Thanks for reading!
Going Further
If this is the kind of SQL Server stuff you love learning about, you’ll love my training. I’m offering a 75% discount to my blog readers if you click from here. I’m also available for consulting if you just don’t have time for that and need to solve performance problems quickly.
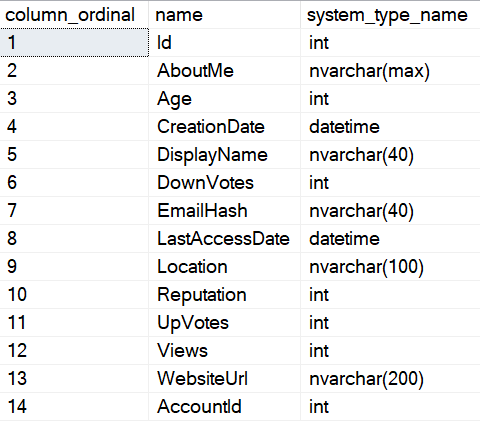
People mainly use it for stored procedures (I think?), but it can also work like this:
DECLARE @sql1 NVARCHAR(MAX) = N'SELECT TOP 10 * FROM dbo.Users AS u WHERE u.Reputation > @i';
DECLARE @sql2 NVARCHAR(MAX) = N'SELECT TOP 10 * FROM dbo.Posts AS p WHERE p.Score > @i';

SELECT column_ordinal, name, system_type_name
FROM   sys.dm_exec_describe_first_result_set(@sql1, NULL, 0);

SELECT column_ordinal, name, system_type_name
FROM   sys.dm_exec_describe_first_result_set(@sql2, NULL, 0);
The results for the Users table look like this:
For you must
Don’t Judge Me
The best way I’ve found to do this is to use that output to generate an ALTER TABLE to add the correct columns and data types.
Here’s a dummy stored procedure that does it:
CREATE OR ALTER PROCEDURE dbo.dynamic_temp ( @TableName NVARCHAR(128))
AS
    BEGIN
        SET NOCOUNT ON;

        CREATE TABLE #t ( Id INT );
        DECLARE @sql NVARCHAR(MAX) = N'';

        IF @TableName = N'Users'
            BEGIN
                SET @sql = @sql + N'SELECT TOP 10 * FROM dbo.Users AS u WHERE u.Reputation > @i';
            END;

        IF @TableName = N'Posts'
            BEGIN
                SET @sql = @sql + N'SELECT TOP 10 * FROM dbo.Posts AS p WHERE p.Score > @i';
            END;

        SELECT   column_ordinal, name, system_type_name
        INTO     #dfr
        FROM     sys.dm_exec_describe_first_result_set(@sql, NULL, 0)
        ORDER BY column_ordinal;

        DECLARE @alter NVARCHAR(MAX) = N'ALTER TABLE #t ADD ';

        SET @alter += STUFF((   SELECT   NCHAR(10) + d.name + N' ' + d.system_type_name + N','
                                FROM     #dfr AS d
                                WHERE    d.name <> N'Id'
                                ORDER BY d.column_ordinal
                                FOR XML PATH(N''), TYPE ).value(N'.[1]', N'NVARCHAR(4000)'), 1, 1, N'');

        SET @alter = LEFT(@alter, LEN(@alter) - 1);

        EXEC ( @alter );

        INSERT #t
        EXEC sys.sp_executesql @sql, N'@i INT', @i = 10000;

        SELECT *
        FROM   #t;

    END;
GO
I can execute it for either Users or Posts, and get back the results I want.
So yeah, this is generally a pretty weird requirement.
It might even qualify as Bad Idea Spandex™
Thanks for reading!
Going Further
If this is the kind of SQL Server stuff you love learning about, you’ll love my training. I’m offering a 75% discount to my blog readers if you click from here. I’m also available for consulting if you just don’t have time for that and need to solve performance problems quickly.
A lot of people still expect odd things from CTEs.
Performance fences
Cached results
There’s no clue in how they’re written that you won’t get those.
I’ve gone back and forth on whether or not this would be worthwhile. It totally could be, but it’d have to be pretty thoughtful.
Materialization vs. Fencing
The difference here is subtle but necessary. Right now, people will use TOP, which sets a row goal, and provides some logical isolation of the query in your CTE.
The problem remains that if that CTE is referenced via join > 1 time, the internal syntax is re-run each time.
Even if your query is fenced off, it is not materialized.
Fencing could leverage existing NOEXPAND hints, but materialization would likely require a new hint that performed the equivalent of SELECT… INTO #t, and then replaced references to the CTE alias with a pointer to the temporary object.
Indexing
One appeal of temp tables is that there is additional indexing flexibility, so any syntax would have to allow existing inline index syntax of temp tables to be used.
In other words, an index that may not make sense on a real table given your existing workload might make sense on a temp table. Or like, if a temp table is the result of joining two tables together, there could be a compound index you could create on the temp table that’s otherwise impossible to create.
Next feature request: multi-table indexes ?
Thanks for reading!
Going Further
If this is the kind of SQL Server stuff you love learning about, you’ll love my training. I’m offering a 75% discount to my blog readers if you click from here. I’m also available for consulting if you just don’t have time for that and need to solve performance problems quickly.
Often when query tuning, I’ll try a change that I think makes sense, only to have it backfire.
It’s not that the query got slower, it’s that the results that came back were wrong different.
Now, this can totally happen because of a bug in previously used logic, but that’s somewhat rare.
And wrong different results make testers nervous. Especially in production.
Here’s a Very Cheeky™ example.
Spread’em
This is my starting query. If I run it enough times, I’ll get a billion missing index requests.
WITH topusers AS
(
    SELECT   TOP (1)
             u.Id, u.DisplayName
    FROM     dbo.Users AS u
    ORDER BY u.Reputation DESC
)
SELECT   u.Id,
         u.DisplayName,
         SUM(p.Score * 1.0) AS PostScore,
         SUM(c.Score * 1.0) AS CommentScore,
         COUNT_BIG(*) AS CountForSomeReason
FROM     topusers AS u
JOIN     dbo.Posts AS p
    ON p.OwnerUserId = u.Id
JOIN     dbo.Comments AS c
    ON c.UserId = u.Id
WHERE    p.Score >= 5
AND      c.Score >= 1
GROUP BY u.Id, u.DisplayName;
For the sake of argument, I’ll add them all. Here they are:
CREATE INDEX ix_tabs
    ON dbo.Users ( Reputation DESC, Id )
    INCLUDE ( DisplayName );

CREATE INDEX ix_spaces
    ON dbo.Users ( Id, Reputation DESC )
    INCLUDE ( DisplayName );

CREATE INDEX ix_coke
    ON dbo.Comments ( Score) INCLUDE( UserId );

CREATE INDEX ix_pepsi
    ON dbo.Posts ( Score ) INCLUDE( OwnerUserId );

CREATE NONCLUSTERED INDEX ix_tastes_great
    ON dbo.Posts ( OwnerUserId, Score );

CREATE NONCLUSTERED INDEX ix_less_filling
    ON dbo.Comments ( UserId, Score );
With all those indexes, the query is still dog slow.
Maybe It’s Me
I’ll take my own advice. Let’s break the query up a little bit.
DROP TABLE IF EXISTS #topusers;

WITH topusers AS
(
    SELECT   TOP (1)
             u.Id, u.DisplayName
    FROM     dbo.Users AS u
    ORDER BY u.Reputation DESC
)
SELECT *
INTO #topusers
FROM topusers;

CREATE UNIQUE CLUSTERED INDEX ix_whatever
    ON #topusers(Id);

SELECT   u.Id,
         u.DisplayName,
         SUM(p.Score * 1.0) AS PostScore,
         SUM(c.Score * 1.0) AS CommentScore,
         COUNT_BIG(*) AS CountForSomeReason
FROM     #topusers AS u
JOIN     dbo.Posts AS p
    ON p.OwnerUserId = u.Id
JOIN     dbo.Comments AS c
    ON c.UserId = u.Id
WHERE    p.Score >= 5
AND      c.Score >= 1
GROUP BY u.Id, u.DisplayName;
Still dog slow.
Variability
Alright, I’m desperate now. Let’s try this.
DECLARE @Id INT,
        @DisplayName NVARCHAR(40);

SELECT   TOP (1)
            @Id = u.Id,
		    @DisplayName = u.DisplayName
FROM     dbo.Users AS u
ORDER BY u.Reputation DESC;


SELECT   @Id AS Id,
         @DisplayName AS DisplayName,
         SUM(p.Score * 1.0) AS PostScore,
         SUM(c.Score * 1.0) AS CommentScore,
         COUNT_BIG(*) AS CountForSomeReason
FROM dbo.Posts AS p
JOIN  dbo.Comments AS c
    ON c.UserId = p.OwnerUserId
WHERE    p.Score >= 5
AND      c.Score >= 1
AND      (c.UserId = @Id OR @Id IS NULL)
AND      (p.OwnerUserId = @Id OR @Id IS NULL);
Let’s get some worst practices involved. That always goes well.
Except here.
Getting the right results seemed like it was destined to be slow.
Differently Resulted
At this point, I tried several rewrites that were fast, but wrong.
What I had missed, and what Joe Obbish pointed out to me, is that I needed a cross join and some math to make it all work out.
WITH topusers AS
(
SELECT TOP (1)
u.Id, u.DisplayName
FROM dbo.Users AS u
ORDER BY u.Reputation DESC
)
SELECT t.Id AS Id,
t.DisplayName AS DisplayName,
p_u.PostScoreSub * c_u.CountCSub AS PostScore,
c_u.CommentScoreSub * p_u.CountPSub AS CommentScore,
c_u.CountCSub * p_u.CountPSub AS CountForSomeReason
FROM topusers AS t
JOIN ( SELECT p.OwnerUserId,
SUM(p.Score * 1.0) AS PostScoreSub,
COUNT_BIG(*) AS CountPSub
FROM dbo.Posts AS p
WHERE p.Score >= 5
GROUP BY p.OwnerUserId ) AS p_u
ON p_u.OwnerUserId = t.Id
CROSS JOIN ( SELECT c.UserId, SUM(c.Score * 1.0) AS CommentScoreSub, COUNT_BIG(*) AS CountCSub
FROM dbo.Comments AS c
WHERE c.Score >= 1
GROUP BY c.UserId ) AS c_u
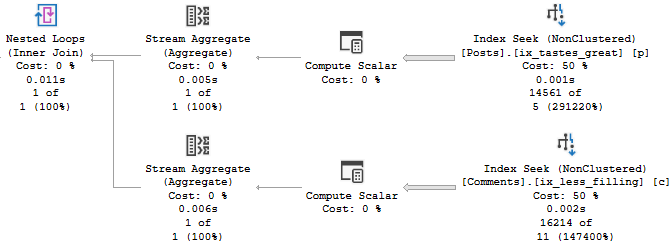
WHERE c_u.UserId = t.Id;
This finishes instantly, with the correct results.
The value of a college education!
Realizations and Slowness
After thinking about Joe’s rewrite, I had a terrible thought.
All the rewrites that were correct but slow had gone parallel.
“Parallel”
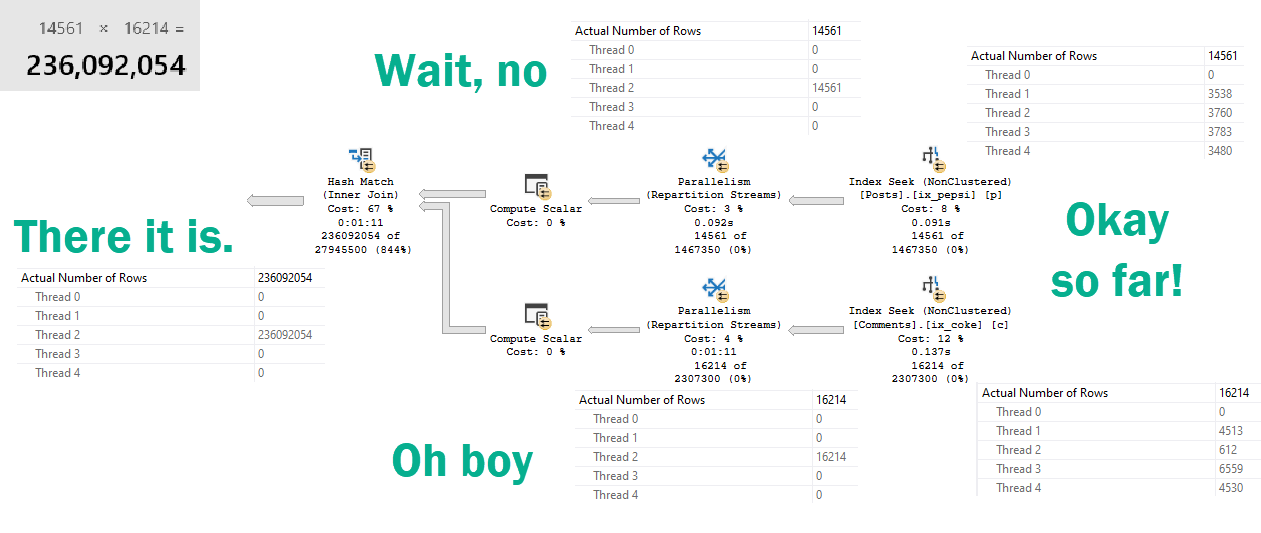
Allow me to illustrate.
In a row?
Repartition Streams usually does the opposite.
But here, it puts all the rows on a single thread.
“For correctness”
Which ends up in a 236 million row parallel-but-single-threaded-cross-hash-join.
SQL Server uses the correct join (inner or outer) and adds projections where necessary to honour all the semantics of the original query when performing internal translations between apply and join.
The differences in the plans can all be explained by the different semantics of aggregates with and without a group by clause in SQL Server.
What’s amazing and frustrating about the optimizer is that it considers all sorts of different ways to rewrite your query.
In milliseconds.
It may have even thought about a plan that would have been very fast.
But we ended up with this one, because it looked cheap.
Untuneable
The plan for Joe’s version of the query is amazingly simple.
Bruddah.
Sometimes giving the optimizer a different query to work with helps, and sometimes it doesn’t.
Rewriting queries is tough business. When you change things and still get the same plan, it can be really frustrating.
Just know that behind the scenes the optimizer is working hard to rewrite your queries, too.
If you really want to change the execution plan you end up with, you need to present the logic to the optimizer in different ways, and often with different indexes to use.
Other times, you just gotta ask Joe.
Thanks for reading!
Going Further
If this is the kind of SQL Server stuff you love learning about, you’ll love my training. I’m offering a 75% discount to my blog readers if you click from here. I’m also available for consulting if you just don’t have time for that and need to solve performance problems quickly.
In SQL Server 2019, a few cool performance features under the intelligent query processing umbrella depend on cardinality estimation.
Batch Mode For Row Store (which triggers the next two things)
Adaptive Joins
Memory Grant Feedback
If SQL Server doesn’t estimate > 130k(ish) rows are gonna hop on through your query, you don’t get the Batch Mode processing that allows for Adaptive Joins and Memory Grant feedback. If you were planning on those things helping with parameter sniffing, you now have something else to contend with.
Heft
Sometimes you might get a plan with all that stuff in it. Sometimes you might not.
The difference between a big plan and little plan just got even more confusing.
Let’s say you have a stored procedure that looks like this:
CREATE OR ALTER PROCEDURE dbo.lemons(@PostTypeId INT)
AS
BEGIN

    SELECT OwnerUserId,
	       PostTypeId,
		   SUM(Score * 1.0) AS TotalScore,
		   COUNT_BIG(*) AS TotalPosts
	FROM dbo.Posts AS p
	JOIN dbo.Users AS u
	    ON p.OwnerUserId = u.Id
	WHERE PostTypeId = @PostTypeId
	AND u.Reputation > 1
	GROUP BY OwnerUserId,
             PostTypeId
	HAVING COUNT_BIG(*) > 100;

END
GO
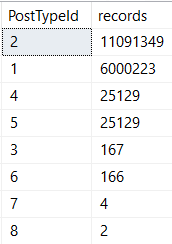
There’s quite a bit of skew between post types!
Working my way down
Which means different parameters will get different plans, depending on which one comes first.
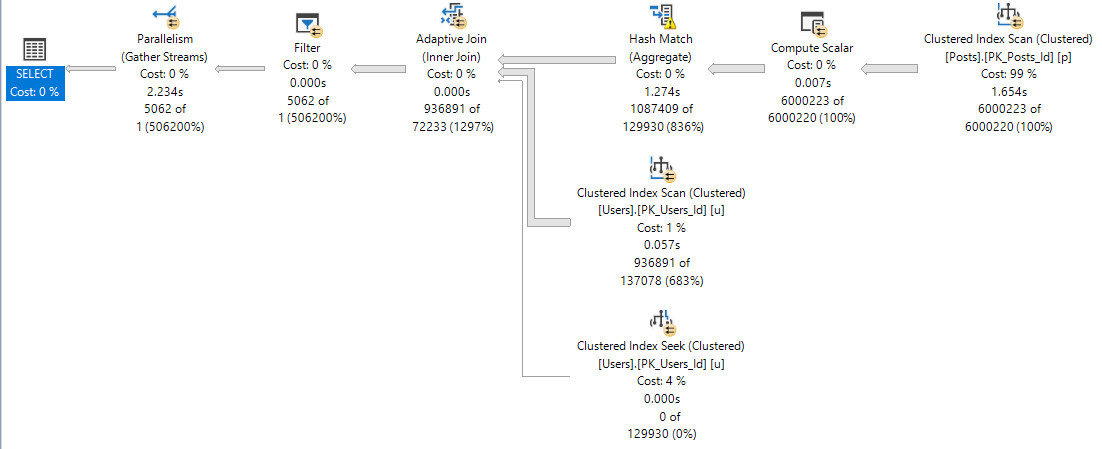
At 12 seconds, one might accuse our query of sub-par performance.
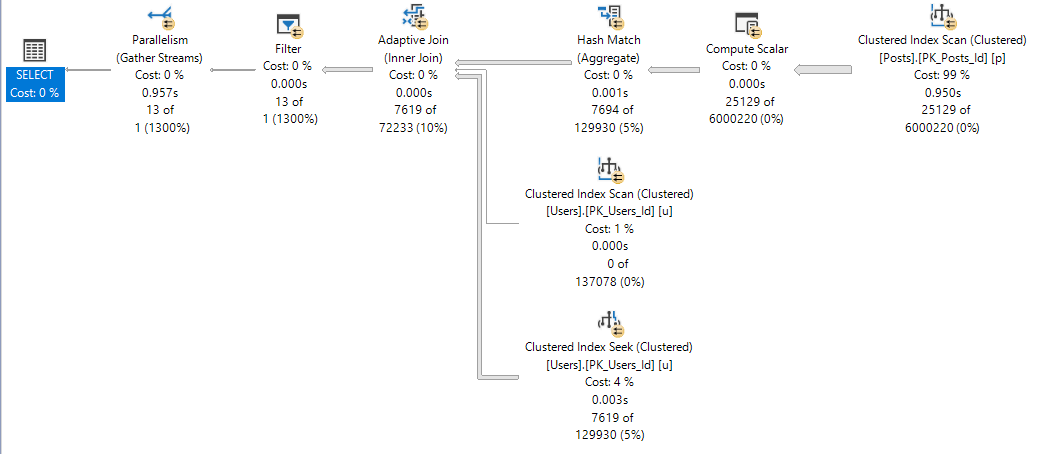
One and Lonely
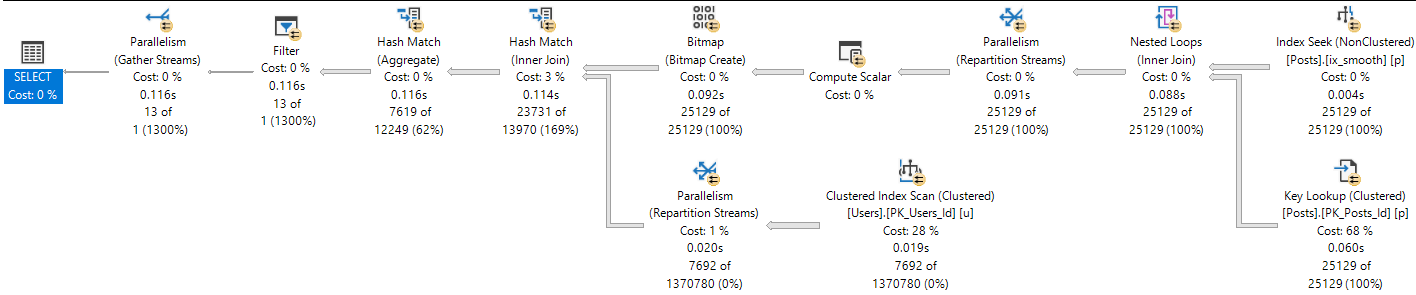
When one runs first, the plan is insanely different.
22 2s
It’s about 10 seconds faster. And the four plan?
Not too shabby.
Four play
We notice the difference between 116ms and 957ms in SSMS.
Are application end users aware of ~800ms? Sometimes I wonder.
Alma Matters
The adaptive join plan with batch mode operators is likely a better plan for a wider range of values than the small plan.
Batch mode is generally more efficient with larger row counts. The adaptive join means no one who doesn’t belong in nested loops hell will get stuck there (probably), and SQL Server will take a look at the query in between runs to try to find a happy memory grant medium (this doesn’t always work splendidly, but I like the effort).
Getting to the point, if you’re going to SQL Server 2019, and you want to get all these new goodies to help you avoid parameter sniffing, you’re gonna have to start getting used to those OPTIMIZE FOR hints, and using a value that results in getting the adaptive plan.
I wish there was a query hint that pushed the optimizer towards picking this sort of plan, so we don’t have to rely on potentially changing values to optimize for.
Thanks for reading!
Going Further
If this is the kind of SQL Server stuff you love learning about, you’ll love my training. I’m offering a 75% discount to my blog readers if you click from here. I’m also available for consulting if you just don’t have time for that and need to solve performance problems quickly.