SQL Server 2019: WAIT_ON_SYNC_STATISTICS_REFRESH Redux

Here’s Another One


In the first post, I looked at a relatively large table. 50 million rows is a decent size.

But 50 million row tables might not be the target audience for this wait.

So, we’re gonna go with a >2 billion row table. Yes, dear reader, this table would break your PUNY INTEGER limits.

Slightly different


The full setup scripts are pretty long, but I’ll show the basic idea here.

Because this table is going to be fairly large, I’m gonna use clustered column store for maximum compressions.

USE StackOverflow2013;
GO

DROP TABLE IF EXISTS dbo.Vetos;
GO

CREATE TABLE dbo.Vetos
(
    Id INT NOT NULL,
    PostId INT NOT NULL,
    UserId INT NULL,
    BountyAmount INT NULL,
    VoteTypeId INT NOT NULL,
    CreationDate DATETIME NOT NULL,
    INDEX c CLUSTERED COLUMNSTORE
);


INSERT INTO dbo.Vetos WITH(TABLOCKX)
SELECT ISNULL(v.Id, 0) AS Id,
       v.PostId,
       v.UserId,
       v.BountyAmount,
       v.VoteTypeId,
       v.CreationDate
FROM
(
SELECT * FROM dbo.Votes
UNION ALL

-- I'm snipping 18 union alls here

SELECT * FROM dbo.Votes
) AS v;

The first test is just with a single statistics object.

CREATE STATISTICS s_UserId ON dbo.Vetos (UserId);

Fork In The Road


Since every sane person in the world knows that updating column store indexes is a donkey, I’m switching to an insert to tick the modification counter up.

INSERT INTO dbo.Vetos WITH(TABLOCKX)
SELECT ISNULL(v.Id, 0) AS Id,
       v.PostId,
       v.UserId,
       v.BountyAmount,
       v.VoteTypeId,
       v.CreationDate
FROM
(
SELECT * FROM dbo.Votes
UNION ALL
SELECT * FROM dbo.Votes
UNION ALL
SELECT * FROM dbo.Votes
UNION ALL
SELECT * FROM dbo.Votes
UNION ALL
SELECT * FROM dbo.Votes
) AS v;

Query Time


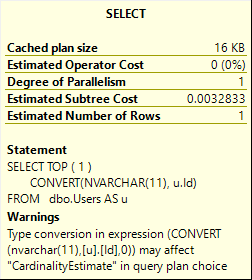
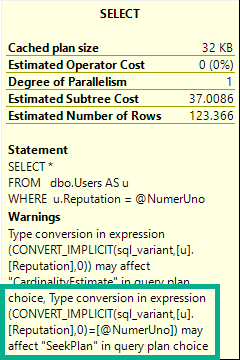
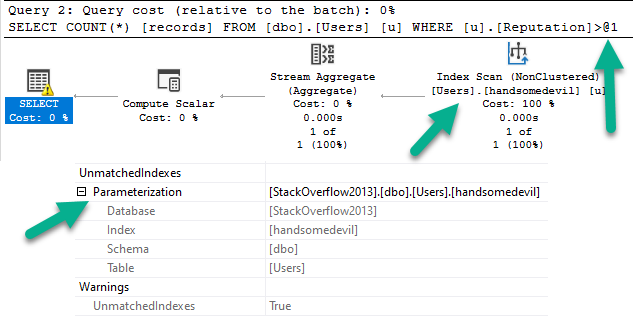
To test the timing out, I can use a pretty simple query that hits the UserId column:

SELECT COUNT_BIG(*)
FROM dbo.Vetos
WHERE UserId = 138
AND 1 = (SELECT 1);

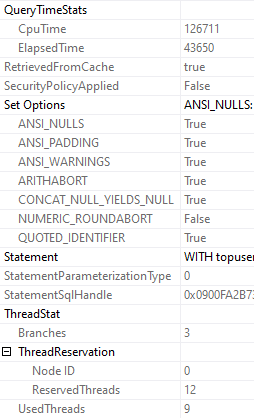
The query runs for ~3 seconds, and…

SQL Server Wait Stats
Takeover

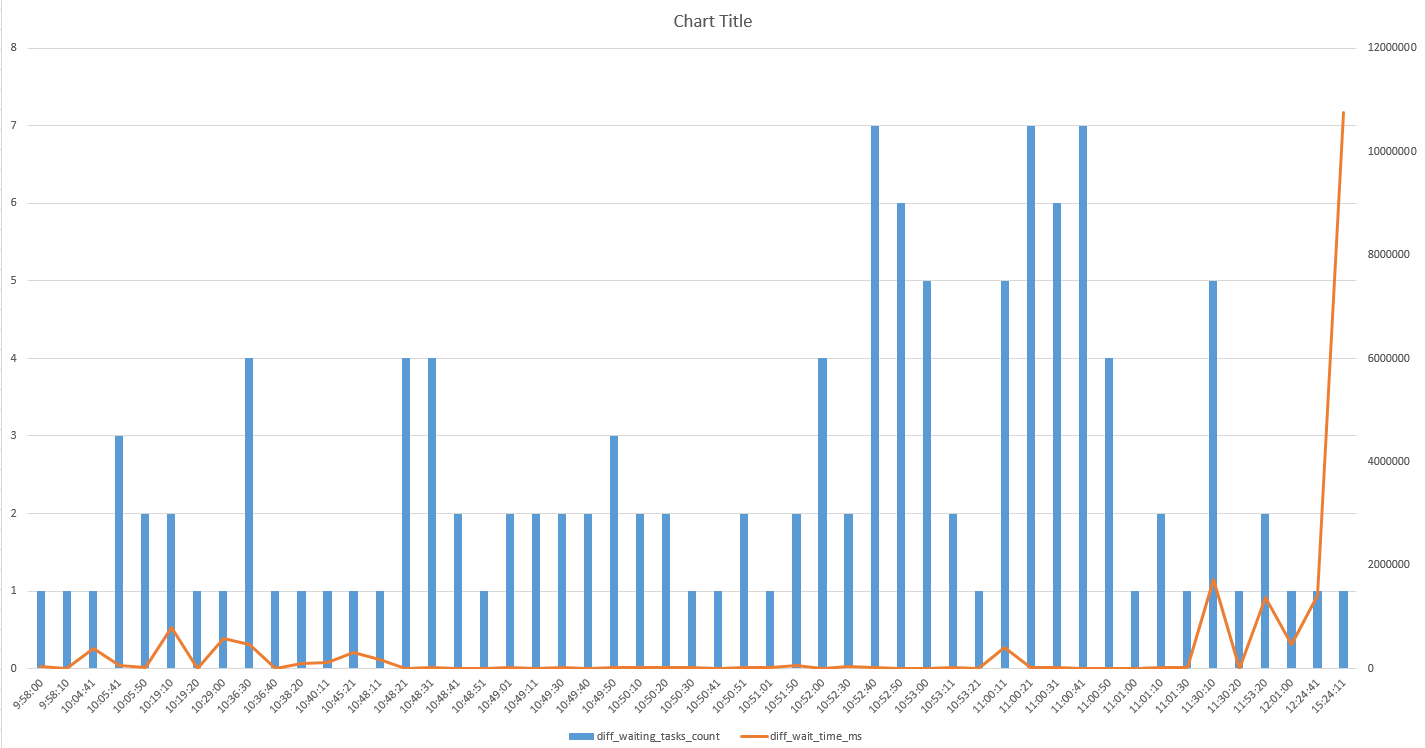
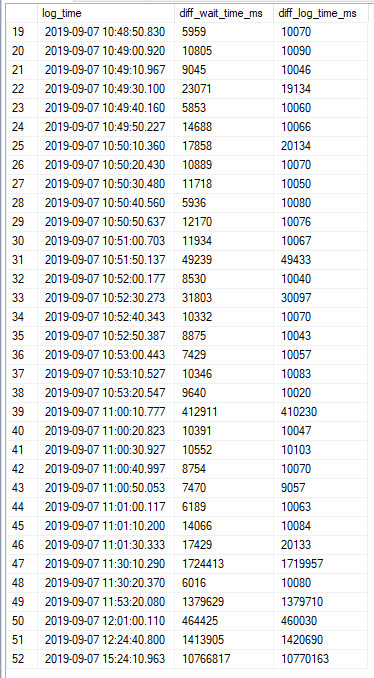
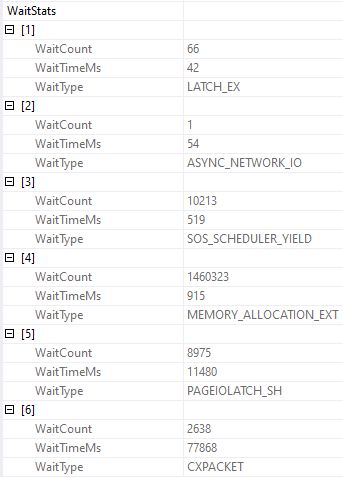
We spent most of that three seconds waiting on the stats refresh.

I know, you’re looking at those parallelism waits.

But what if the stats update went parallel? I’ll come back to this in another post.

Query Times Two


If you’re thinking that I could test this further by adding more stats objects to the UserId column you’d be dreadfully wrong.

SQL Server will only update one stats object per column. What’s the sense in updating a bunch of identical stats objects? I’ll talk about this more in another post, too.

If I reload the table, and create more stats objects on different columns, though…

CREATE STATISTICS s_UserId ON dbo.Vetos (UserId);
CREATE STATISTICS s_PostId ON dbo.Vetos (PostId);
CREATE STATISTICS s_BountyAmount ON dbo.Vetos (BountyAmount);
CREATE STATISTICS s_VoteTypeId ON dbo.Vetos (VoteTypeId);
CREATE STATISTICS s_CreationDate ON dbo.Vetos (CreationDate);

And then write a bigger query after inserting more data to tick up modification counters…

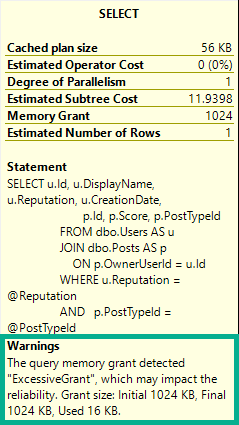
SELECT COUNT(*)
FROM dbo.Vetos
WHERE UserId = 138
AND   PostId = 138
AND   BountyAmount = 138
AND   VoteTypeId = 138
AND   CreationDate = 138;
SQL Server Wait Stats
Dangalang

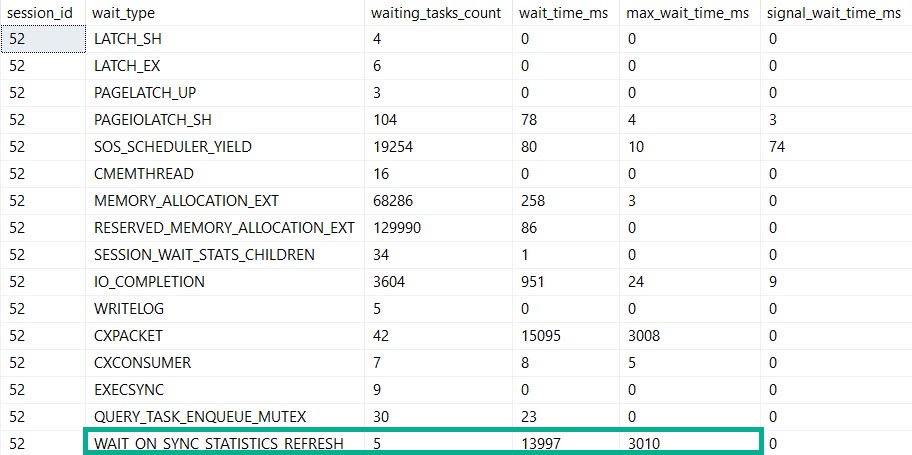
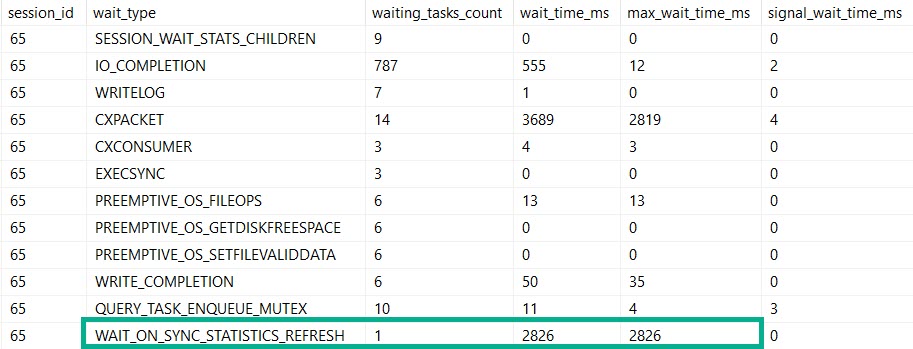
This query runs for 14 seconds, and all of it is spent in the stats update.

Bigger, Badder


Alright, prepare to be blown away: things that are fast against 50 million rows are slower against 2 billion rows.

That include automatic stats updates.

So yeah, if you’re up in the billion row range, automatic stats creation and updates might just start to hurt.

If you move to SQL Server 2019, you’ll have some evidence for when refreshes take a long time, but still nothing for when the initial creation takes a long time.

Thanks for reading!

Going Further


If this is the kind of SQL Server stuff you love learning about, you’ll love my training. I’m offering a 75% discount to my blog readers if you click from here. I’m also available for consulting if you just don’t have time for that and need to solve performance problems quickly.

Going To SQL Saturday Portland? Come To My Precon!

Training Daze


I’ve delighted to announce that I’ve been selected to present a full day session for SQL Saturday Portland.

The Oregon one, not the Maine one.

I’ll be delivering my Total Server Tuning session, where you’ll learn all sorts of horrible things about SQL Server.

I’m going to be talking about how queries interact with hardware, wait stats that matter, and query tuning.

Seats are limited, so hurry on up and get yourself one before you get FOMO in your MOJO.

Thanks for reading!

Going Further


If this is the kind of SQL Server stuff you love learning about, you’ll love my training. I’m offering a 75% discount to my blog readers if you click from here. I’m also available for consulting if you just don’t have time for that and need to solve performance problems quickly.

A Bug With OBJECTPROPERTYEX And Column Store Indexes

No, Not That Bug


There’s a known bug with partitioned tables, but this is different. This one is with rows in the delta store.

Here’s a quick repro:

USE tempdb;

DROP TABLE IF EXISTS dbo.busted;

CREATE TABLE dbo.busted ( id BIGINT, INDEX c CLUSTERED COLUMNSTORE );

INSERT INTO dbo.busted WITH ( TABLOCK )
SELECT     TOP ( 50000 )
           1
FROM       master..spt_values AS t1
CROSS JOIN master..spt_values AS t2
OPTION ( MAXDOP 1 );

-- reports 0, should be 50k
SELECT CAST(OBJECTPROPERTYEX(OBJECT_ID('dbo.busted'), N'Cardinality') AS BIGINT) AS [where_am_i?];
SELECT COUNT_BIG(*) AS records
FROM   dbo.busted;

INSERT INTO dbo.busted WITH ( TABLOCK )
SELECT     TOP ( 150000 )
           1
FROM       master..spt_values AS t1
CROSS JOIN master..spt_values AS t2
OPTION ( MAXDOP 1 );

-- reports 150k, should be 200k
SELECT CAST(OBJECTPROPERTYEX(OBJECT_ID('dbo.busted'), N'Cardinality') AS BIGINT) AS [where_am_i?];
SELECT COUNT_BIG(*) AS records
FROM   dbo.busted;

SELECT object_NAME(csrg.object_id) AS table_name, *
FROM sys.column_store_row_groups AS csrg
ORDER BY csrg.total_rows;

In Pictures


In Particular

This is the interesting bit, because you can obviously see the difference between open and compressed row groups.

SQL Server Query Results
Give us money

The 50k rows in the delta store aren’t counted towards table cardinality.

Thanks for reading!

Going Further


If this is the kind of SQL Server stuff you love learning about, you’ll love my training. I’m offering a 75% discount to my blog readers if you click from here. I’m also available for consulting if you just don’t have time for that and need to solve performance problems quickly.

SQL Saturday NYC: Three Weeks To Go!

I’m In Your Area


If you’re in the New York area and looking for some great free SQL Server training, head to SQL Saturday NYC.

We’ve got a great lineup of speakers covering a wide variety of topics that can help you learn no matter what your job function is.

And of course, if you’re looking for a full day of training, we’ve got a precon with Joe Obbish the Friday before the event (October 4th).

Joe Obbish – Clustered Columnstore For Performance

Buy Tickets Here!

Clustered columnstore indexes can be a great solution for data warehouse workloads, but there’s not a lot of advanced training or detailed documentation out there. It’s easy to feel all alone when you want a second opinion or run into a problem with query performance or data loading that you don’t know how to solve.

In this full day session, I’ll teach you the most important things I know about clustered columnstore indexes. Specifically, I’ll teach you how to make the right choices with your schema, data loads, query tuning, and columnstore maintenance. All of these lessons have been learned the hard way with 4 TB of production data on large, 96+ core servers. Material is applicable from SQL Server 2016 through 2019.

Here’s what I’ll be talking about:

– How columnstore compression works and tips for picking the right data types
– Loading columnstore data quickly, especially on large servers
– Improving query performance on columnstore tables
– Maintaining your columnstore tables

This is an advanced level session. To get the most out of the material, attendees should have some practical experience with columnstore and query tuning, and a solid understanding of internals such as wait stats analysis. You don’t need to bring a laptop to follow along.

Buy Tickets Here!

Location:

Courtyard Times Square – 114 West 40th street NY, NY 10018
Meeting Room – Lower Level  – Meeting Room A & B

I'm just a picture, don't click on me.


Going Further


If this is the kind of SQL Server stuff you love learning about, you’ll love my training. I’m offering a 75% discount to my blog readers if you click from here. I’m also available for consulting if you just don’t have time for that and need to solve performance problems quickly.

Live SQL Server Q&A!

ICYMI


Last week’s thrilling, stunning, flawless episode of whatever-you-wanna-call-it.

Going Further


If this is the kind of SQL Server stuff you love learning about, you’ll love my training. I’m offering a 75% discount to my blog readers if you click from here. I’m also available for consulting if you just don’t have time for that and need to solve performance problems quickly.

In SQL Server, Some Execution Plan Warnings Don’t Make Any Sense

First Time, Long Time


I’ve written about all of these separately in various places, so if you’ve been reading my blog(s) and Stack Exchange answers for a while, these may seem old news.

Of course, collecting them all in one place was inspired by another recent Q&A.

Let’s get going.

Eyeroll

SELECT TOP ( 1 )
       CONVERT(NVARCHAR(11), u.Id)
FROM   dbo.Users AS u;
Seems pretty explicit to me, pal.

Yep. I’d ignore this one all day long.

Squints

DECLARE @NumerUno SQL_VARIANT = '10000000';
SELECT *
FROM   dbo.Users AS u
WHERE  u.Reputation = @NumerUno;
Cheap haircut

That’s awfully presumptuous.

I don’t even have A index on Reputation, nevermind enough index to facilitate an entire Seek Plan.

I’ve seen this catch people off guard. They fix the implicit conversion, and expect an index seek.

Ah well.

Checks Notes

CREATE INDEX tabs
	ON dbo.Comments(UserId);

CREATE INDEX spaces
    ON dbo.Votes(UserId);

SELECT TOP (1) *
FROM   dbo.Comments AS c
JOIN   dbo.Votes AS v
    ON v.UserId = c.UserId
WHERE  c.UserId = 22656;
RFC

The check for this happens at the join. There’s no further down-plan check on the index access operations.

If there were, it’d see this:

Complaint Apartment

Only matching rows come out, anyway. The join predicate is, like, implied in the where clause.

Oh Um Sweatie No No No No No

CREATE INDEX handsomedevil
    ON dbo.Users(Reputation) 
        WHERE Reputation > 1000000;

SELECT COUNT(*) AS records
FROM dbo.Users AS u
WHERE u.Reputation > 1000000;
Ayyyyyyyy

So the simple parameterization thing fires off a warning about a filtered index that we used not being used.

yep yep yep yep yep yep

First Of All, Ew.

Genie In A Bottle

This thing needs some boundaries. Maybe like available memory should figure in or something?

Probably?

Call me, I have lots of great ideas.

Thanks for reading!

Going Further


If this is the kind of SQL Server stuff you love learning about, you’ll love my training. I’m offering a 75% discount to my blog readers if you click from here. I’m also available for consulting if you just don’t have time for that and need to solve performance problems quickly.

T-SQL Tuesday: Draw Your Own Execution Plans

Happy Little Operators


This month’s T-SQL Tuesday is a fun one. There’s only one problem: I’ve already blogged about my idea.

Instead, let’s talk about a different one: Editable Execution Plans.

We already have this to some degree via query hints and turning optimizer rules on and off.

The problem is that you have to remember all those crazy things, and some hints can affect multiple parts of the plan that you don’t want changed.

If the query you’re changing is in the middle of a big ol’ stored procedure, this process is even more tedious.

Glamorous


Let’s say you wanna experiment with different things, but not without re-running a query over and over to check on the plan with your written hints.

You could change:

  • Join order
  • Join types
  • Index choices
  • Aggregations
  • Seeks or Scans
  • Memory grants and fractions

Basically any element exposed in the XML would be up for grabs — I won’t list them all here, because I think you get the point.

Then you can run your query with your new plan.

If it’s a stunning success, you can force that plan.

Spool Removal


This has downsides, of course.

You could make things worse (but you could do that anyway — trust me, I do it all the time), you could get incorrect results, or errors if you remove certain operators (again, these are all things you can do by being silly anyway).

But, like query hints, this could be a really powerful tool in the hands of experienced query tuners, and people looking to get better at query tuning.

Thanks for reading!

Going Further


If this is the kind of SQL Server stuff you love learning about, you’ll love my training. I’m offering a 75% discount to my blog readers if you click from here. I’m also available for consulting if you just don’t have time for that and need to solve performance problems quickly.

What Is The PVS_PREALLOCATE Wait Type In SQL Server?

I was workload testing on SQL Server 2019 RC1 when I ran into a wait type I’d never noticed before: PVS_PREALLOCATE. Wait seconds per second was about 2.5 which was pretty high for this workload. Based on the name it sounded harmless but I wanted to look into it more to verify that.

The first thing that I noticed was that total signal wait time was suspiciously low at 12 ms. That’s pretty small compared to 55000000 ms of resource wait time and suggested a low number of wait events. During testing we log the output of sys.dm_os_wait_stats every ten seconds so it was easy to graph the deltas for wait events and wait time for PVS_PREALLOCATE during the workload’s active period:

SQL Server Wait Stats

This is a combo chart with the y-axis for the delta of waiting tasks on the left and the y-axis for the delta of wait time in ms on the right. I excluded rows for which the total wait time of PVS_PREALLOCATE didn’t change. As you can see, there aren’t a lot of wait events in total and SQL Server often goes dozens of minutes, or sometimes several hours, before a new wait is logged to the DMV.

This pattern looked like a single worker that was almost always in a waiting state. To get more evidence for that I tried comparing the difference in logging time with the difference in wait time. Here are the results:

SQL Server Wait Times

Everything matches within a margin of error of 10 seconds. Wait stats are logged every 10 seconds so everything fits. The data looks exactly as it should if a single session was almost always waiting on PVS_PREALLOCATE. I was able to find said session:

SQL Server Wait Types

I did some more testing on another server and found that all waits were indeed tied to a single internal session id. The PVS_PREALLOCATOR process starts up along with the SQL Server service and has a wait type of PVS_PREALLOCATE until it wakes up and has something to do. Blogging friend Forrest found this quote about ADR:

The off-row PVS leverages the table infrastructure to simplify storing and accessing versions but is highly optimized for concurrent inserts. The accessors required to read or write to this table are cached and partitioned per core, while inserts are logged in a non-transactional manner (logged as redo-only operations) to avoid instantiating additional transactions. Threads running in parallel can insert rows into different sets of pages to eliminate contention. Finally, space is pre-allocated to avoid having to perform allocations as part of generating a version.

That’s good enough for me. This wait type appears to be benign from a waits stats analysis point of view and I recommend filtering it out from your queries used to do wait stats analysis.

Thanks for reading!

Going Further


If this is the kind of SQL Server stuff you love learning about, you’ll love my training. I’m offering a 75% discount to my blog readers if you click from here. I’m also available for consulting if you just don’t have time for that and need to solve performance problems quickly.

Reading A Query Plan? Hit F4 To See All The Important Details.

Rabbit, Rabbit


I know, you’re sitting there and you’re staring at this post thinking “but I use Plan Explorer”.

I use it too, sometimes. The problem is that when I’m with a client, they don’t always have it.

More locally, I think there are some things SSMS visualizes better than Plan Explorer.

One example is rows on parallel threads. Another example is the operator times that started showing up a while back in SSMS 18, which aren’t there at all yet.

There’s some other stuff, but this isn’t what the post is about.

Complaint Department


A lot of the complaints people have about query plans in SSMS are with what’s in front of them.

It reminds me of a Futurama episode.

It’s one of the like, 2 episodes I remember. I think a dog dies or something in the other one.

Anyway, the redhead one from the staring meme moves in with the drunk robot one and thinks the apartment is a closet but then opens a door and reveals a big apartment with a great view at the end of the commercial delivery time.

The part of SSMS people complain about.

And I get it. There’s a real lack of attention paid to UX in query plans.

It’s not quite as bad as Extended Events, but it’s there.

BUUUUUUUUUUUUUUUUUUTT…

Button Pusher


I read a lot of posts about query plans, and I rarely see people bring up the properties tab.

And I get it. The F4 button is right next to the F5 button. If you hit the wrong one, you might ruin everything.

But hear me out, dear reader. I care about you. I want your query plan reading experience to be better.

Hit F4.

Look at what you can get, just from the SELECT operator:

SQL Server memory grant
Memory Grant

Ooey, gooey, memory grant info.

SQL Server missing index
Missing Indexes

If there’s more than one missing index, you can see all of them.

Now, yeah, this sucks because you can’t script them out. Assembling them from here is pretty crappy.

But at least it’s not just the first one that may or may not be the best one.

SQL Server ansi options
Goldmine

You can see the CPU and elapsed time. Since we’re on the select operator, we get the full plan’s timing.

If you get the properties on individual operators, you can see the timing for (most) specific operators.

One part that I love is ThreadStat, which tells you how many concurrent parallel branches, and how many threads your query reserved and used.

SQL Server wait stats
Waist. Waste. Waits.

You can also get wait stats, if you’re into that sort of thing.

And, yeah, this part leaves some data out. You won’t see CXCONSUMER here, or LCK_ waits, which is frustrating.

Nopebooks


Since query plans are what I primarily care about, I’m sticking with SSMS.

And when I look at query plans, I’m hitting F4.

Trust me. If you start poking around in there, you’ll be amazed at what you can find.

If only you knew how bad things really are.

Thanks for reading!

Going Further


If this is the kind of SQL Server stuff you love learning about, you’ll love my training. I’m offering a 75% discount to my blog readers if you click from here. I’m also available for consulting if you just don’t have time for that and need to solve performance problems quickly.

SQL Saturday NYC: Four Weeks To Go!

I’m In Your Area


If you’re in the New York area and looking for some great free SQL Server training, head to SQL Saturday NYC.

We’ve got a great lineup of speakers covering a wide variety of topics that can help you learn no matter what your job function is.

And of course, if you’re looking for a full day of training, we’ve got a precon with Joe Obbish the Friday before the event (October 4th).

Joe Obbish – Clustered Columnstore For Performance

Buy Tickets Here!

Clustered columnstore indexes can be a great solution for data warehouse workloads, but there’s not a lot of advanced training or detailed documentation out there. It’s easy to feel all alone when you want a second opinion or run into a problem with query performance or data loading that you don’t know how to solve.

In this full day session, I’ll teach you the most important things I know about clustered columnstore indexes. Specifically, I’ll teach you how to make the right choices with your schema, data loads, query tuning, and columnstore maintenance. All of these lessons have been learned the hard way with 4 TB of production data on large, 96+ core servers. Material is applicable from SQL Server 2016 through 2019.

Here’s what I’ll be talking about:

– How columnstore compression works and tips for picking the right data types
– Loading columnstore data quickly, especially on large servers
– Improving query performance on columnstore tables
– Maintaining your columnstore tables

This is an advanced level session. To get the most out of the material, attendees should have some practical experience with columnstore and query tuning, and a solid understanding of internals such as wait stats analysis. You don’t need to bring a laptop to follow along.

Buy Tickets Here!

Location:

Courtyard Times Square – 114 West 40th street NY, NY 10018
Meeting Room – Lower Level  – Meeting Room A & B

I'm just a picture, don't click on me.

Going Further


If this is the kind of SQL Server stuff you love learning about, you’ll love my training. I’m offering a 75% discount to my blog readers if you click from here. I’m also available for consulting if you just don’t have time for that and need to solve performance problems quickly.