Though I would be cool with new ones, as long as they’re not memes.
When you’re trying to gauge some high level performance metrics on a new server, you probably have your favorite scripts.
They could be various Blitzes, they could be some stuff you’ve had sitting in your script folder, maybe they’re from the Tiger Toolbox.
Whatever.
The point is that you, dear reader, are smart and engaged enough to know about and use these things.
A lot of people aren’t.
I’m not talking about another thing to go find and install. I mean these should come with the product.
Perf Schema
It would be really cool if SQL Server had a system schema called perf. In there you could have views to all sorts of neat things.
It would exist in every database, and it would have views in it to fully assemble the mess of DMVs that accompany:
Query Store
Plan Cache
Index Usage
Missing Indexes
File Stats
Wait Stats
Locking
Deadlocks
Assembling all those views is painful for beginners (heck Query Store is painful for everyone). Worse, they may find scripts on the internet that are wrong or outdated (meaning they may not have new columns, or they may give outdated advice on things).
What would make these particularly helpful is that they could aggregate metrics at the database level. Server-wide counters are cool until your server is really wide, and it’s impossible to tell where stuff like wait stats are coming from. This wouldn’t be too difficult to implement, since Azure SQLDB already has to have a bunch of self-contained stuff, due to the lack of cross-database queries.
Best of all, Microsoft can keep them up to date based on which version and edition of SQL Server you’re on, and if certain changes get back ported.
Thanks for reading!
Going Further
If this is the kind of SQL Server stuff you love learning about, you’ll love my training. I’m offering a 75% discount to my blog readers if you click from here. I’m also available for consulting if you just don’t have time for that and need to solve performance problems quickly.
Having some key lookups in your query plans is generally unavoidable.
You’ll wanna select more columns than you wanna put in a nonclustered index, or ones with large data types that you don’t wanna bloat them with.
Enter the key lookup.
They’re one of those things — I’d say even the most common thing — that makes parameterized code sensitive to the bad kind of parameter sniffing, so they get a lot of attention.
The thing is, most of the attention that they get is just for columns you’re selecting, and most of the advice you get is to “create covering indexes”.
That’s not always possible, and that’s why I did this session a while back on a different way to rewrite queries to sometimes make them more efficient. Especially since key lookups may cause blocking issues.
Milk and Cookies
At some point, everyone will come across a key lookup in a query plan, and they’ll wonder if tuning it will fix performance.
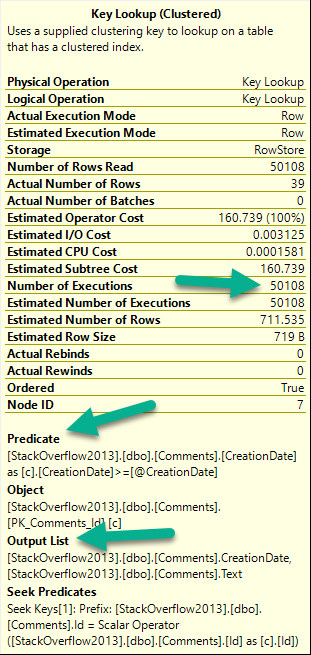
There are three things to pay attention to when you look at a key lookup:
I know what to do
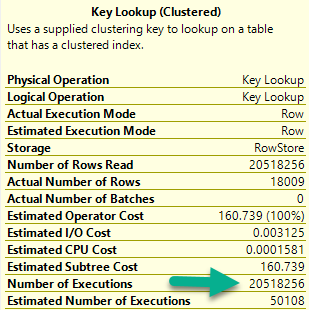
Number of executions: This is usually more helpful in an actual plan
If there are any Predicates involved: That means there are parts of your where clause not in your nonclustered index
If there’s an Output List involved: That means you’re selecting columns not in your nonclustered index
For number of executions, generally higher numbers are worse. This can be misleading if you’re looking at a cached plan because… You’re going to see the cached number, not the runtime number. They can be way different.
Notice I’m not worried about the Seek Predicates here — that just tells us how the clustered index got joined to the nonclustered index. In other words, it’s the clustered index key column(s).
Figure It Out
Here’s our situation: we’re working on a new stored procedure.
CREATE PROCEDURE dbo.predicate_felon (@Score INT, @CreationDate DATETIME)
AS
BEGIN

    SELECT *
    FROM dbo.Comments AS c
    WHERE c.Score = @Score
    AND   c.CreationDate >= @CreationDate
    ORDER BY c.CreationDate DESC;

END;
Right now, aside from the clustered index, we only have this nonclustered index. It’s great for some other query, or something.
CREATE INDEX ix_whatever
ON dbo.Comments (Score, UserId, PostId)
GO
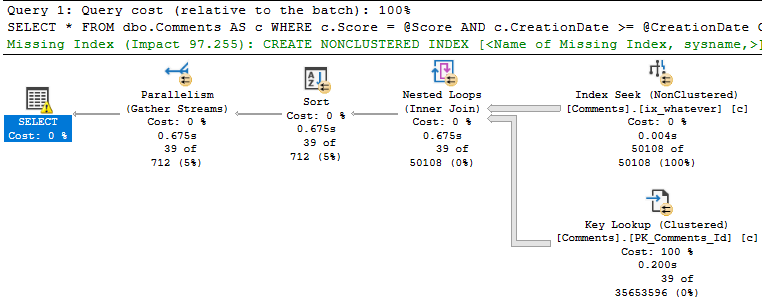
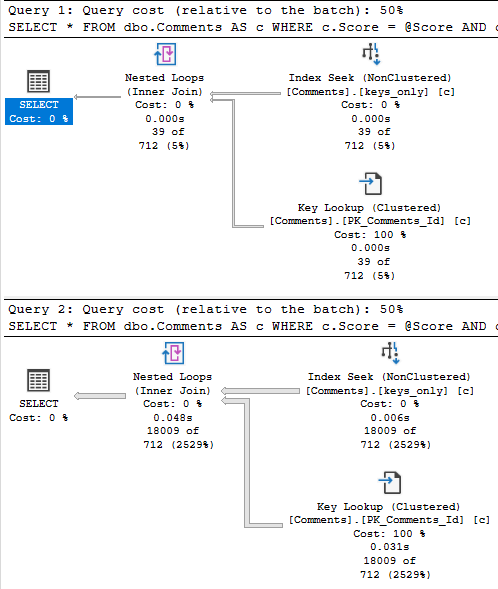
When we run the stored procedure like this, it’s fast.
SQL Server wants an index — a fully covering index — but if we create it, we end up a 7.8GB index that has every column in the Comments table in it. That includes the Text column, which is an NVARCHAR(700). Sure, it fixes the key lookup, but golly and gosh, that’s a crappy index to have hanging around.
Bad Problems On The Rise
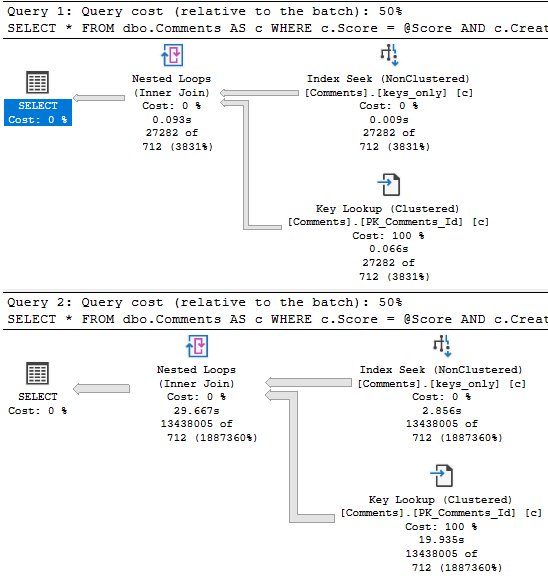
The issue turns up when we run the procedure like this:
EXEC dbo.predicate_felon @Score = 0, --El Zero
                         @CreationDate = '2013-12-31';
Not so much.
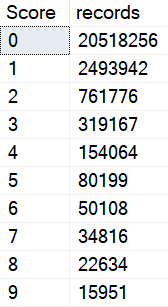
This happens because there are a lot more 0 scores than 6 scores.
Quiet time
Smarty Pants
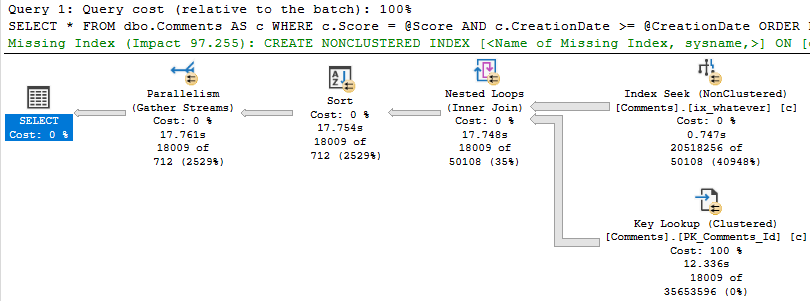
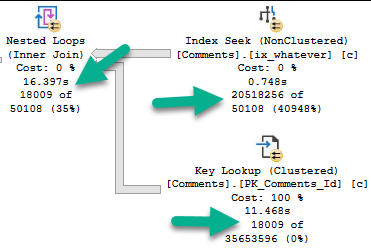
Eagle eyed readers will notice that the second query only returns ~18k rows, but it takes ~18 seconds to do it.
The problem is how much time we spend locating those rows. Sure, we can Seek into the nonclustered index to find all the 0s, but there are 20.5 million of them.
Looking at the actual plan, we can spot a few things.
Hunger ManagementHangman
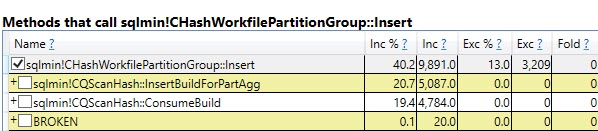
The 18k rows we end up with are only filtered to with they key lookup, but it has to execute 20.5 million times to evaluate that extra predicate.
If we just index the key columns, the key lookup to get the other columns (PostId, Text, UserId) will only execute ~18k times. That’s not a big deal at all.
CREATE NONCLUSTERED INDEX keys_only
    ON dbo.Comments ( Score, CreationDate );
This index is only ~500MB, which is a heck of a lot better than nearly 8GB covering the entire thing.
With that in place, both the score 6 and score 0 plans are fast.
rq
Why This Is Effective, and When It Might Not Be
This works here because the date filter is restrictive.
When we can eliminate more rows via the index seek, the key lookup is less of a big deal.
If the date predicate were much less restrictive, say going back to 2011, boy oh boy, things get ugly for the 0 query again.
Of course, returning that many rows will suck no matter what, so this is where other techniques come in like Paging, or charging users by the row come into play.
What? Why are you looking at me like that?
Thanks for reading!
Going Further
If this is the kind of SQL Server stuff you love learning about, you’ll love my training. I’m offering a 75% discount to my blog readers if you click from here. I’m also available for consulting if you just don’t have time for that and need to solve performance problems quickly.
I’ve delighted to announce that I’ve been selected to present a full day session for SQL Saturday Portland.
The Oregon one, not the Maine one.
I’ll be delivering my Total Server Tuning session, where you’ll learn all sorts of horrible things about SQL Server.
I’m going to be talking about how queries interact with hardware, wait stats that matter, and query tuning.
Seats are limited, so hurry on up and get yourself one before you get FOMO in your MOJO.
Thanks for reading!
Going Further
If this is the kind of SQL Server stuff you love learning about, you’ll love my training. I’m offering a 75% discount to my blog readers if you click from here. I’m also available for consulting if you just don’t have time for that and need to solve performance problems quickly.
Today we’re going to look at how unused indexes add to locking problems.
Hold My Liquor
Going Further
If this is the kind of SQL Server stuff you love learning about, you’ll love my training. I’m offering a 75% discount to my blog readers if you click from here. I’m also available for consulting if you just don’t have time for that and need to solve performance problems quickly.
When you find unused indexes, whether using Some Script From The Internet™, sp_BlitzIndex, or Database Telepathy, the first thing most people think of is “wasted space”.
Sure, okay, yeah. That’s valid. They’re in backups, restores, they get hit by CHECKDB. You probably rebuild them if there’s a whisper of fragmentation.
But it’s not the end of the story.
Not by a long shot.
Today we’re going to look at how redundant indexes can clog the buffer pool up.
Holla Back
If you want to see the definitions for the views I’m using, head to this post and scroll down.
Heck, stick around and watch the video too.
LIKE AND SUBSCRIBE.
Now, sp_BlitzIndex has two warnings to catch these “bad” indexes:
Unused Indexes With High Writes
NC Indexes With High Write:Read Ratio
Unused are just what they sound like: they’re not helping queries read data at all. Of course, if you’ve rebooted recently, or rebuilt indexes on buggy versions of SQL Server, you might get this warning on indexes that will get used. I can’t fix that, but I can tell you it’s your job to keep an eye on usage over time.
Indexes with a high write to read ratio are also pretty self-explanatory. They’re sometimes used, but they’re written to a whole lot more. Again, you should keep an eye on this over time, and try to understand both how important they might be to your workload, or how much they might be hurting your workload.
I’m not going to set up a fake workload to generate those warnings, but I am going to create some overlapping indexes that might be good candidates for you to de-clutter.
Index Entrance
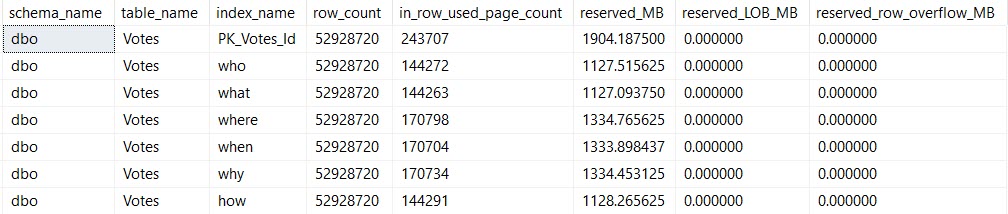
The Votes table is pretty narrow, but it’s also pretty big — 53 million rows or so as of Stack 2013.
Here are my indexes:
CREATE INDEX who ON dbo.Votes(PostId, UserId) INCLUDE(BountyAmount);
CREATE INDEX what ON dbo.Votes(UserId, PostId) INCLUDE(BountyAmount);
CREATE INDEX [where] ON dbo.Votes(CreationDate, UserId) INCLUDE(BountyAmount);
CREATE INDEX [when] ON dbo.Votes(BountyAmount, UserId) INCLUDE(CreationDate);
CREATE INDEX why ON dbo.Votes(PostId, CreationDate) INCLUDE(BountyAmount);
CREATE INDEX how ON dbo.Votes(VoteTypeId, BountyAmount) INCLUDE(UserId);
First, I’m gonna make sure there’s nothing in memory:
CHECKPOINT;
GO 2
DBCC DROPCLEANBUFFERS;
GO
Don’t run that in production. It’s stupid if you run that in production.
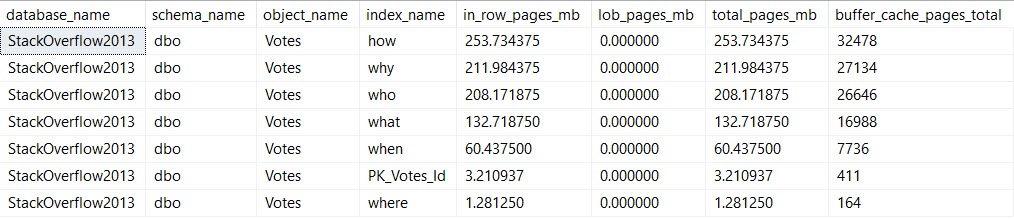
Now when I go to look at what’s in memory, nothing will be there:
SELECT *
FROM dbo.WhatsUpMemory AS wum
WHERE wum.object_name = 'Votes'
I’m probably not going to show you the results of an empty query set. It’s not too illustrative.
I am going to show you the index sizes on disk:
SELECT *
FROM dbo.WhatsUpIndexes AS wui
WHERE wui.table_name = 'Votes';
Size Mutters
And I am going to show you this update:
UPDATE v
SET v.BountyAmount = 2147483647
FROM dbo.Votes AS v
WHERE v.BountyAmount IS NULL
AND   v.CreationDate >= '20131231'
AND v.VoteTypeId > 2;
After The Update
This is when things get more interesting for the memory query.
Life Of A Moran
We’re updating the column BountyAmount, which is present in all of the indexes I created. This is almost certainly an anti-pattern, but it’s good to illustrate the problem.
Pieces of every index end up in memory. That’s because all data needs to end up in memory before SQL Server will work with it.
It doesn’t need the entirety of any of these indexes in memory — we’re lucky enough to have indexes to help us find the 10k or so rows we’re updating. I’m also lucky enough to have 64GB of memory dedicated to this instance, which can easily hold the full database.
But still, if you’re not lucky enough to be able to fit your whole database in memory, wasting space in the buffer pool for unused (AND OH GODD PROBABLY FRAGMENTED) indexes just to write to them is a pretty bad idea.
After all, it’s not just the buffer pool that needs memory.
You also need memory for memory grants (shocking huh?), and other caches and activities (like the plan cache, and compressed backups).
Cleaning up those low-utilization indexes can help you make better use of the memory that you have.
Thanks for reading!
Going Further
If this is the kind of SQL Server stuff you love learning about, you’ll love my training. I’m offering a 75% discount to my blog readers if you click from here. I’m also available for consulting if you just don’t have time for that and need to solve performance problems quickly.
If this is the kind of SQL Server stuff you love learning about, you’ll love my training. I’m offering a 75% discount to my blog readers if you click from here. I’m also available for consulting if you just don’t have time for that and need to solve performance problems quickly.
If you seriously want to debug, you’ve gotta use something like WinDbg. It’s tough, but powerful.
It’s also… Where do you even start? The most common thing to do is set a Break Point.
Figuring out where you wanna set it can be challenging.
Sometimes you can capture a thread and step through the code.
Sometimes you can find the call stack you want by searching through symbols
The problem with these is that stepping through code that runs in milliseconds has taken me over an hour at times, and call stacks often have cryptic names.
In the meantime, you’ll have to get the intro material from me. I recently used it to help answer a tough question.
There are times when traditional troubleshooting methods won’t help you.
Instructional
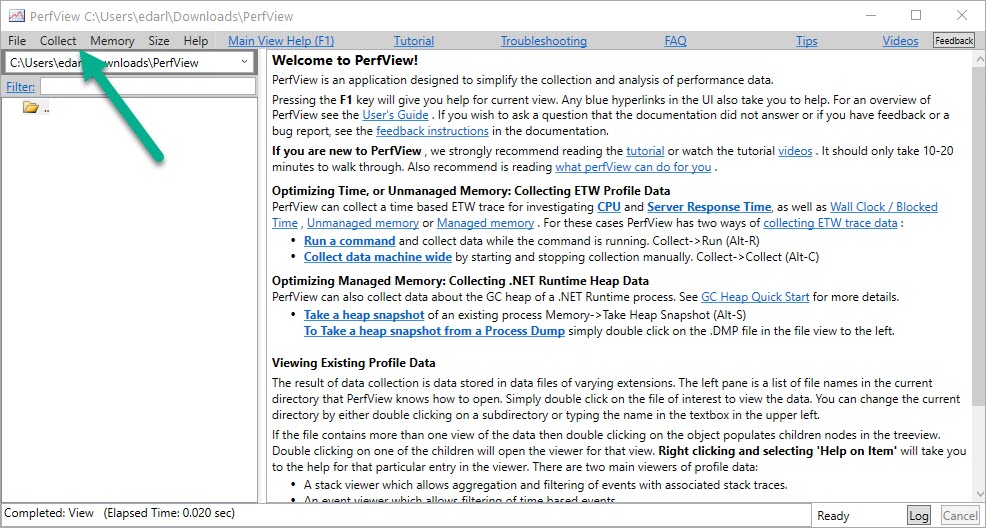
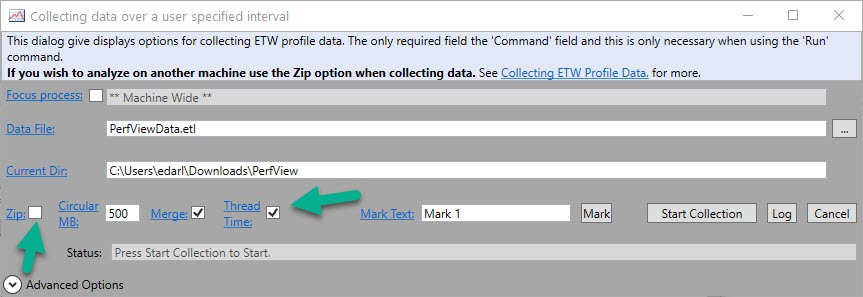
PerfView is just an executable. I like to stick it in its own folder; it keeps the files that get created together.
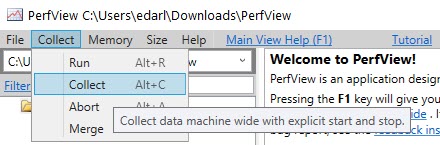
When you open it up, you’re gonna wanna hit the Collect menu.
Greetings
Hit collect (or Alt+C, now that you peeked, cheater).
Jane’s Collection
I usually skip zipping, unless I know I’m going to send these to someone else. You can always zip them later.
I like to grab thread time. I dunno why. I’ve always done it, and I’m superstitious.
I also listen to Planet Earth every time I’m on a plane taking off because it assures a safe trip. Right?
Right.
Choices, Choices
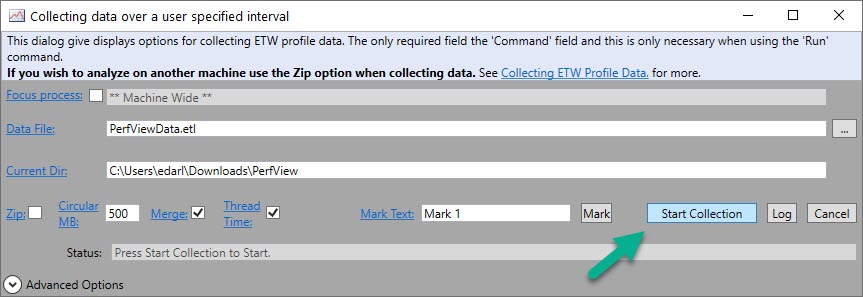
Next, when you’re ready to get stuff, hit Start Collection. This button will change to Stop Collection after you click it.
You’ll wanna stop the trace when the thing you wanna profile is done running, or when you think you’ve got sufficient sample.
Starter
Now, I have to warn you here. You don’t wanna take a long collection. These files get big.
You also have to factor in that profiling code can slow it down.
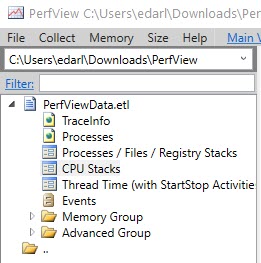
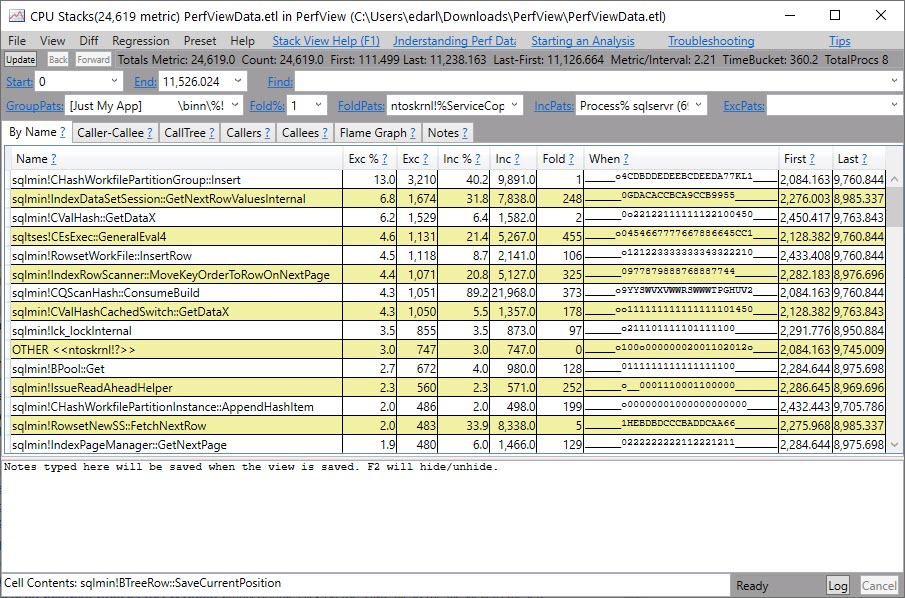
CPU Stacks
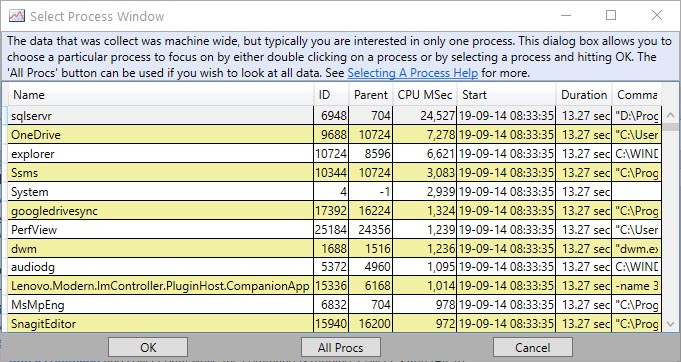
CPU stacks are where I go next. When you double click on that, you’ll get a pop up to pick which application you wanna dig into.
PerfView collects system wide. So really, please, please, please don’t run it for a very long time.
sqlservr
Double click into sqlservr, and you’ll get a list of stuff.
Greatest
It won’t look like this for you at first. There’ll be a lot of jibberish and question marks. You need to get symbols for them to make sense.
Symbology
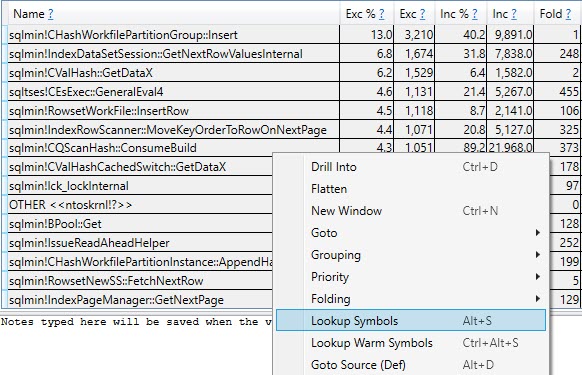
Hit ctrl+a to highlight the whole list of lines, then either hit alt+s or right click and select Lookup Symbols.
If it’s your first time doing this, it might take a while to download them, but you really need to do this part to make any sense of what’s going on.
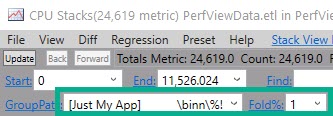
Do Not Group Or Fold
The next thing you wanna do is clear out GroupPats — just highlight, hit delete, and then enter.
Next, change Fold% to 0 and hit enter.
This’ll make sure you get the most detail from your sample.
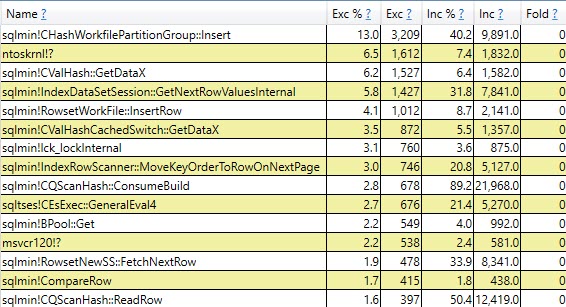
Fortunate
You can click around here to get other views of the data.
Mean to it.
How Does This Relate To Debugging?
Well, see those list of call stacks up there? That’s what you use to set Break Points in a debugger.
You might see something interesting there that either doesn’t have the full detail you’re after, or you want to follow more closely.
Either way, this is a good example of how to take a closer look at what SQL Server is up to under the hood without getting lost in a debugger.
Thanks for reading!
Going Further
If this is the kind of SQL Server stuff you love learning about, you’ll love my training. I’m offering a 75% discount to my blog readers if you click from here. I’m also available for consulting if you just don’t have time for that and need to solve performance problems quickly.
Under most circumstances, this won’t happen. Most.
Shared locks taken by read queries will let go pretty quickly.
Under most circumstances.
Out, Liars
To hold onto Shared locks, you’d need to use an isolation level escalation hint, like REPEATABLE READ.
I could do that here if I were a lazy cheater.
Instead, I’m going to show you a more common and interesting scenario.
You see, like a lot of important specks of knowledge, this one comes from Craig Freedman:
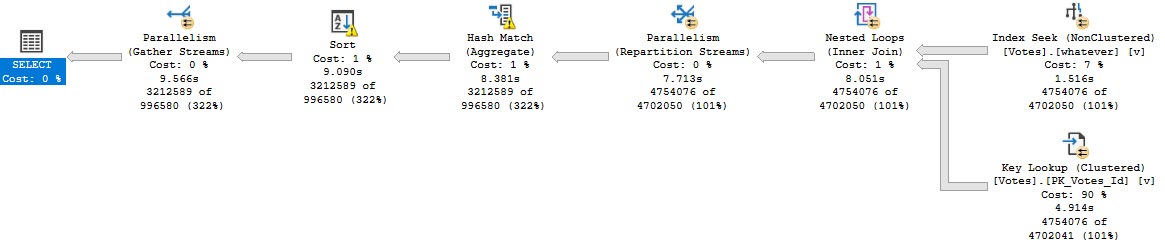
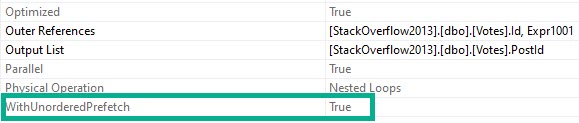
Note the “WITH UNORDERED PREFETCH” keywords on the nested loops join.
I am not going to demontrate it , but when SQL Server executes this query, it holds S locks on the rows returned by the index seek until the query finishes executing.
I’m going to be a little bit of a lazy cheater here, and rather than show you where this can happen with parameter sniffing or some other weird optimizer choice, I’m going to use an index hint to use this index:
CREATE INDEX whatever ON dbo.Votes(CreationDate, VoteTypeId);
Then I’m going to run this query, which’ll take about 10 seconds:
DECLARE @i INT
SELECT   @i = v.PostId
FROM     dbo.Votes AS v WITH (INDEX = whatever)
WHERE    v.CreationDate >= '20080101'
AND      v.VoteTypeId > 5
GROUP BY v.PostId
ORDER BY v.PostId;
Here’s what the query plan looks like:
Your My Best Wishes
And when we get the properties of the Nested Loops Join, we’ll see the Unordered Prefetch property set to true.
Steve Prefetchtaine
If I kick that query off and look at the results of sp_WhoIsActive @get_locks = 1, I’ll see this:
Which is exactly what I want — a Shared object lock on Votes that has been GRANTed. That’ll get held onto for the duration of the query.
Now when I try to run this update, it’ll get blocked:
BEGIN TRAN
UPDATE dbo.Votes SET UserId = 2147483647
ROLLBACK
Note that I’m only wrapping it in a transaction here so it’ll roll back. It will still get blocked without that, but then I’d have to reverse the update on my own.
And Who Is Active is showing us that the read query has been blocking the write query for around 4 seconds.
Capper
If you’re out there in the world and you see a read query that blocked a write query, take a close look at the query plan for a Nested Loops Join with the Unordered Prefetch property set to true.
I bet you’ll find one. And I’ll bet your query wasn’t fast.
Fixing the Key Lookup may not make your query faster, but it should alleviate the blocking because of long-held shared locks.
Thanks for reading!
Going Further
If this is the kind of SQL Server stuff you love learning about, you’ll love my training. I’m offering a 75% discount to my blog readers if you click from here. I’m also available for consulting if you just don’t have time for that and need to solve performance problems quickly.
In yesterday’s post, we looked at MSTVFs. Today, we’re going to look at inlined functions.
And I know, that sounds weird. But it’s because we’re going to circle back to scalar valued functions, and how they’re inlined in SQL Server 2019 as well.
There’s stuff in here you’ll have to look out for when you move to SQL Server 2019.
Side By Side
The first thing we need is the function itself, which is just an inlined version of the others.
CREATE OR ALTER FUNCTION dbo.CommentsAreHorribleInline(@Id INT)
RETURNS TABLE
WITH SCHEMABINDING
AS
RETURN
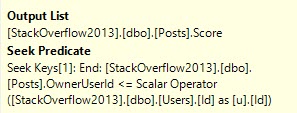
SELECT (SELECT SUM(Score) FROM dbo.Posts AS p WHERE p.OwnerUserId <= @Id)
-
(SELECT COUNT_BIG(*) FROM dbo.Comments AS c WHERE c.UserId <= @Id) AS Tally
GO
Where these differ from both kinds of functions, is that you can’t find them ANYWHERE on their own.
They don’t appear in any DMVs, or in the plan cache as isolated code. Since they’re inlined, it’s just a part of whatever query references it.
Let’s start simple, though:
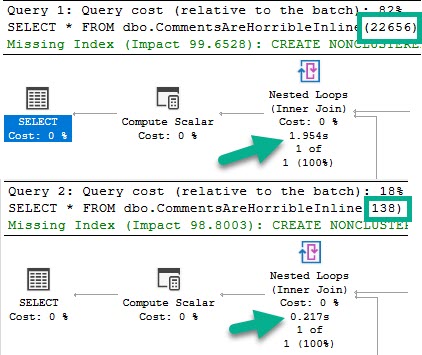
SELECT * FROM dbo.CommentsAreHorribleInline(22656);

SELECT * FROM dbo.CommentsAreHorribleInline(138);
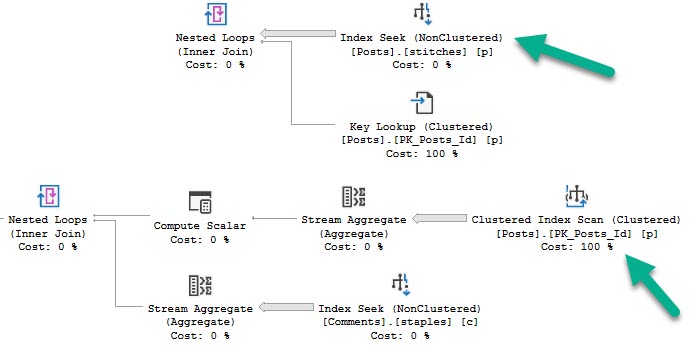
Like in the other posts, the chief difference between these two plans is the index access choice.
The 22656 plan scans the clustered index, and the 138 plan does a nonclustered index seek with a key lookup.
Check the other posts in the series for pictures of that if you’re interested.
Tops and Bottoms
As in the other examples, the clustered index scan is considerably slower than the nonclustered index seek plan.
But that’s not where things are interesting. Where they’re interesting is when we call the function in a “larger” query.
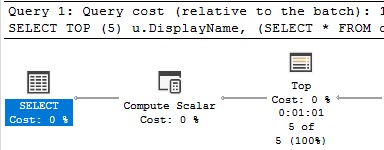
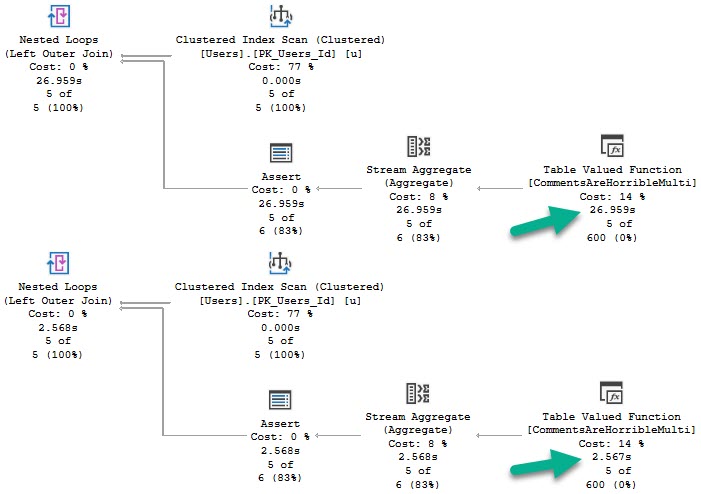
SELECT TOP (5) u.DisplayName,
       (SELECT * FROM dbo.CommentsAreHorribleInline(u.Id))
FROM dbo.Users AS u
GO
Spool And Spool Alike
This query runs for a full minute.
Adios
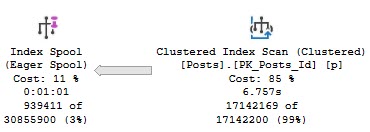
We see why early on — an eager index spool.
You again.
This appears to happen because the optimizer is drunk as hell doesn’t like the idea of scanning the clustered index, or recycling the seek + lookup 5 times.
The index reflects what a two column clustered index keyed on OwnerUserId would look like.
Think about it like if you selected OwnerUserId and Score into a #temp table and put a clustered index on the table with the key on OwnerUserId.
Damaja
Remember that part of the reason for this plan change is that we’re no longer just subtracting one aggregate from another like when we call the function on its own, there’s the additional “join” to the Users table. Correlated subqueries are just that — joins.
Solitaire
Futurist
I’d love to have more to say about how this changes in SQL Server 2019, but an identical pattern occurs, similar to what I blogged about earlier in the summer.
I caught some private flack about how the TOP (1) pattern in that post could easily be replace with an aggregate like MIN.
While that’s totally true, there’s no similar replacement for this pattern. We could expand the index to cover the Score column to get rid of the spool, which goes back to another post I wrote about 2019 optimizer features, where you’ll need wider (covering) indexes for them to be used.
Thanks for reading!
Going Further
If this is the kind of SQL Server stuff you love learning about, you’ll love my training. I’m offering a 75% discount to my blog readers if you click from here. I’m also available for consulting if you just don’t have time for that and need to solve performance problems quickly.
In yesterday’s post, we looked at we looked at simple scalar function plan caching.
Today, we’ll look at MSTVFs. If you’re not sure what that means, look at the title of the post real quick.
Yeah, up there.
On we go.
Dirty Version
The function will do the same thing as before, just rewritten to be a MSVTF.
CREATE OR ALTER FUNCTION dbo.CommentsAreHorribleMulti(@Id INT)
RETURNS @Tally TABLE(Tally BIGINT)
WITH SCHEMABINDING
AS
BEGIN
INSERT @Tally ( Tally )
SELECT (SELECT SUM(Score) FROM dbo.Posts AS p WHERE p.OwnerUserId <= @Id)
	   -
	   (SELECT COUNT_BIG(*) FROM dbo.Comments AS c WHERE c.UserId <= @Id)
RETURN
END
GO
Now, where these differ immediately from SVFs (scalar valued functions), is that they don’t show up in the plan cache by name.
Wrong Hook
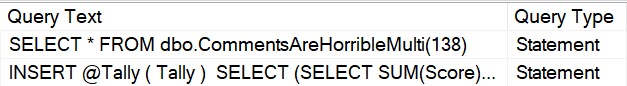
Note that these are both “statements”.
Also, unlike SVFs, they don’t show up in dm_exec_function_stats. This is documented behavior, but whatever.
And even though they’re called a “Proc” in dm_exec_cached_plans, they only show up in dm_exec_query_stats, not dm_exec_procedure_stats (which is why BlitzCache calls them a Statement).
Different Sniffint
Unlike SVFs, which don’t have a restriction on the function body using parallelism, all table variable modifications are forced to run serially (unless you’re sneaky).
That means both insert queries will be serialized, with the main difference being index access.
arrowed
Like before, if we cache either plan, it will get reused. And just like before, the clustered index scan plan is significantly slower.
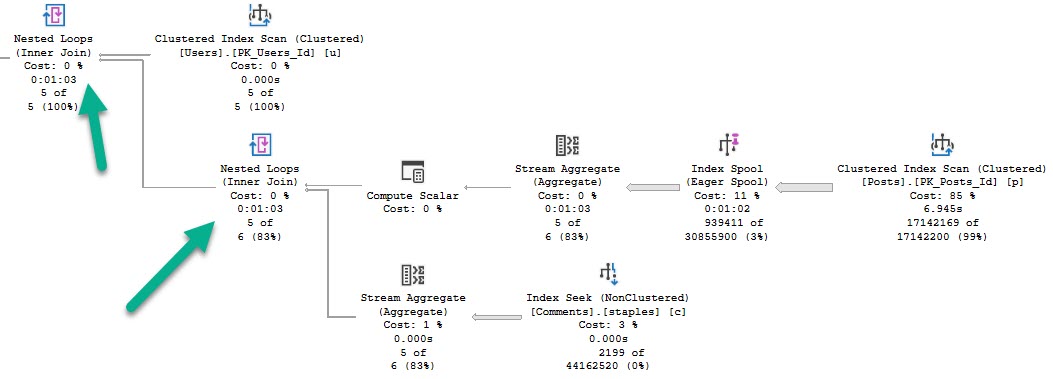
SELECT TOP (5) u.DisplayName,
       (SELECT * FROM dbo.CommentsAreHorribleMulti(u.Id))
FROM dbo.Users AS u
Old Dress
Plan Noir
Just like scalar functions, these can have different plans cached and reused, and may fall victim to parameter sniffing.
Again, this depends a lot on how the function is called and used. It’s just something to be aware of when tuning queries that call functions.
Execution times may vary greatly depending on… well…
Parameters.
Thanks for reading!
Going Further
If this is the kind of SQL Server stuff you love learning about, you’ll love my training. I’m offering a 75% discount to my blog readers if you click from here. I’m also available for consulting if you just don’t have time for that and need to solve performance problems quickly.